🇳🇱
Netherlands
3755 records · 132 indicators · 1990–2025
3,755
Data Records
132
Indicators
1990–2025
Time Range
NLD
ISO Code
Latest Indicator Values
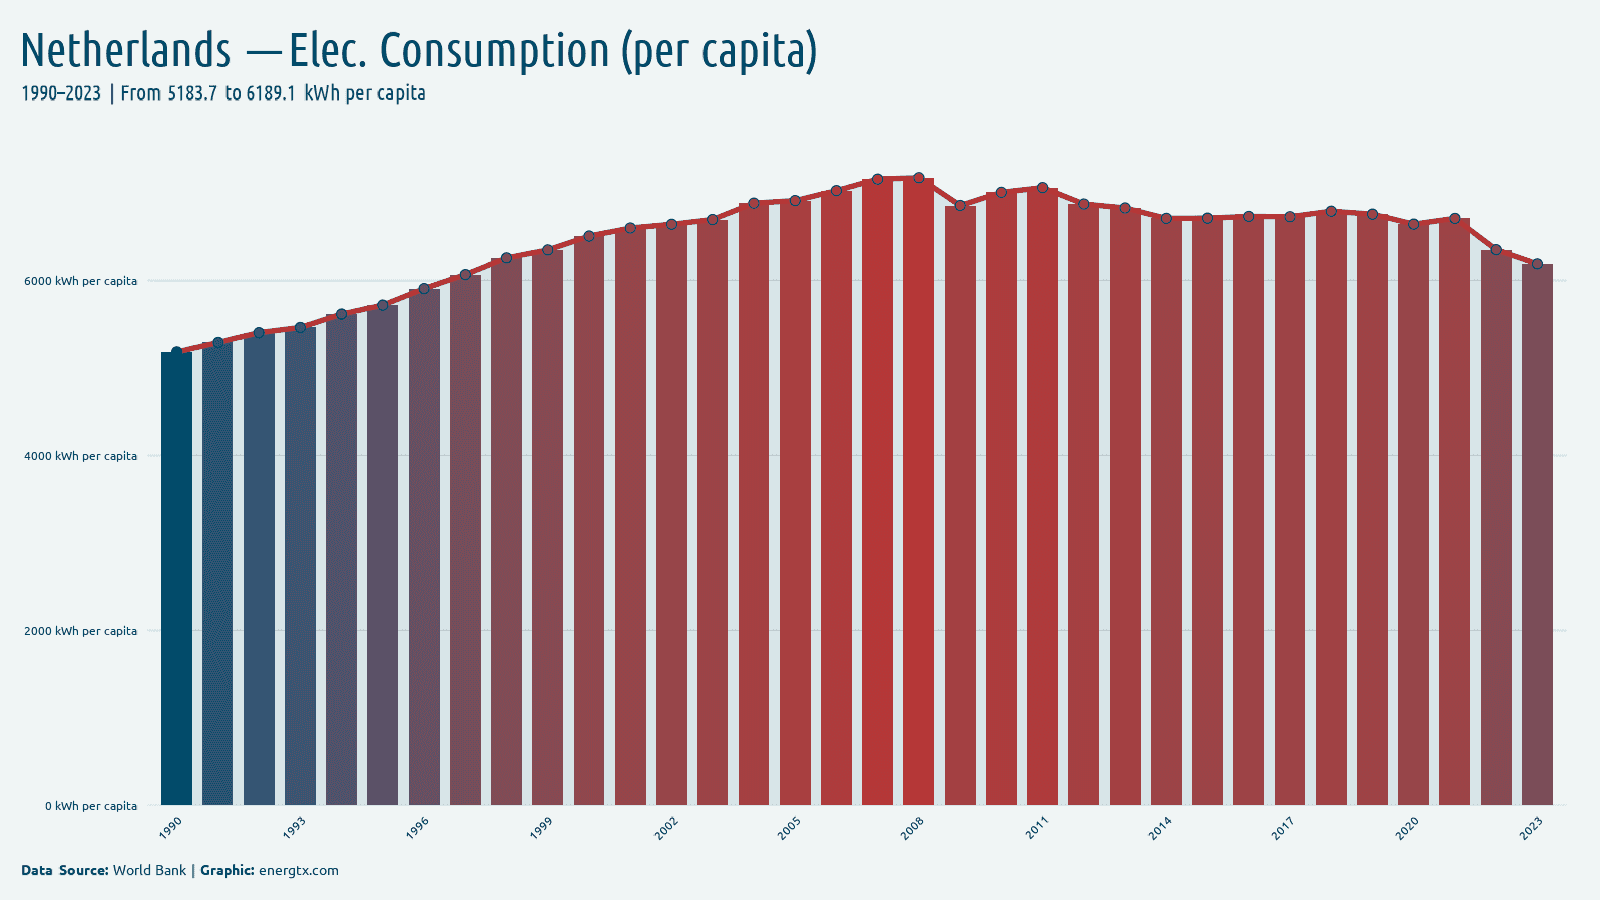
2023
Electricity Consumption (per capita)
6.2k
kWh/capita
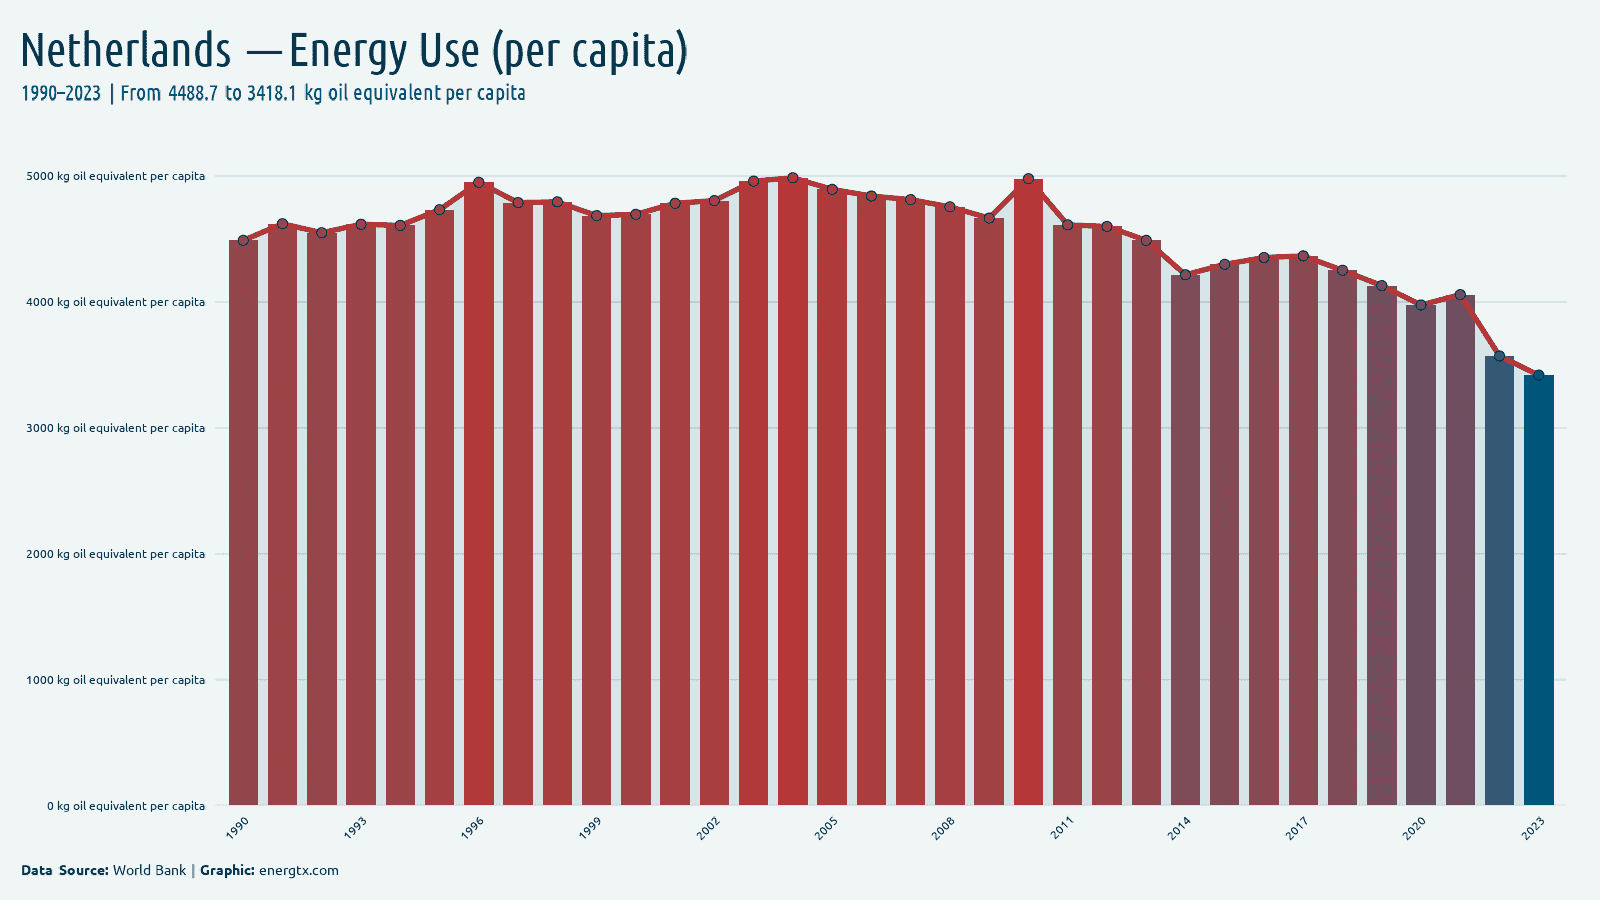
2023
Energy Use (per capita)
3.4k
kg oil eq./capita
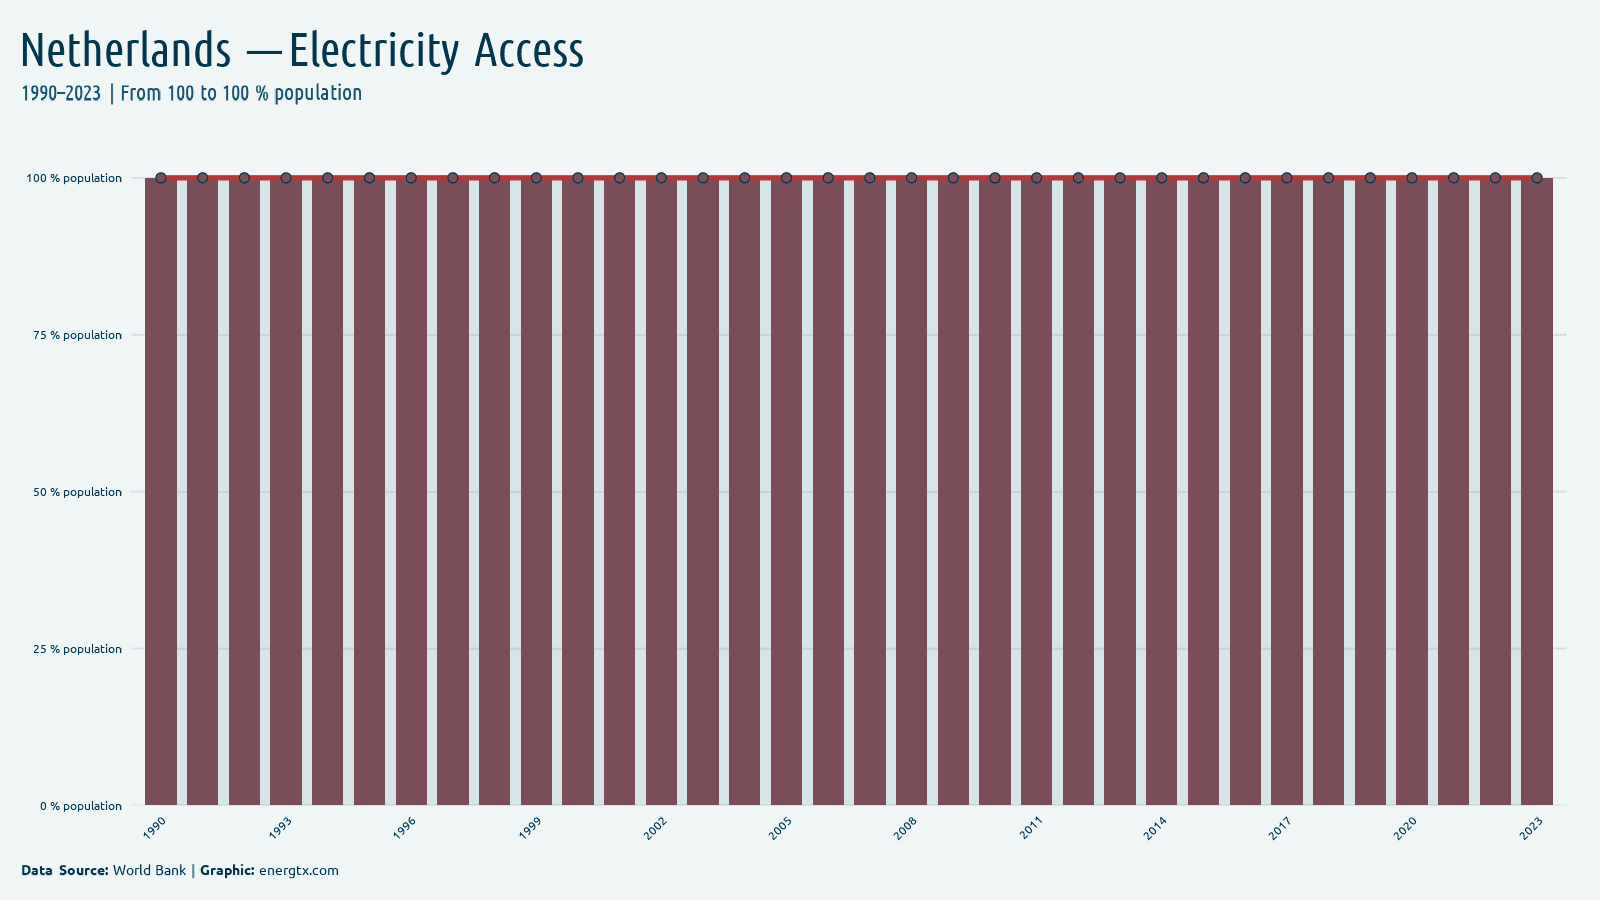
2023
Electricity Access
100.0%
%
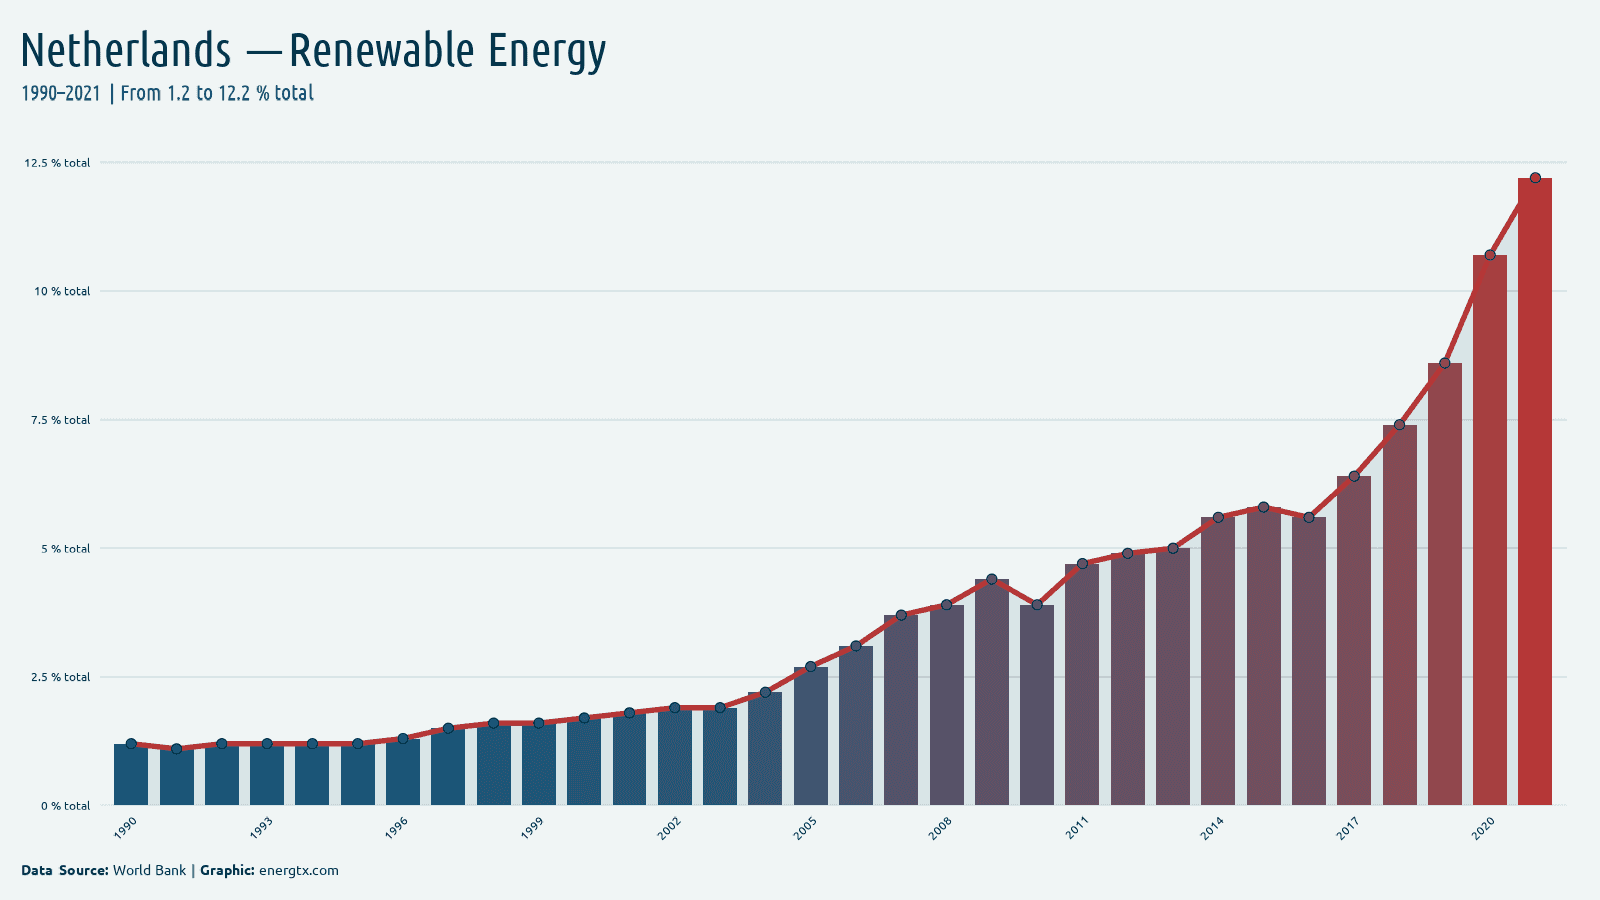
2021
Renewable Energy
12.2%
%
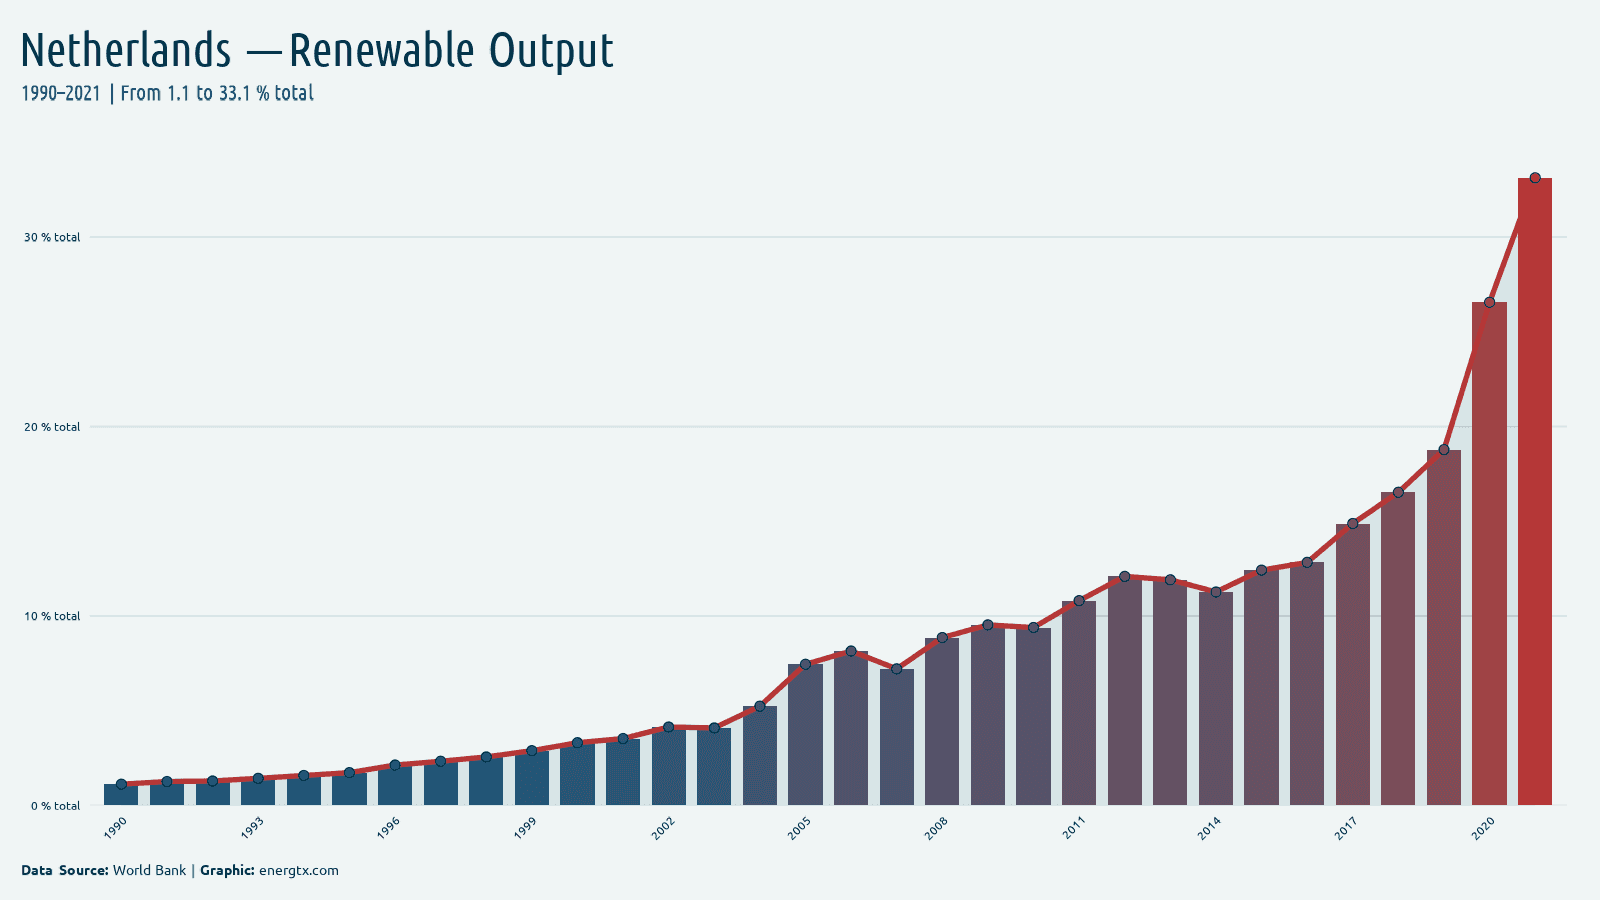
2021
Renewable Output
33.1%
%
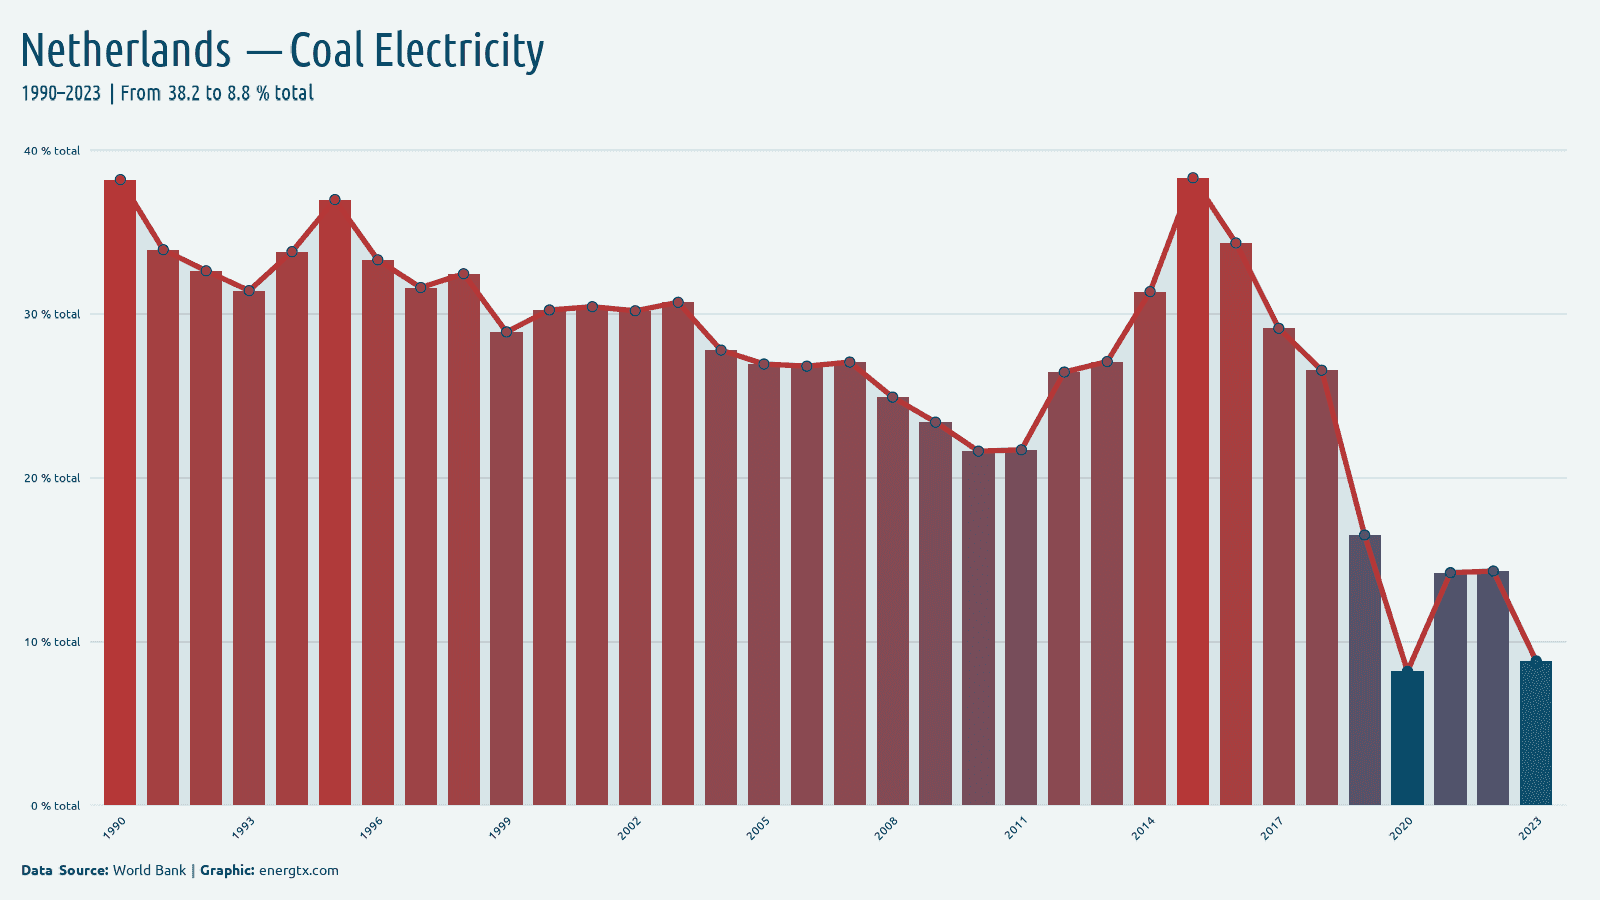
2023
Coal Electricity
8.8%
%
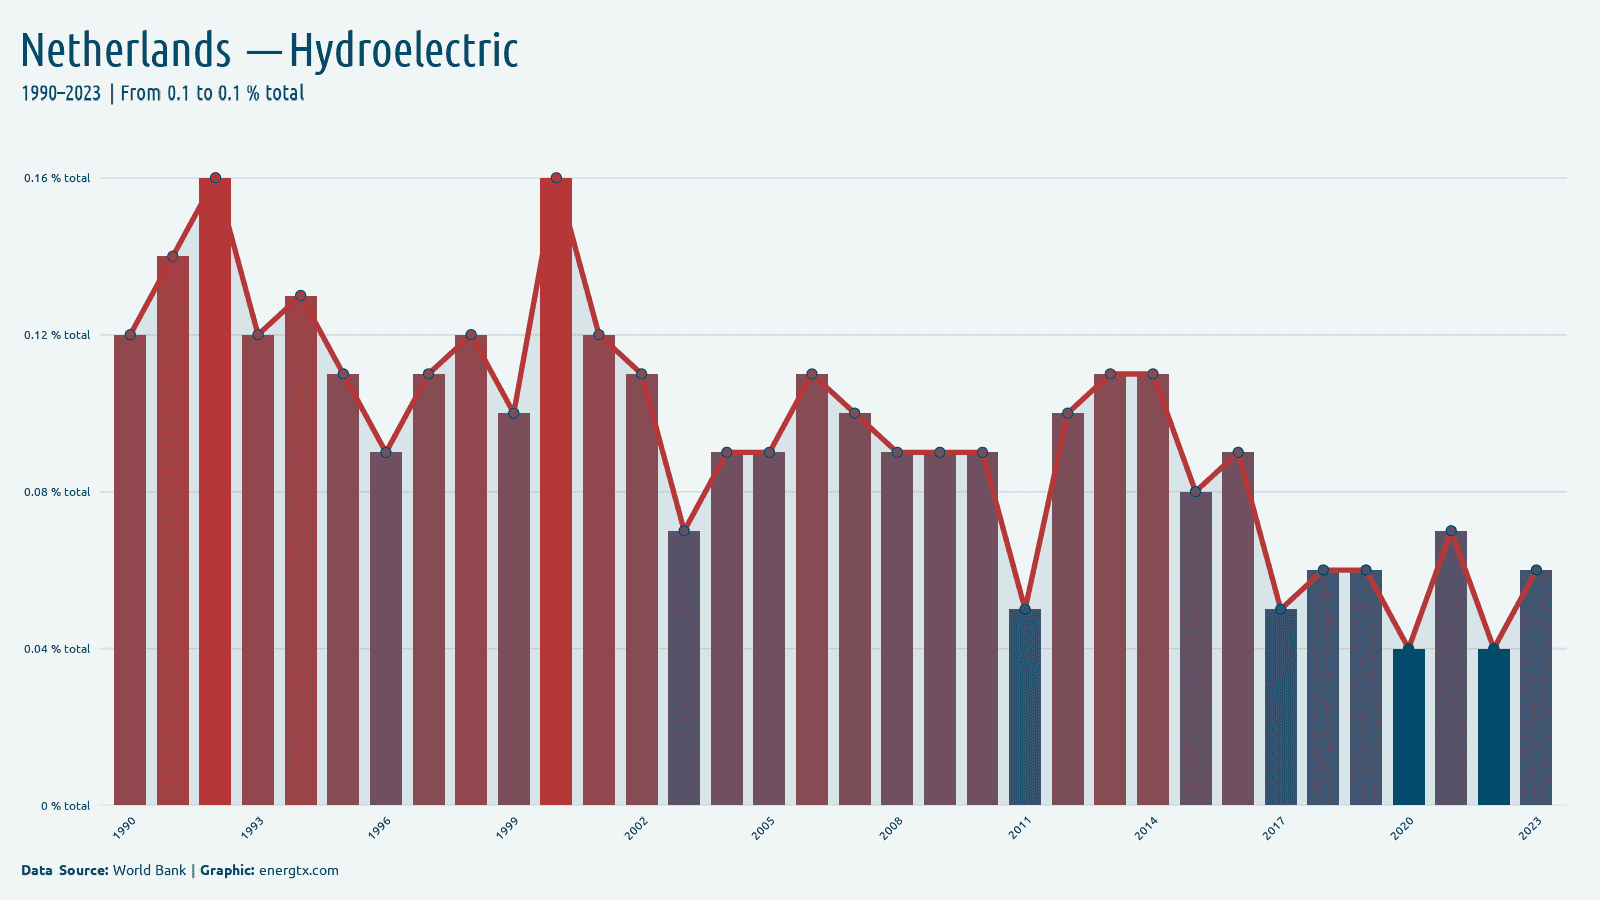
2023
Hydroelectric
0.1%
%
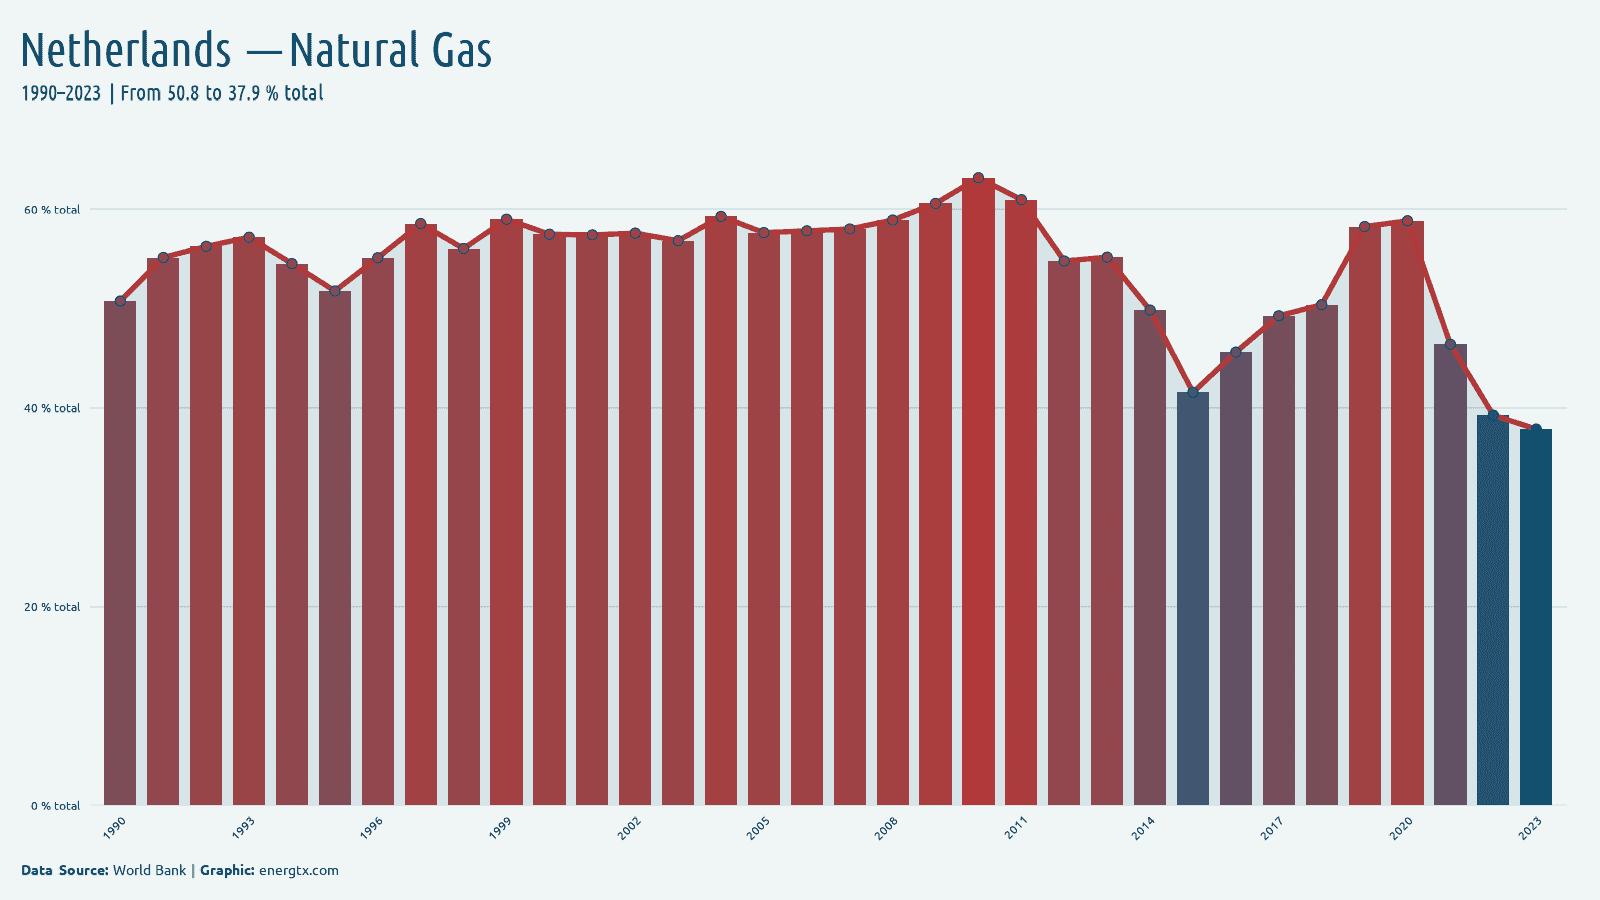
2023
Natural Gas
37.9%
%
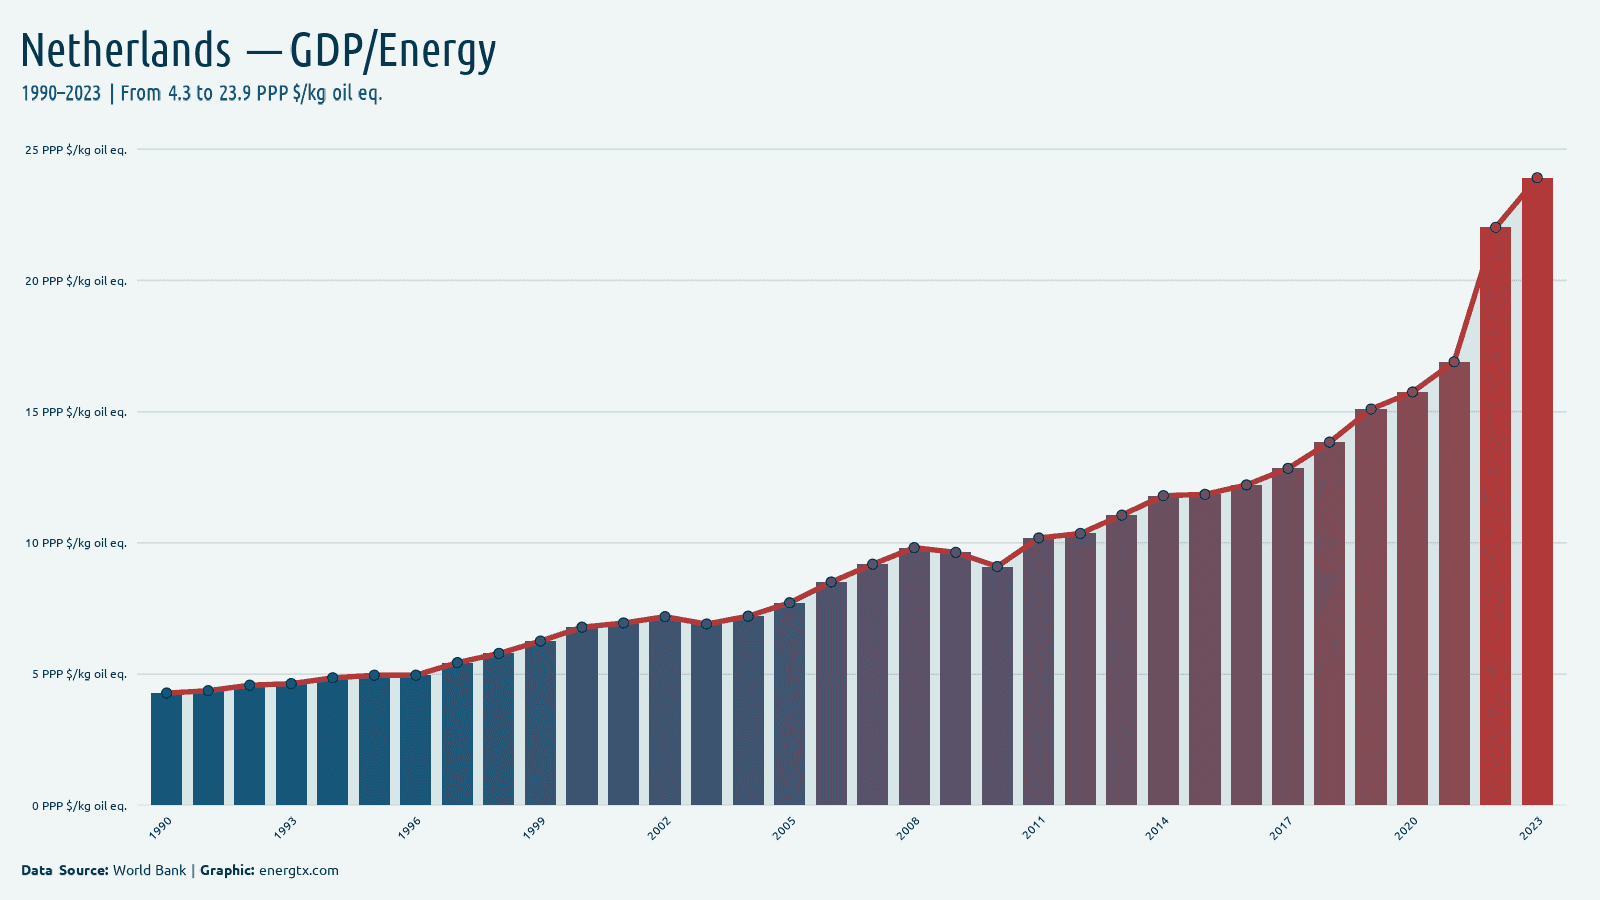
2023
GDP/Energy
23.9
PPP $/kg oil eq.
2023
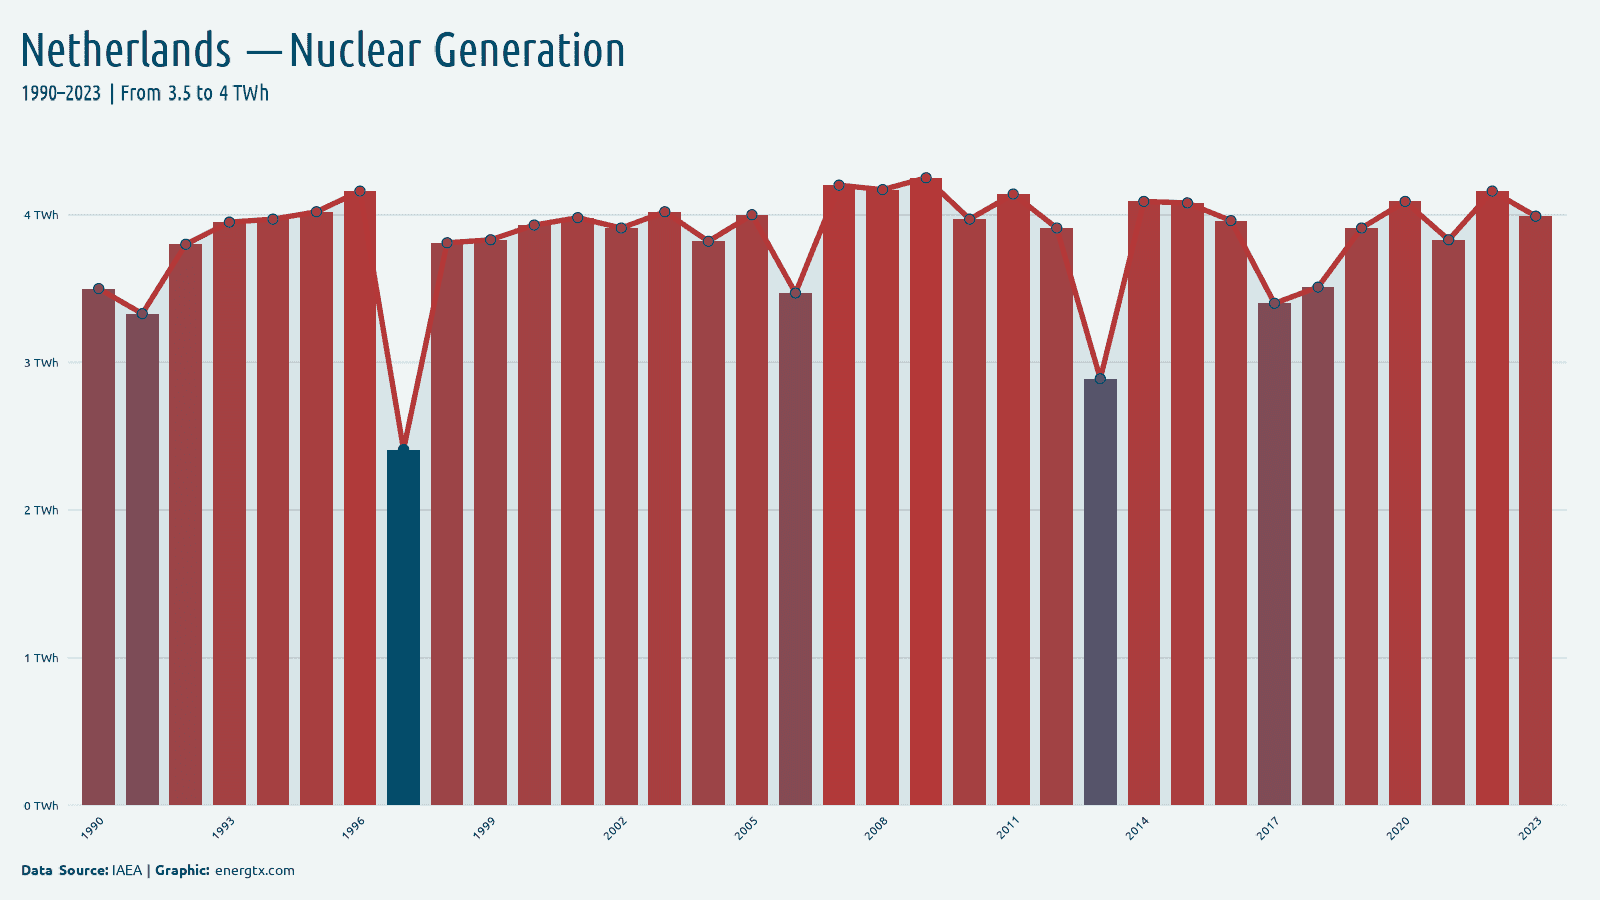
Nuclear Generation
4.0
TWh
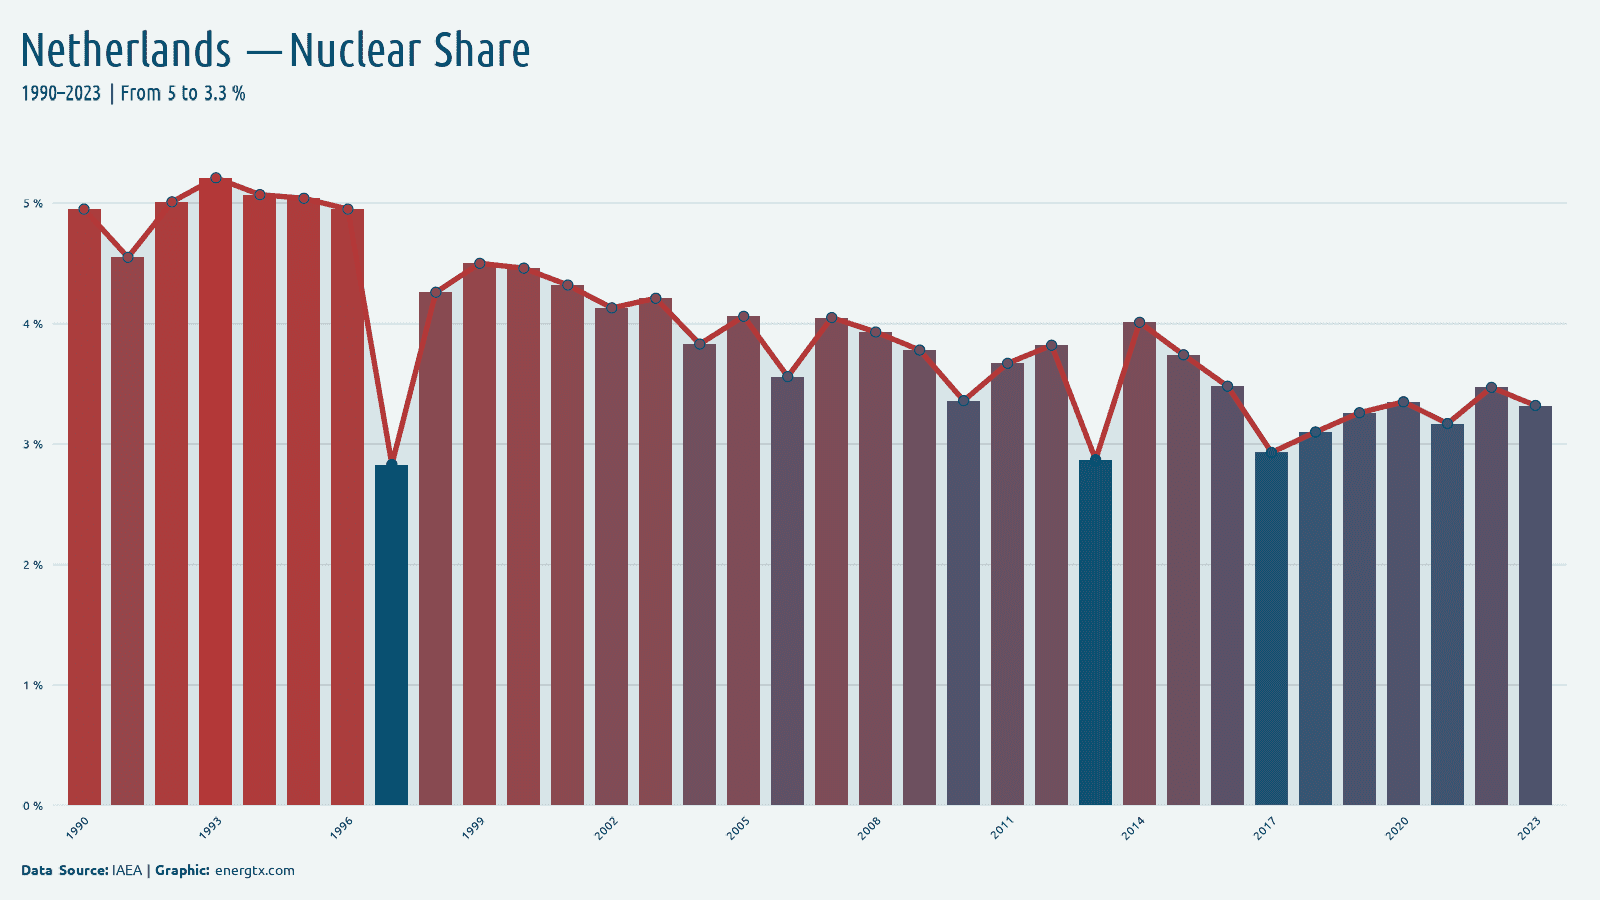
2023
Nuclear Share
3.3%
%
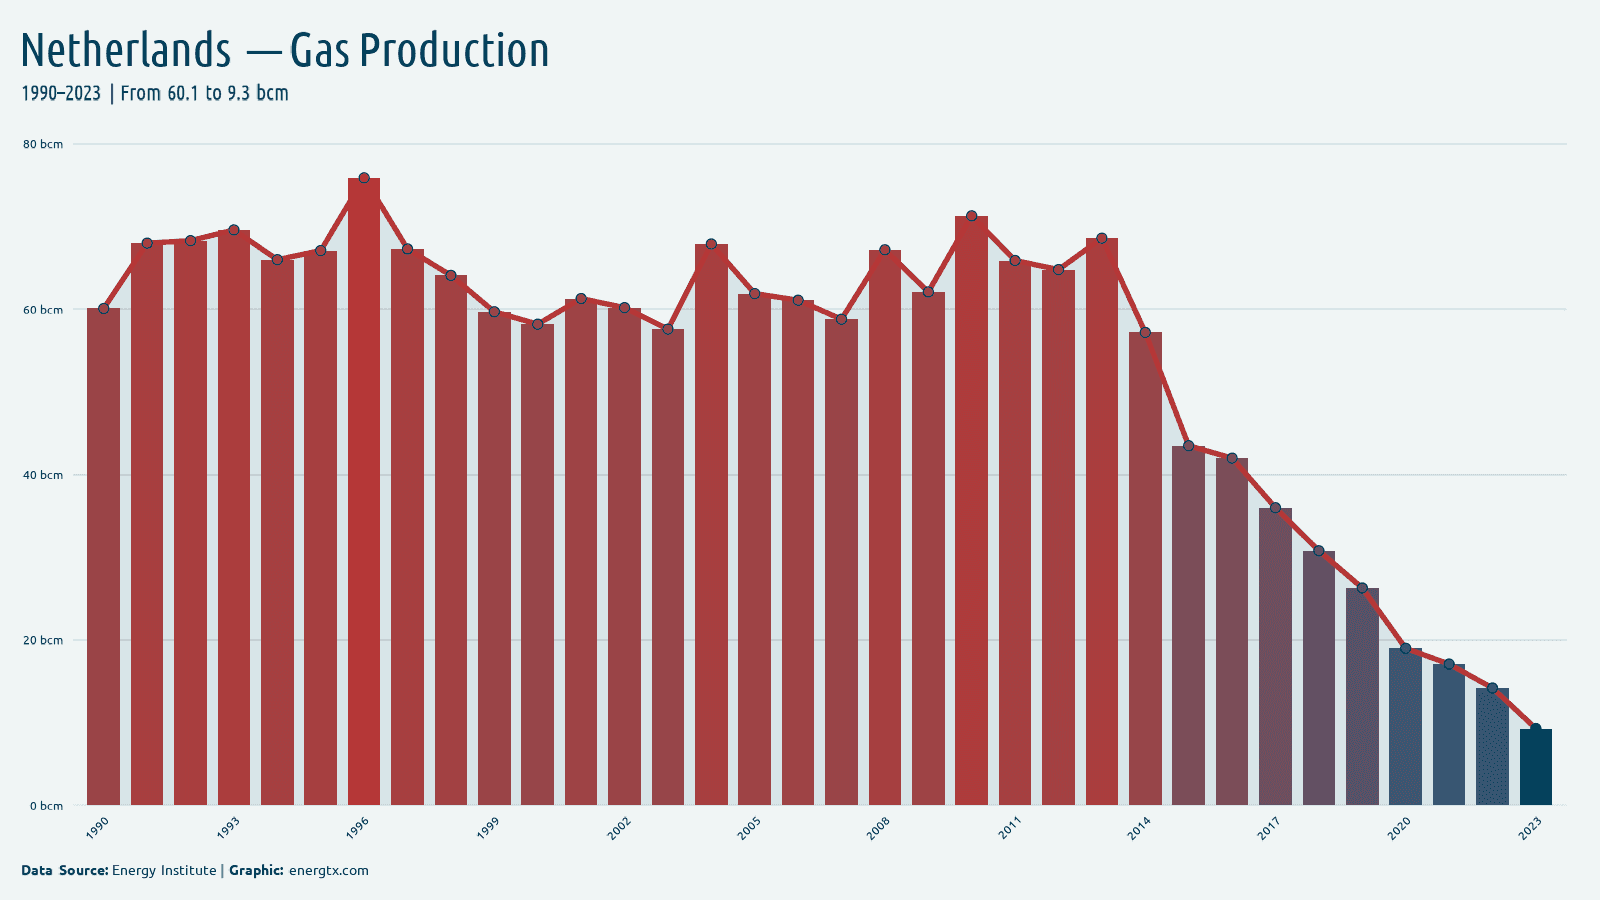
2023
Gas Production
9.3
bcm
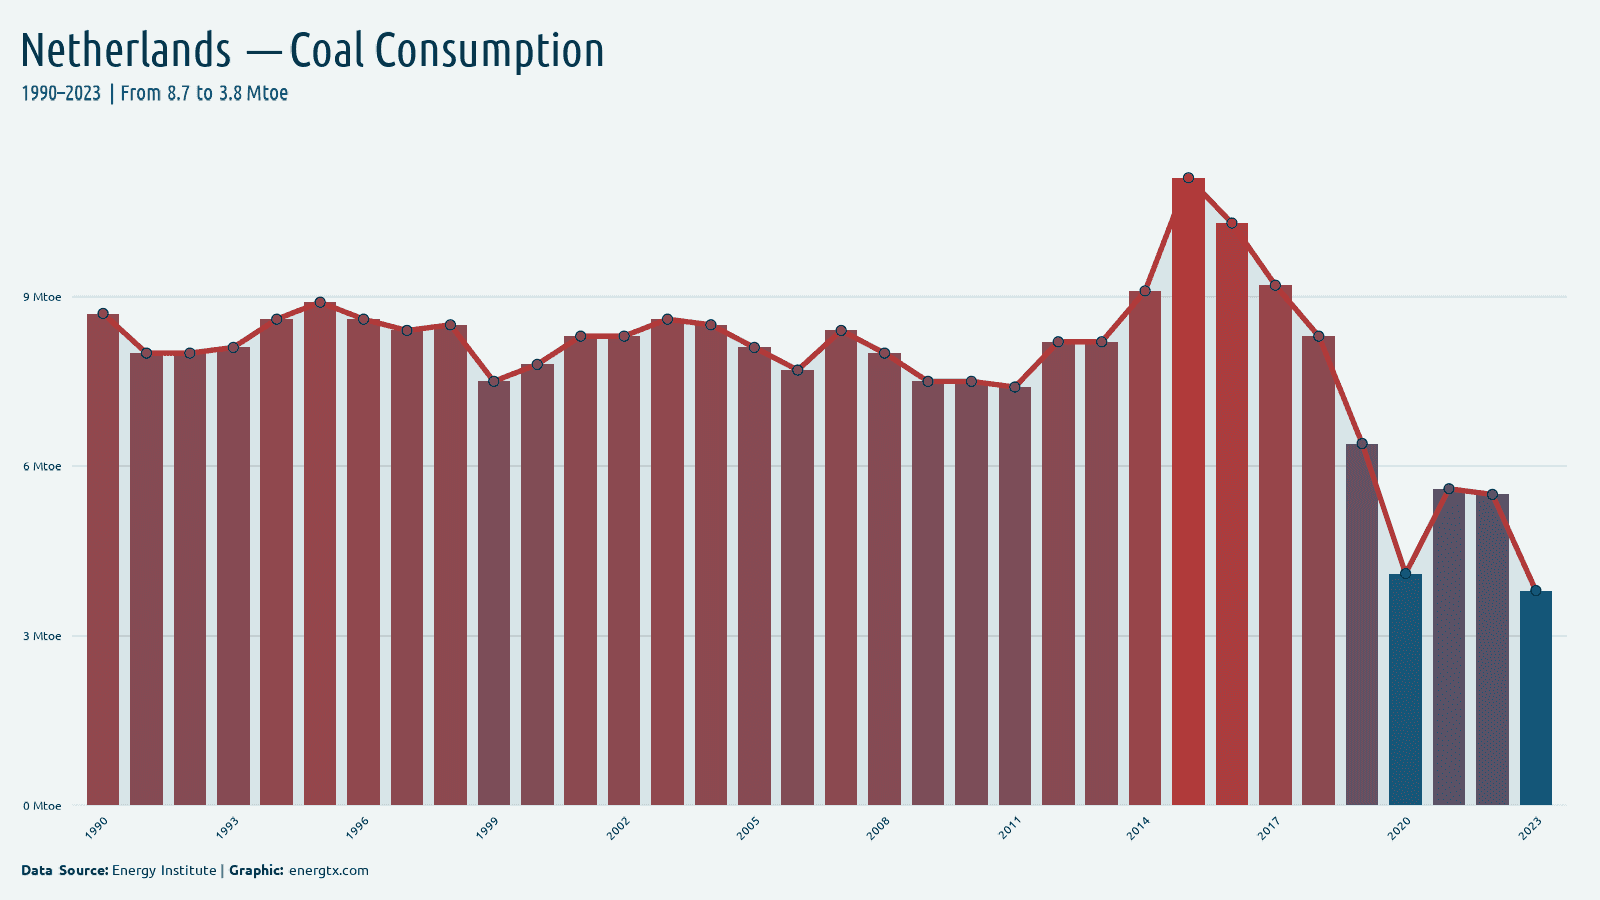
2023
Coal Consumption
3.8
Mtoe
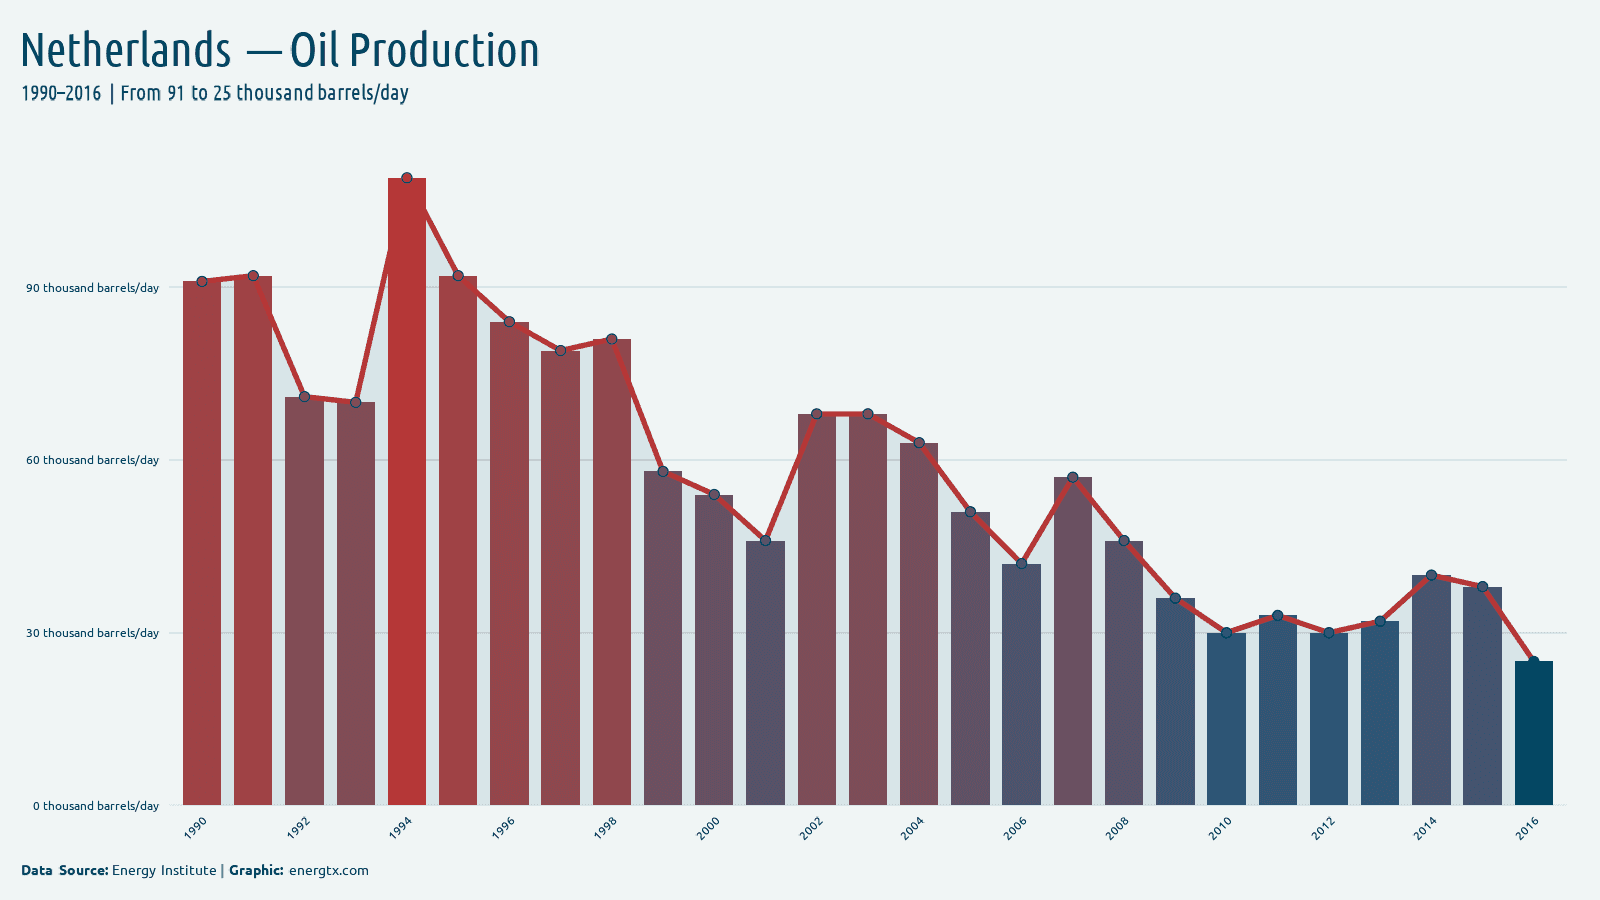
2016
Oil Production
25.0
k barrels/day
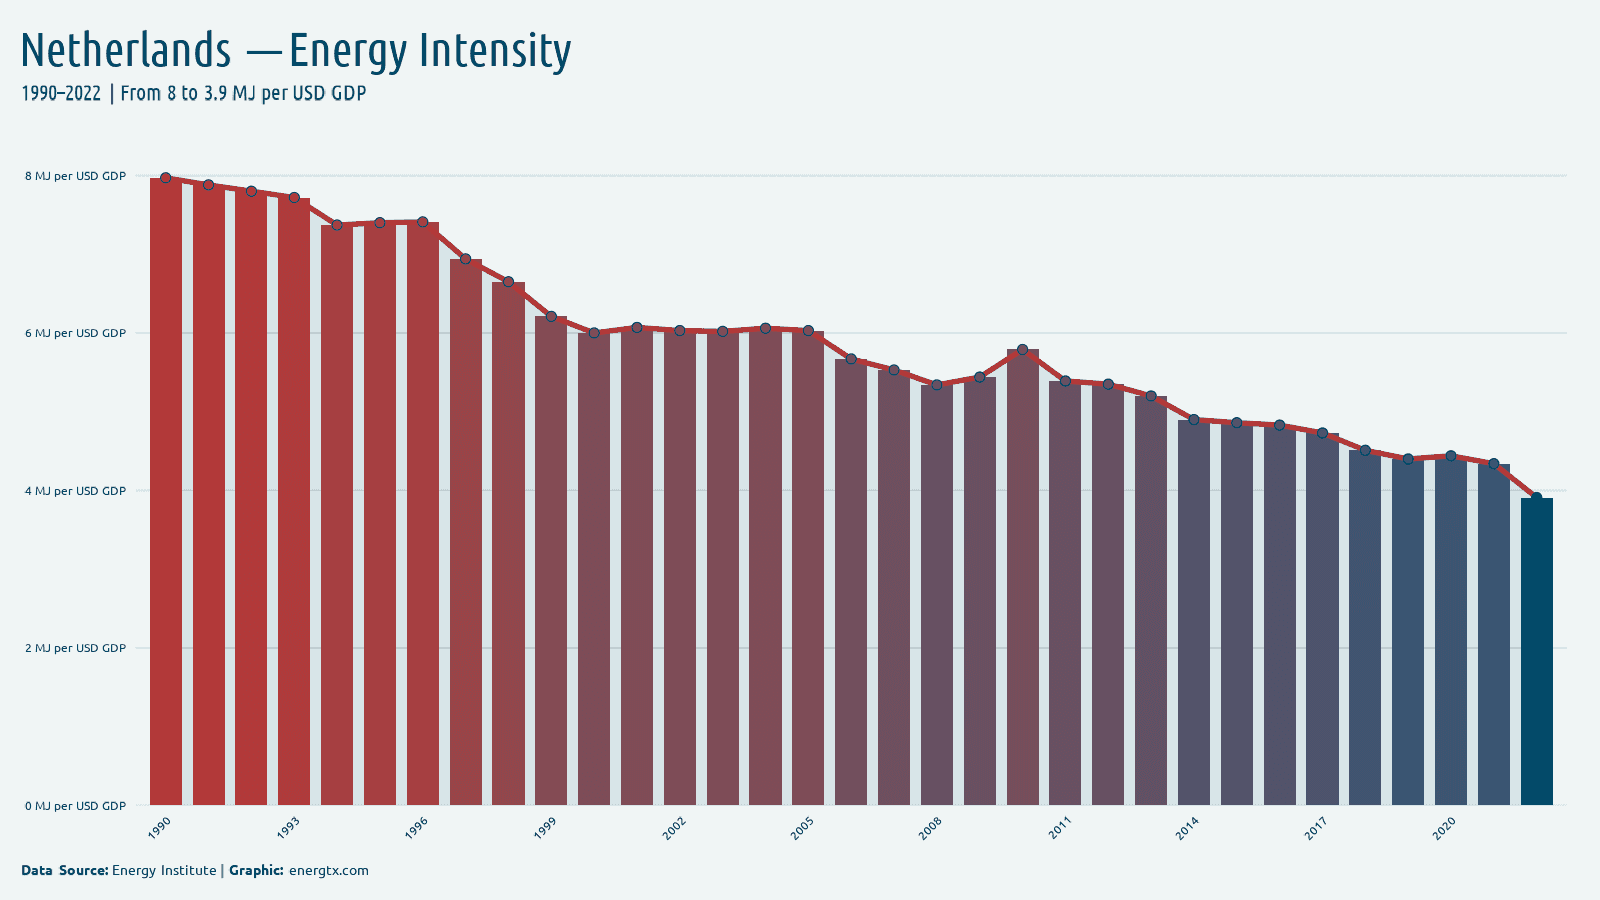
2022
Energy Intensity
3.9
MJ/$ GDP
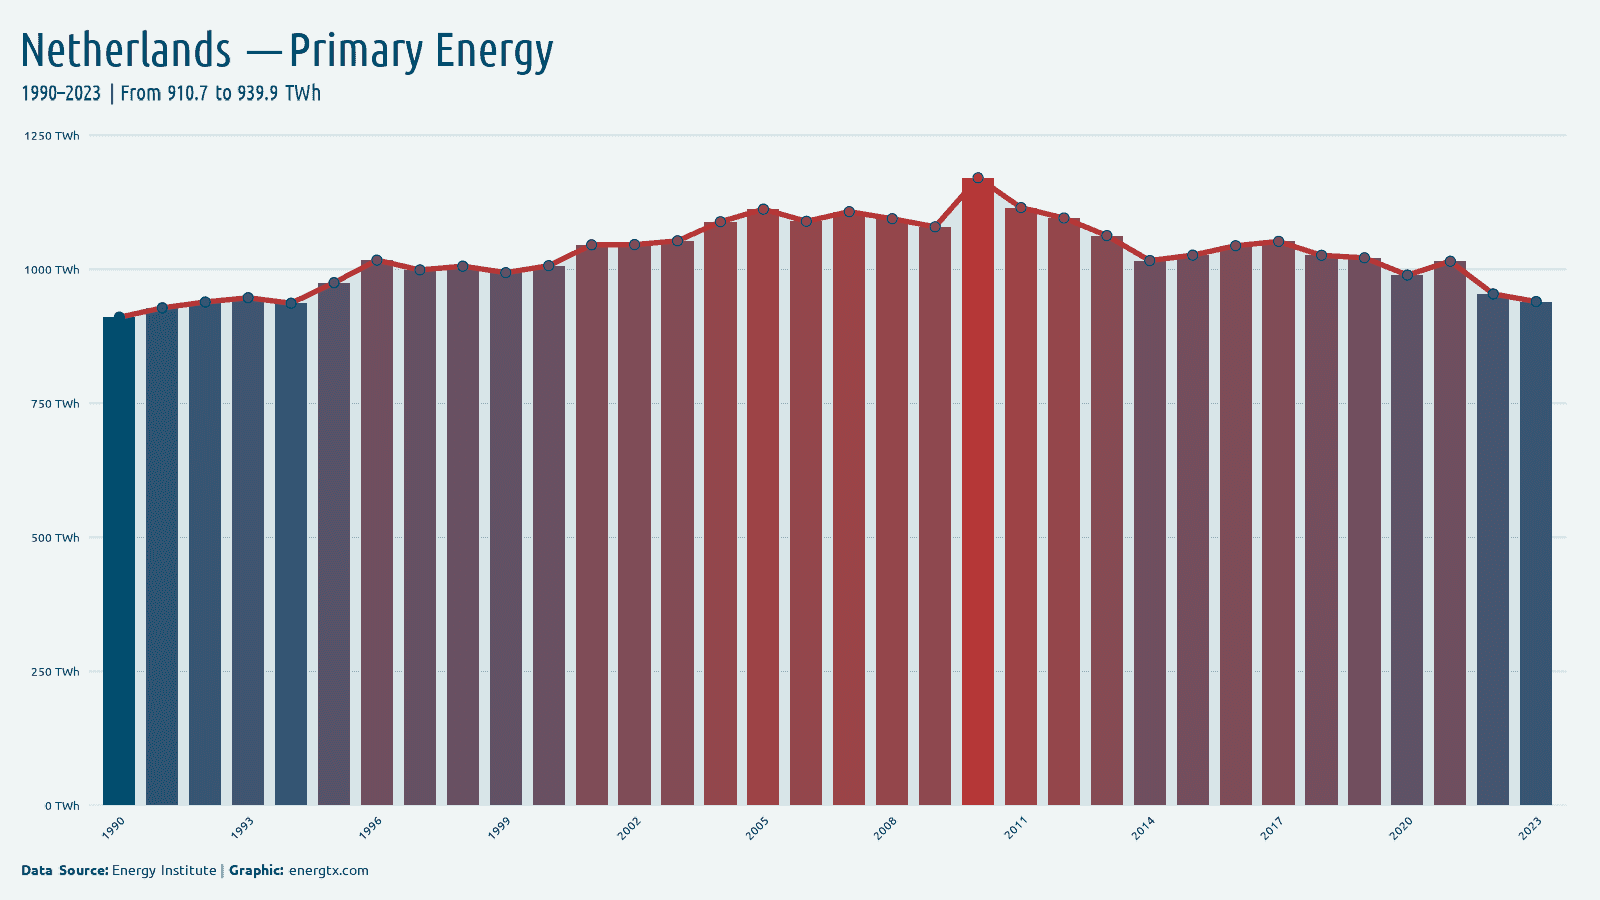
2023
Primary Energy
939.9
TWh
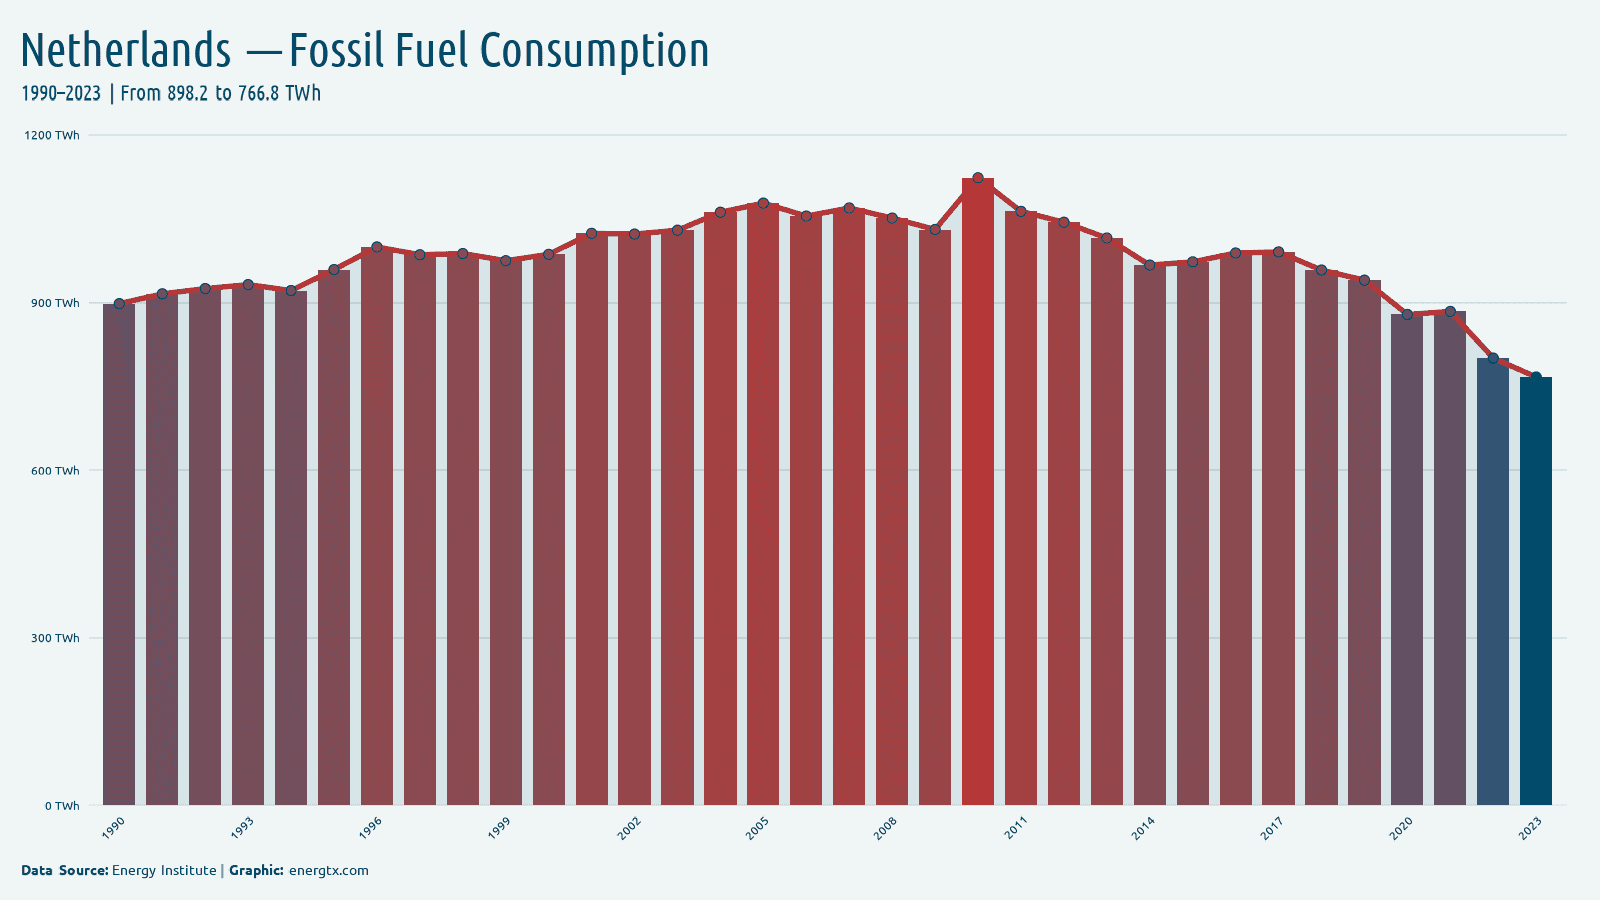
2023
Fossil Fuel Consumption
766.8
TWh
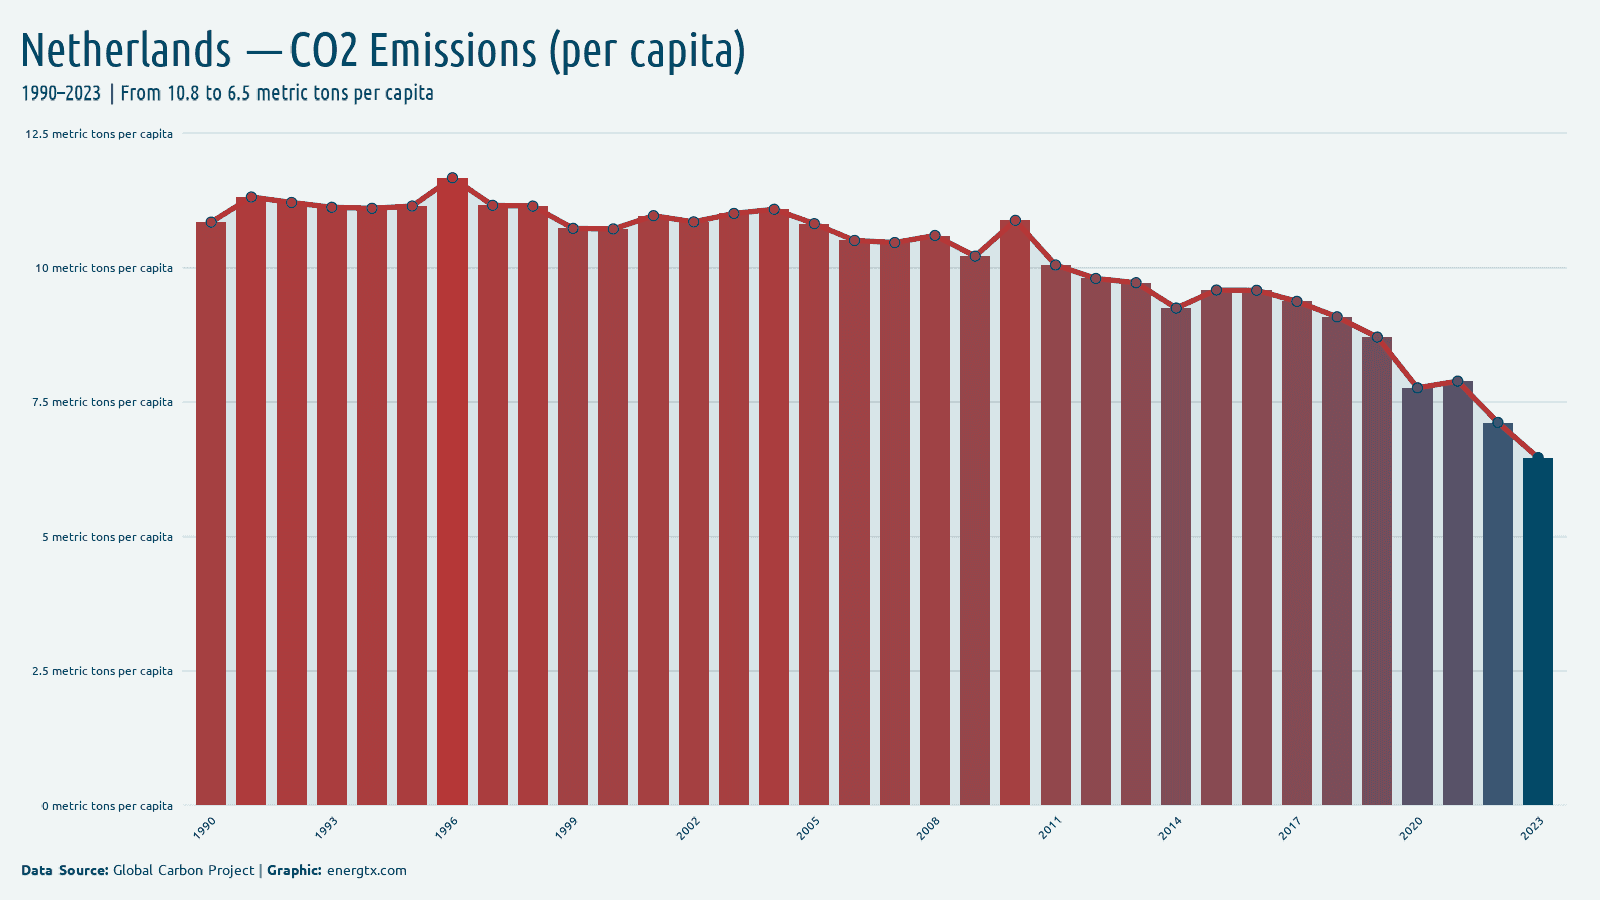
2023
CO2 Emissions (per capita)
6.5
metric tons/capita
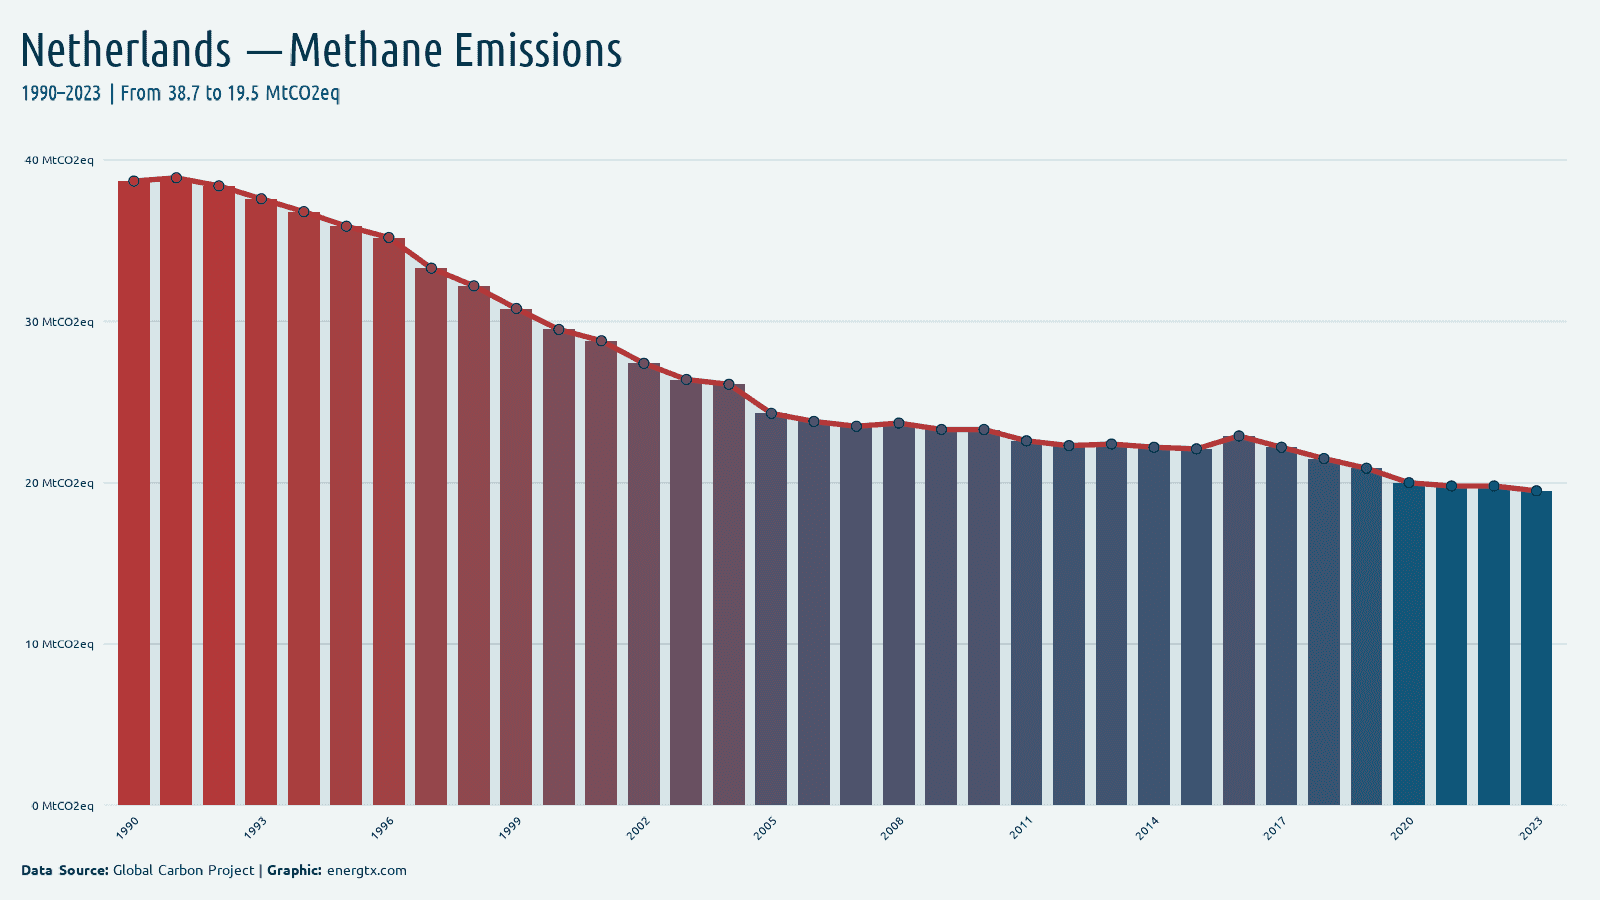
2023
Methane Emissions
19.5
MtCO2eq
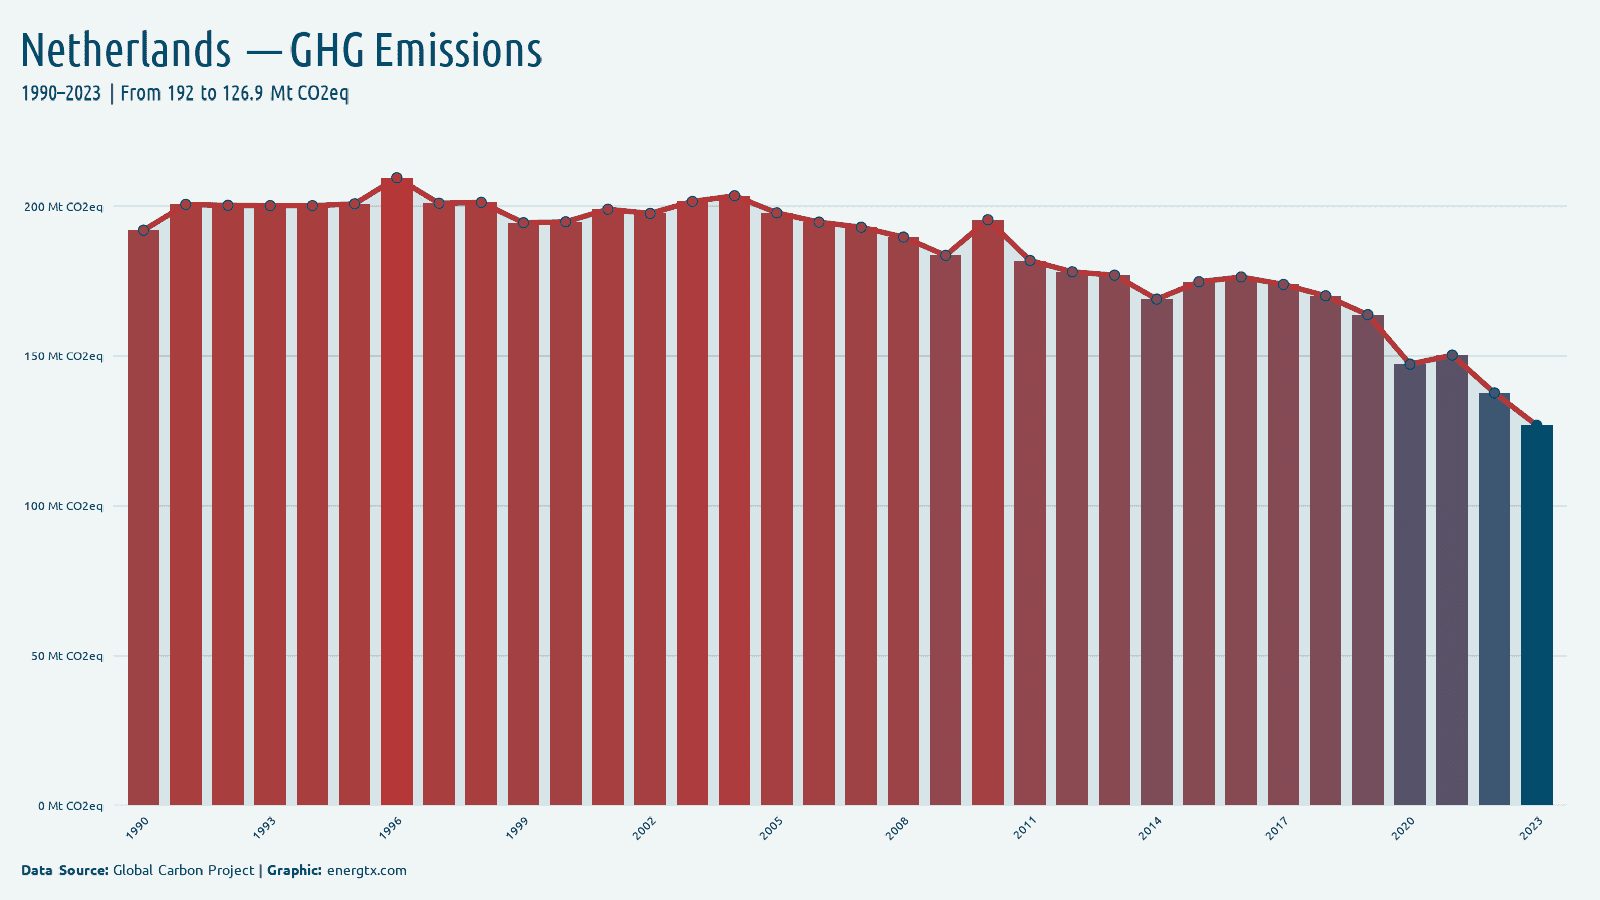
2023
GHG Emissions
126.9
MtCO2eq
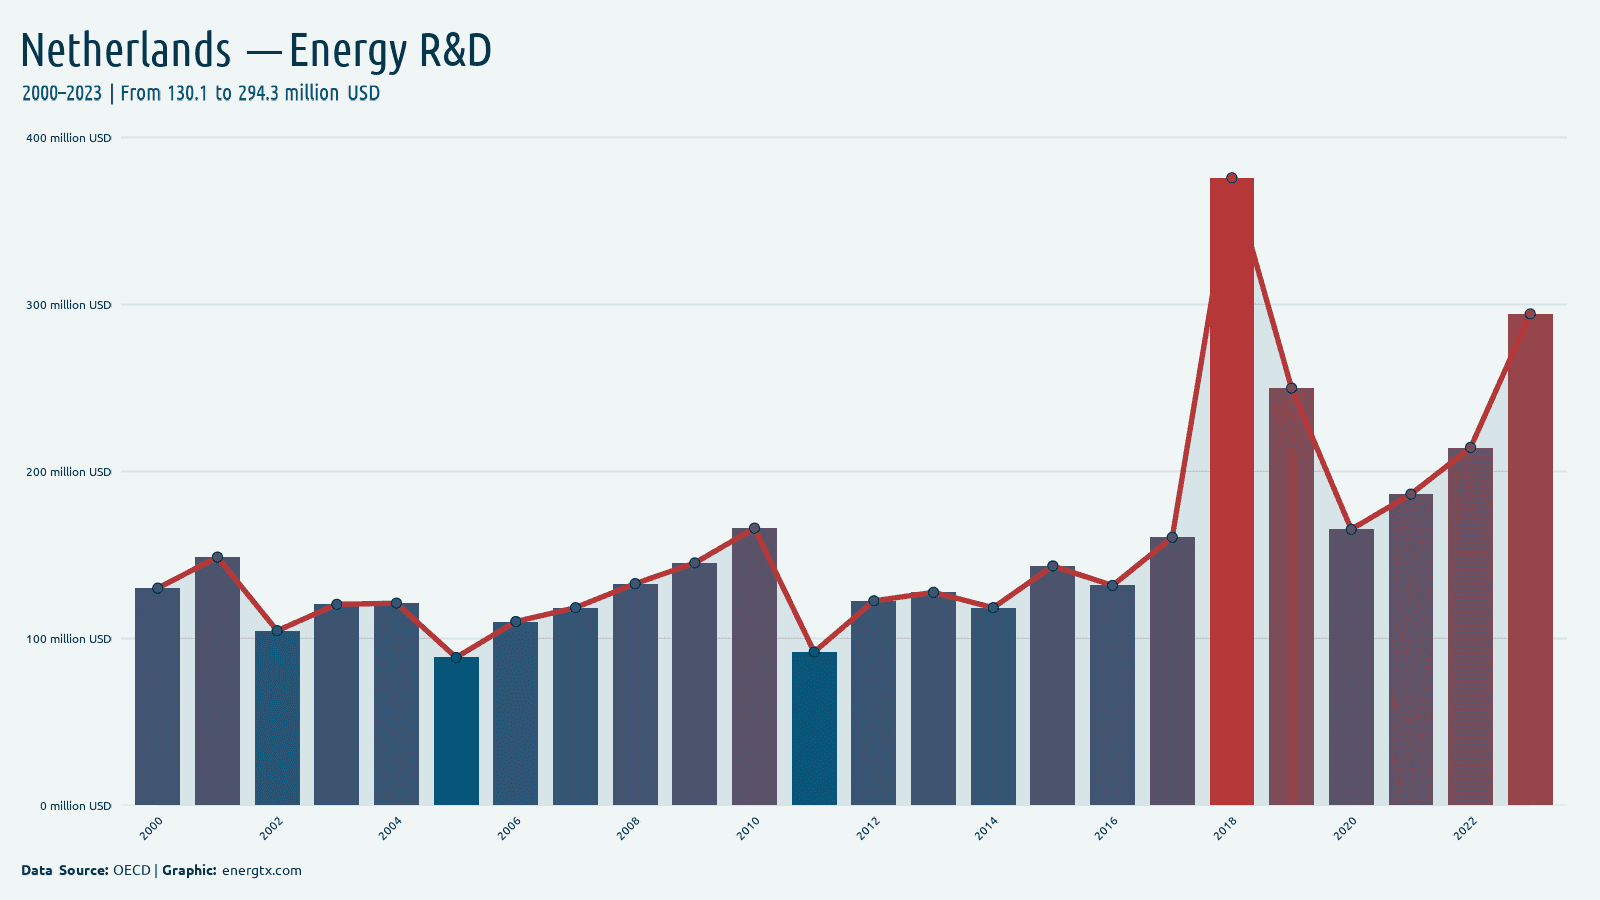
2023
Energy R&D
294.3
million $
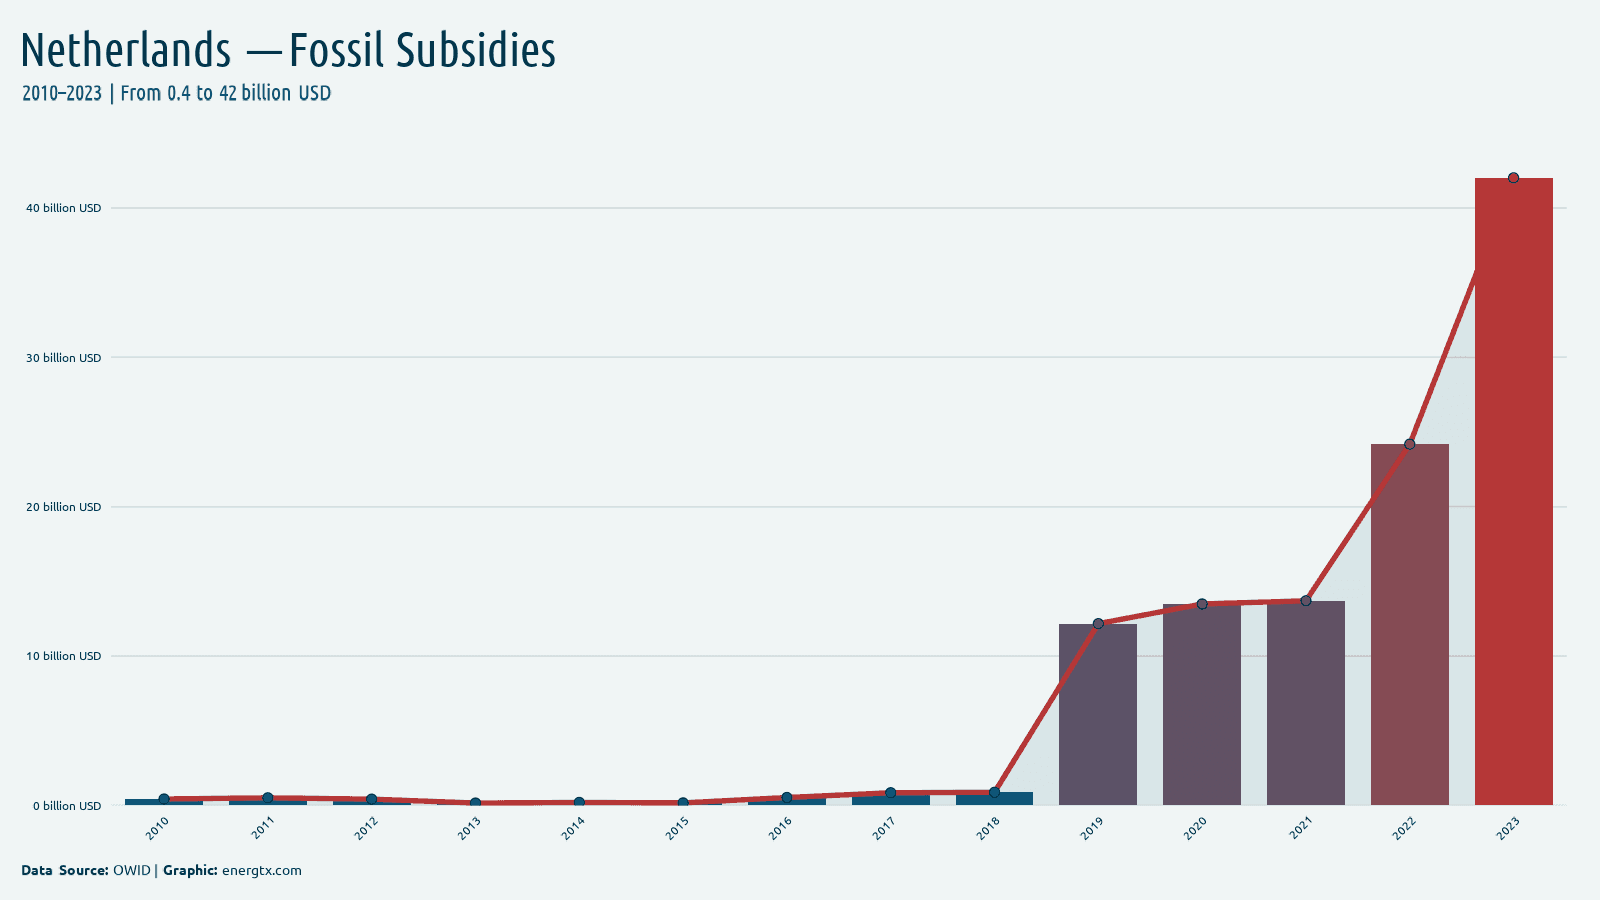
2023
Fossil Subsidies
42.0
billion $
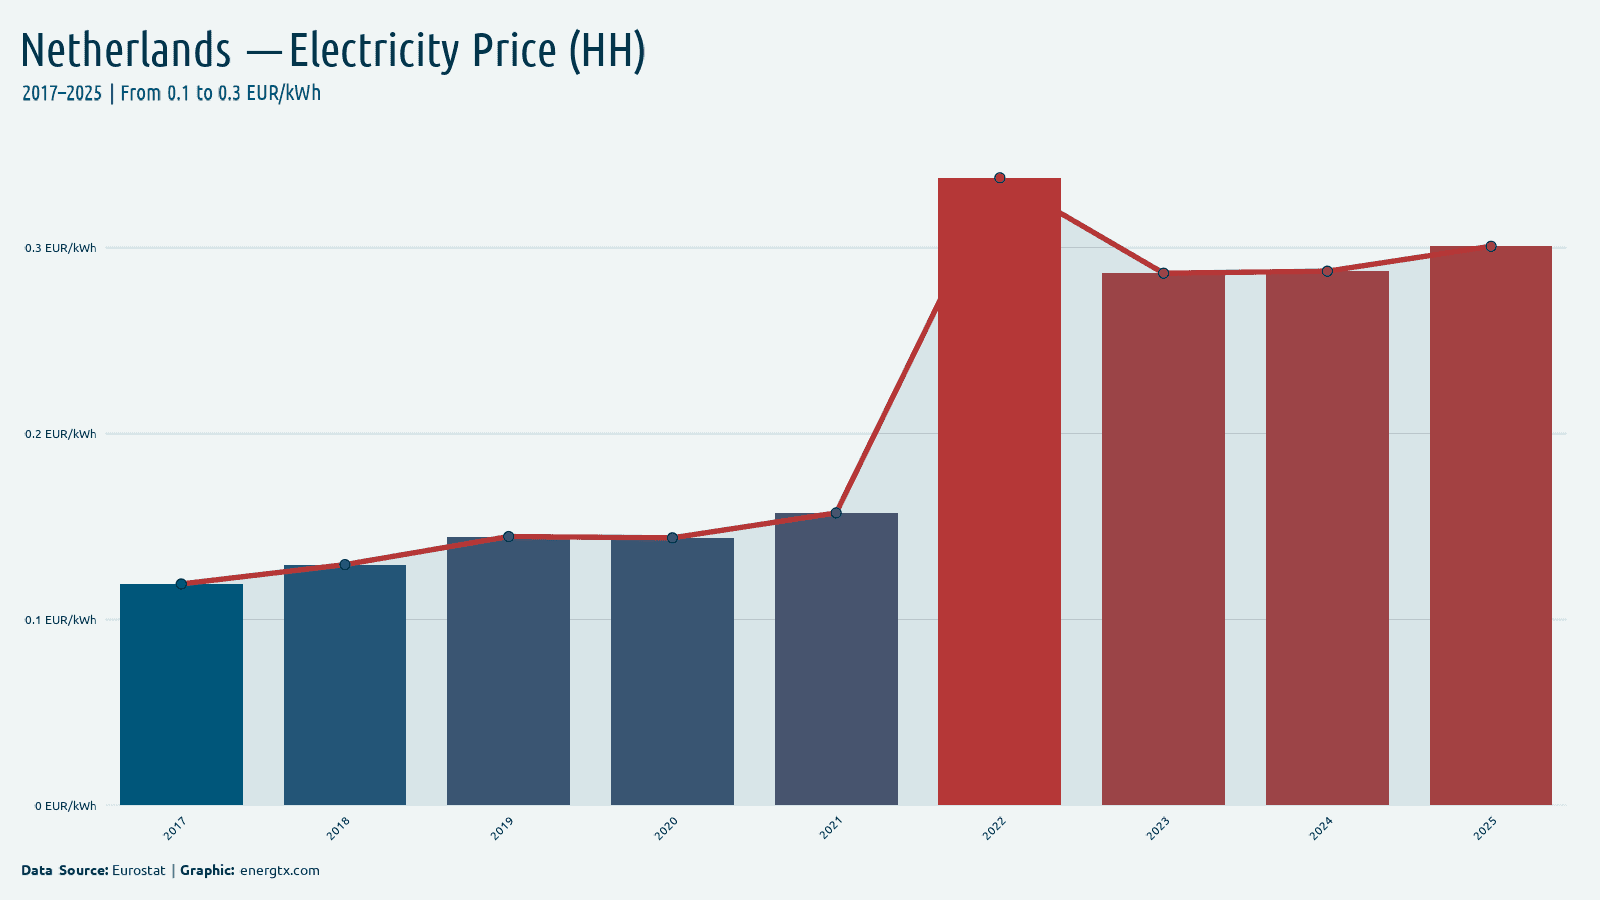
2025
Electricity Price (HH)
0.3
EUR/kWh
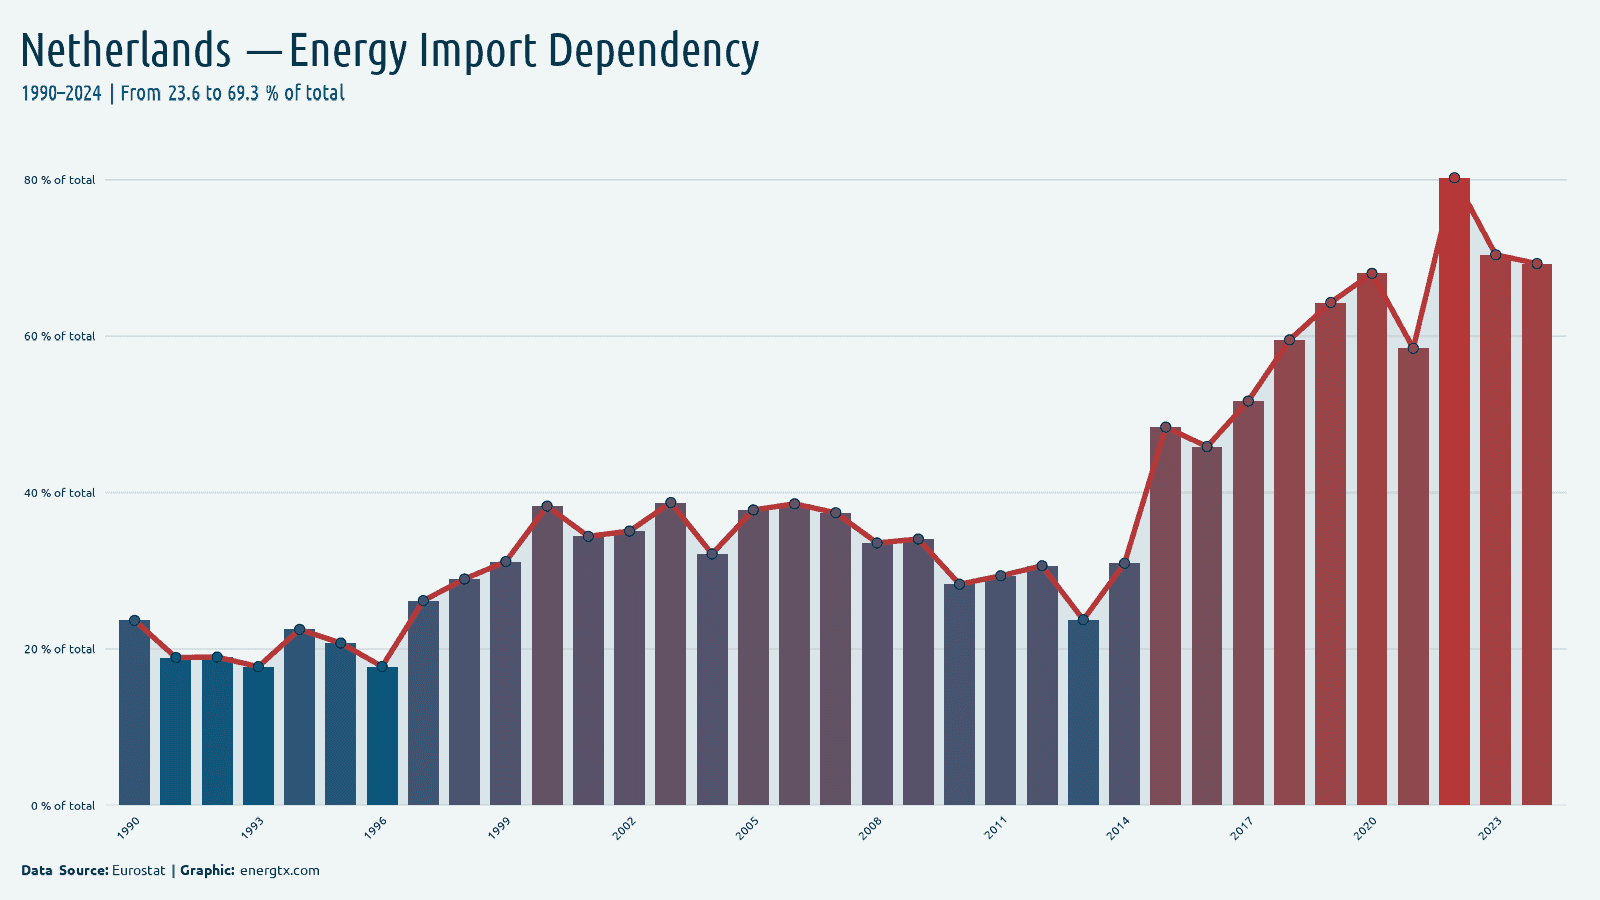
2024
Energy Import Dependency
69.3%
%
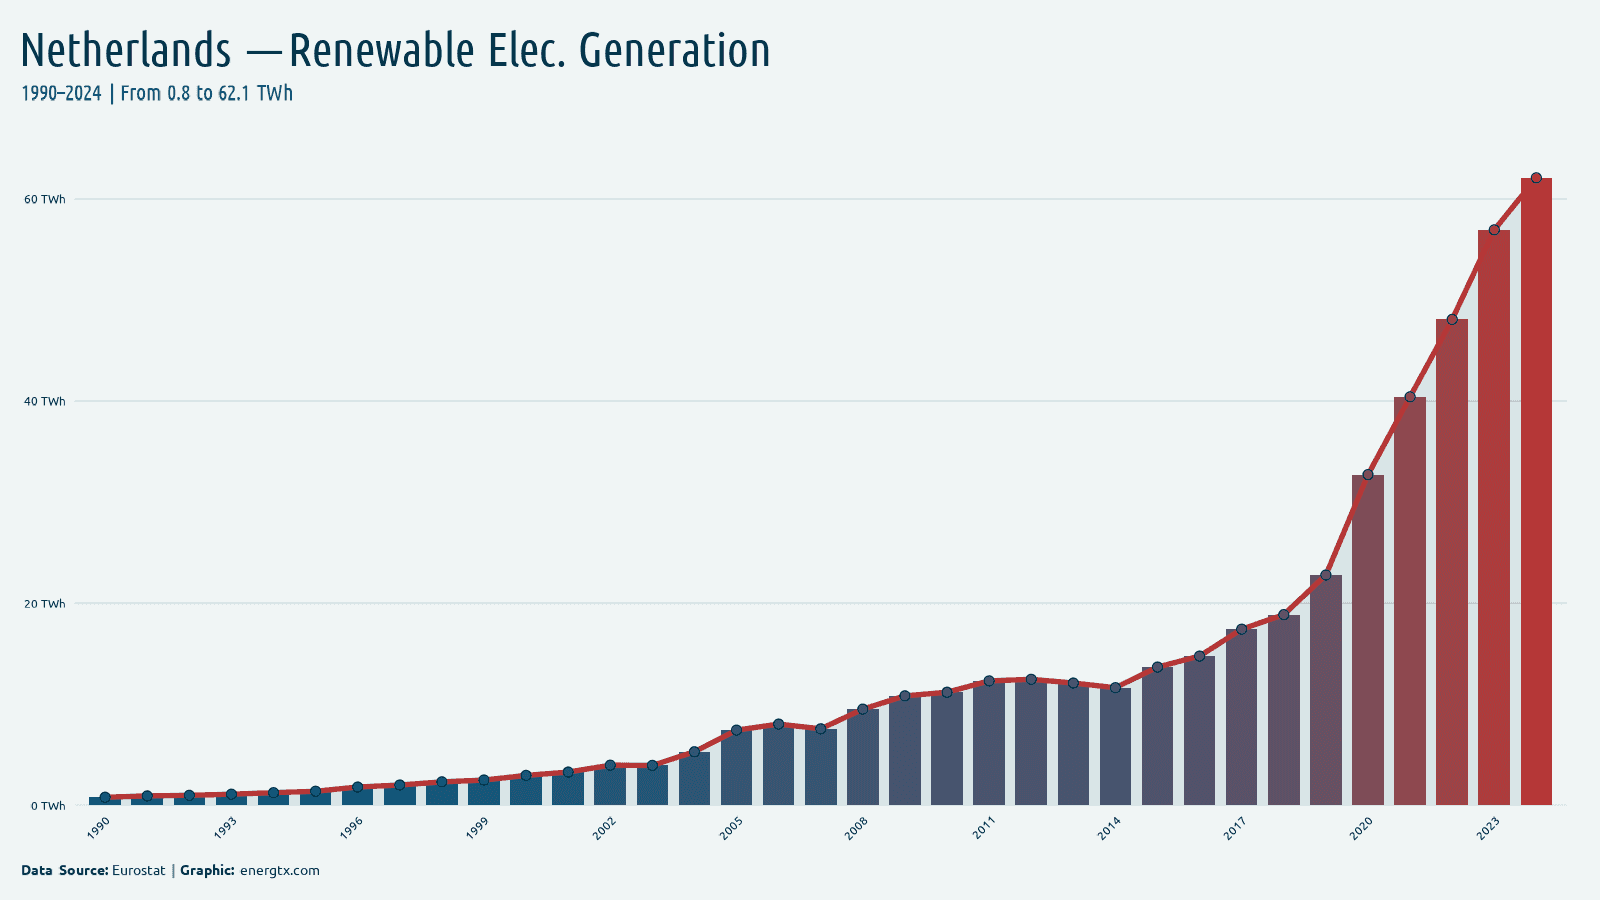
2024
Renewable Elec. Generation
62.1
TWh
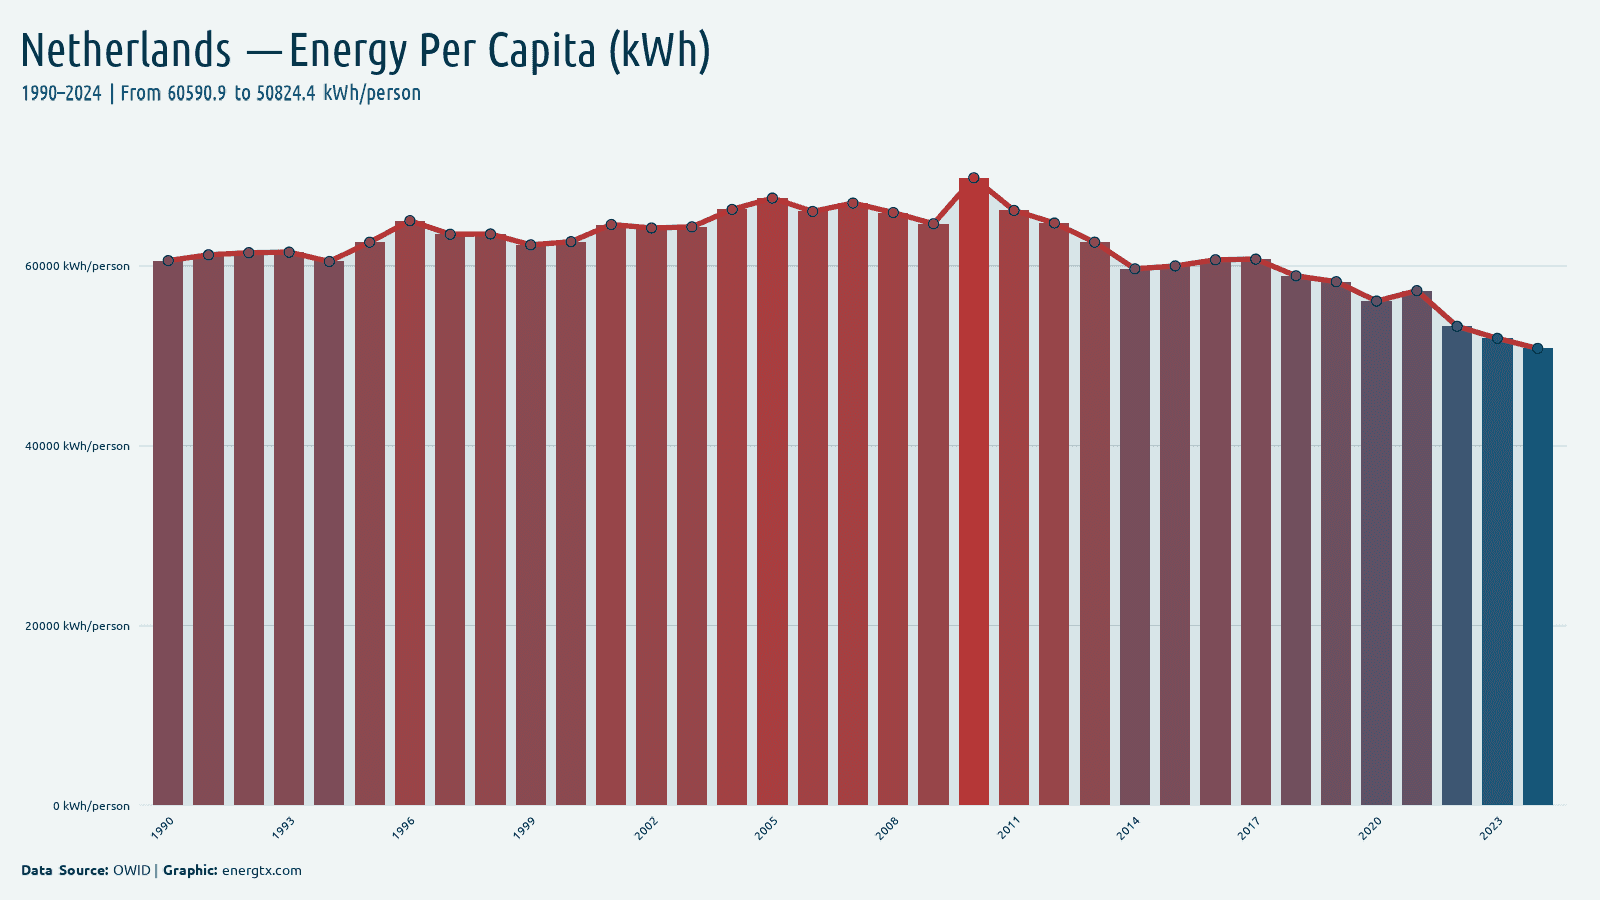
2024
Energy Use Per Capita (kWh)
50.8k
kWh/capita
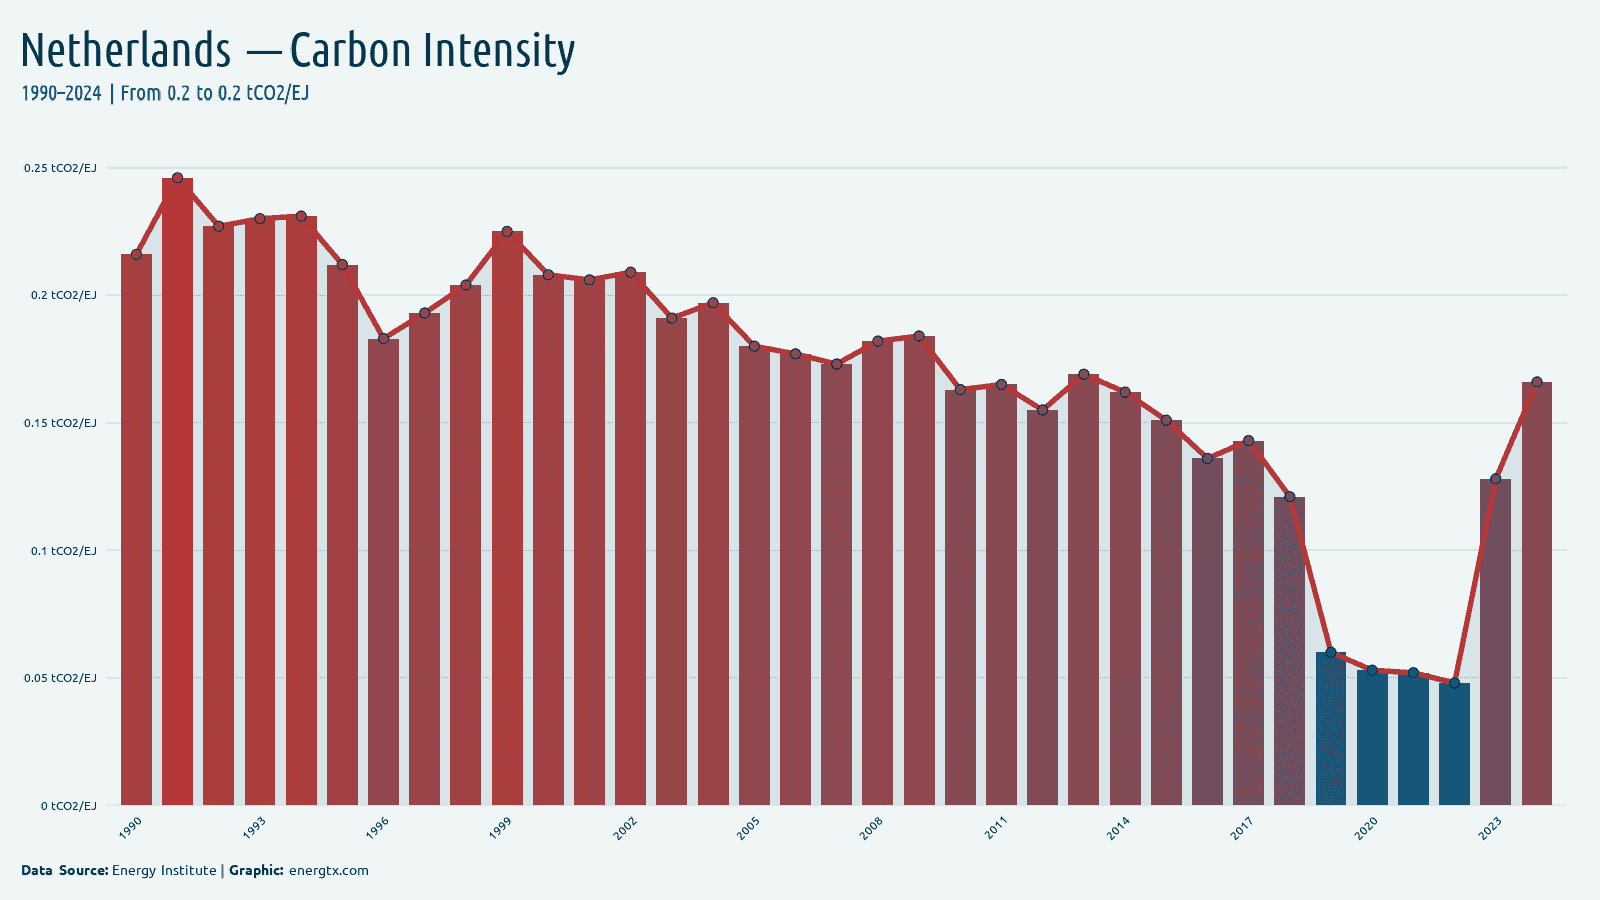
2024
Carbon Intensity
0.2
tCO2/EJ
2024
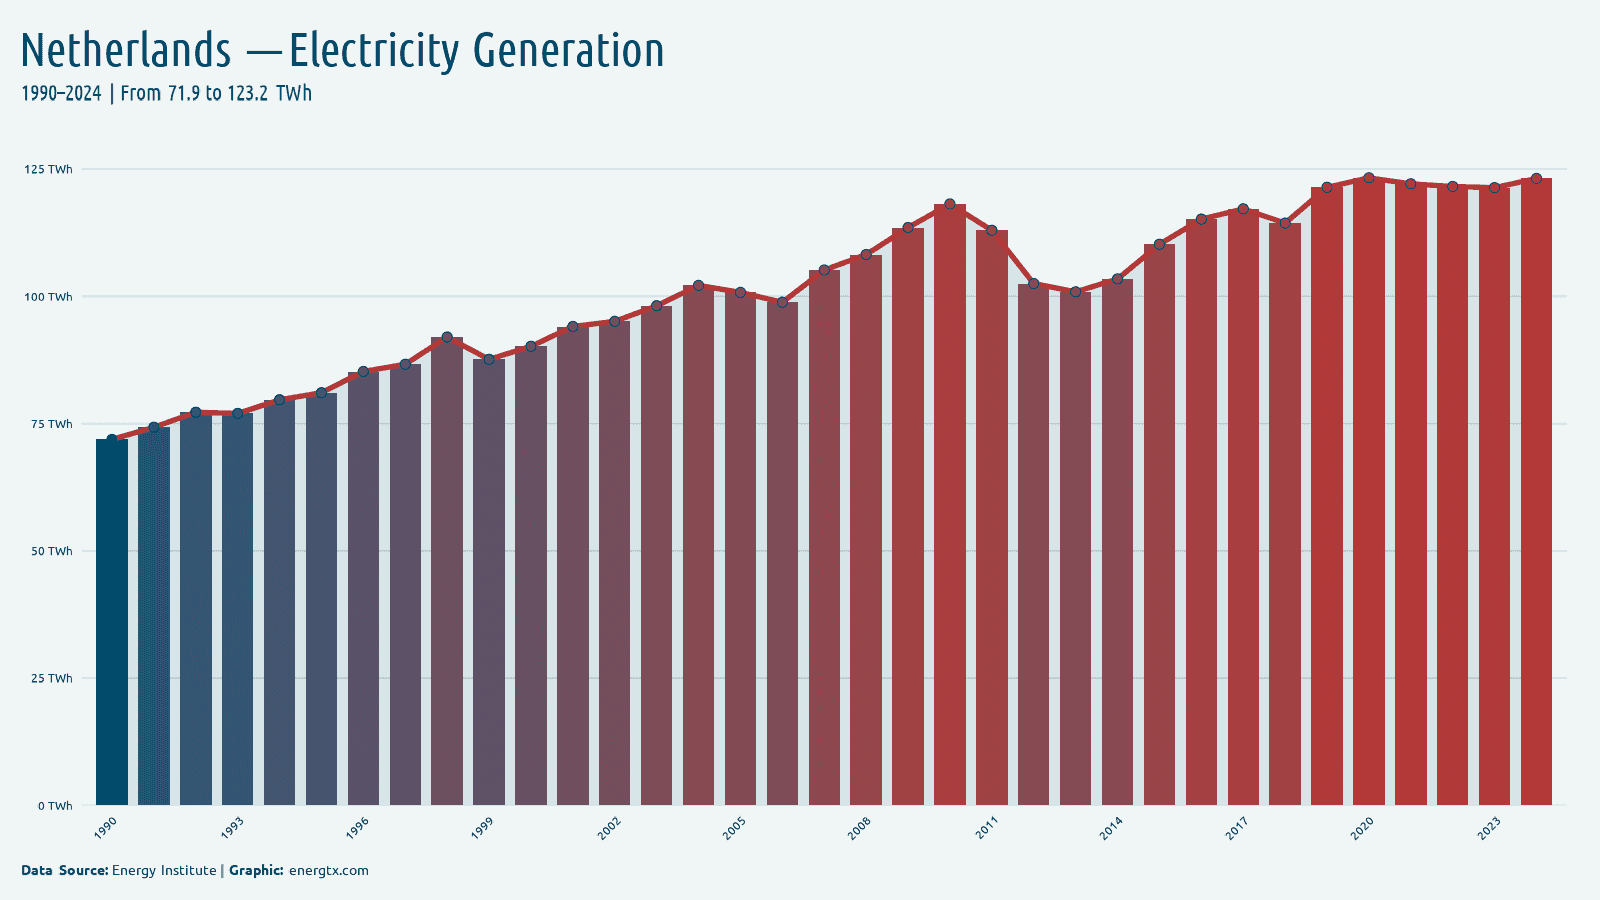
Electricity Generation
123.2
TWh
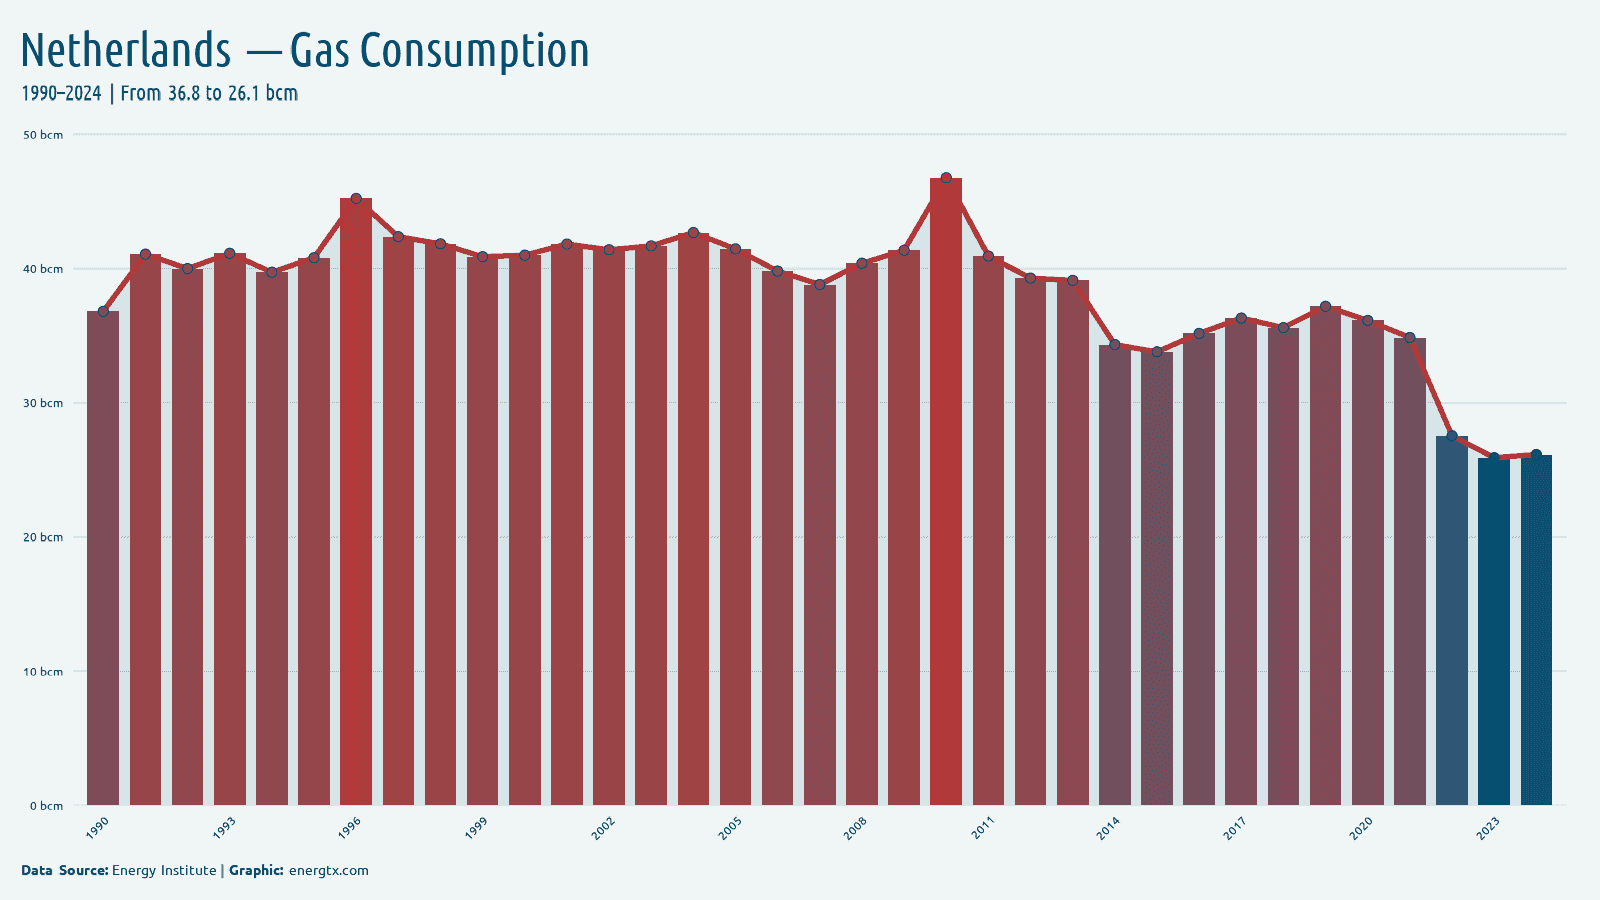
2024
Gas Consumption
26.1
bcm
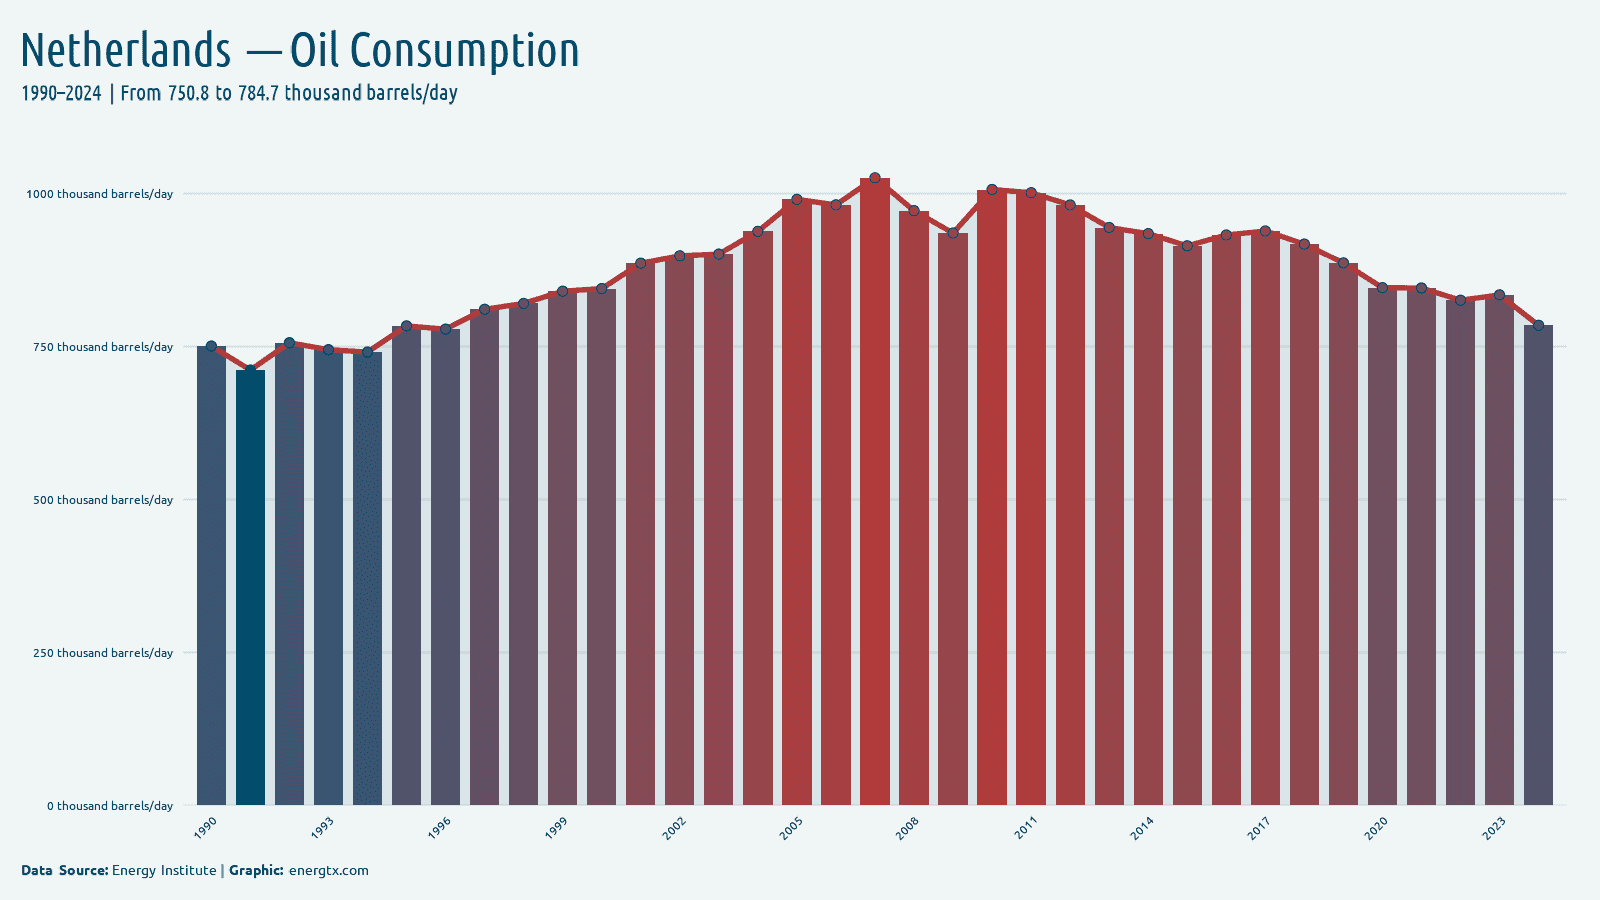
2024
Oil Consumption
784.7
k barrels/day
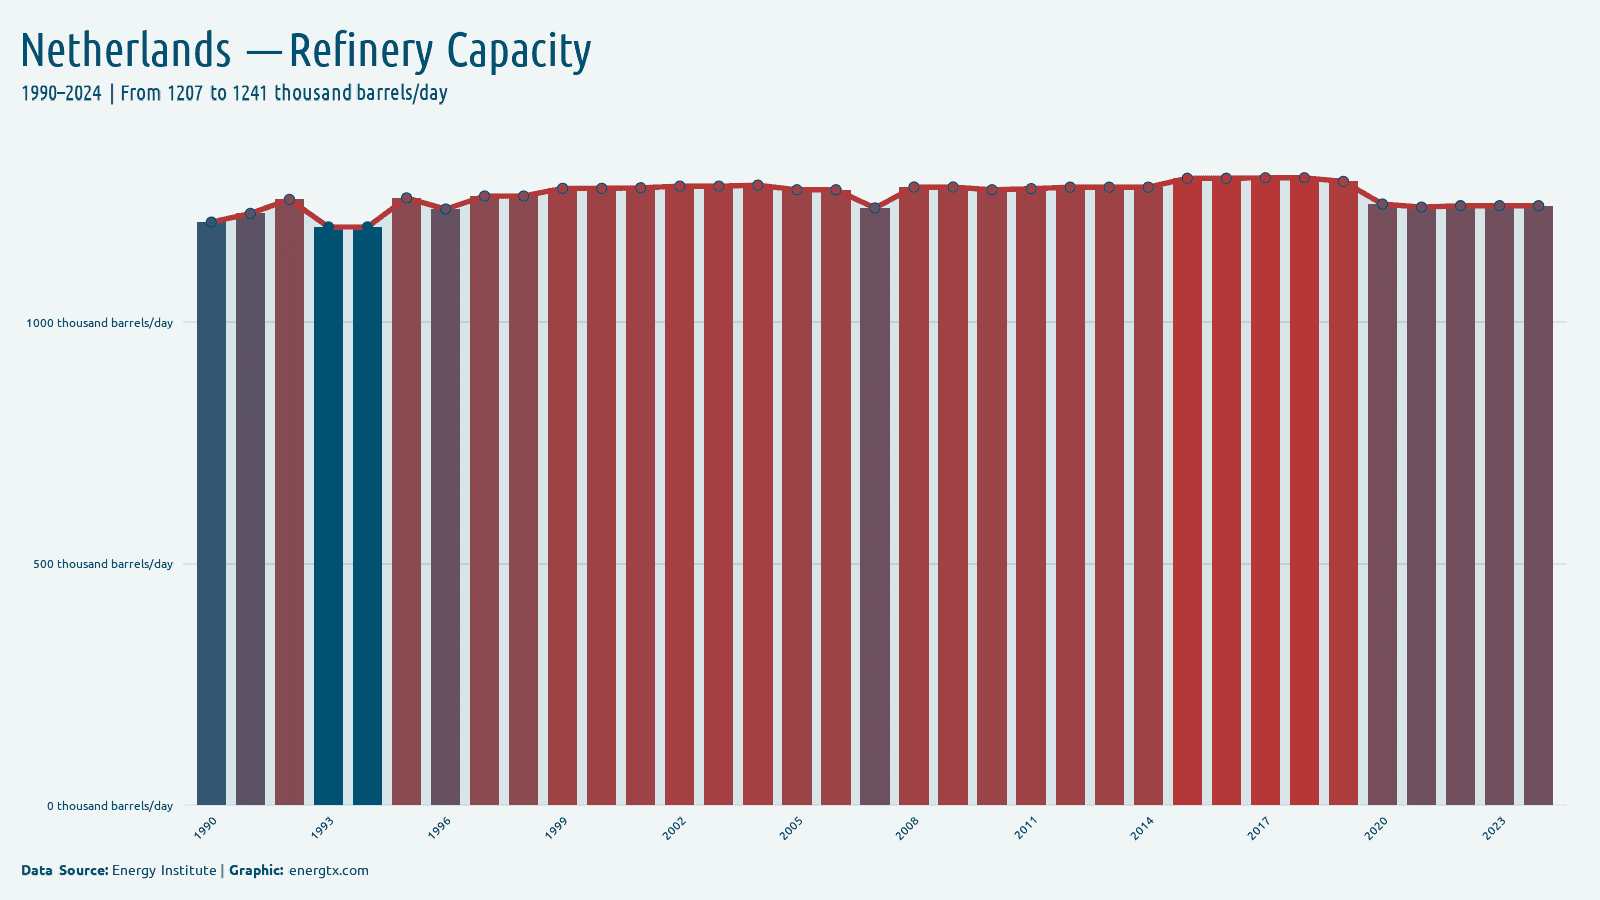
2024
Refinery Capacity
1.2k
k barrels/day
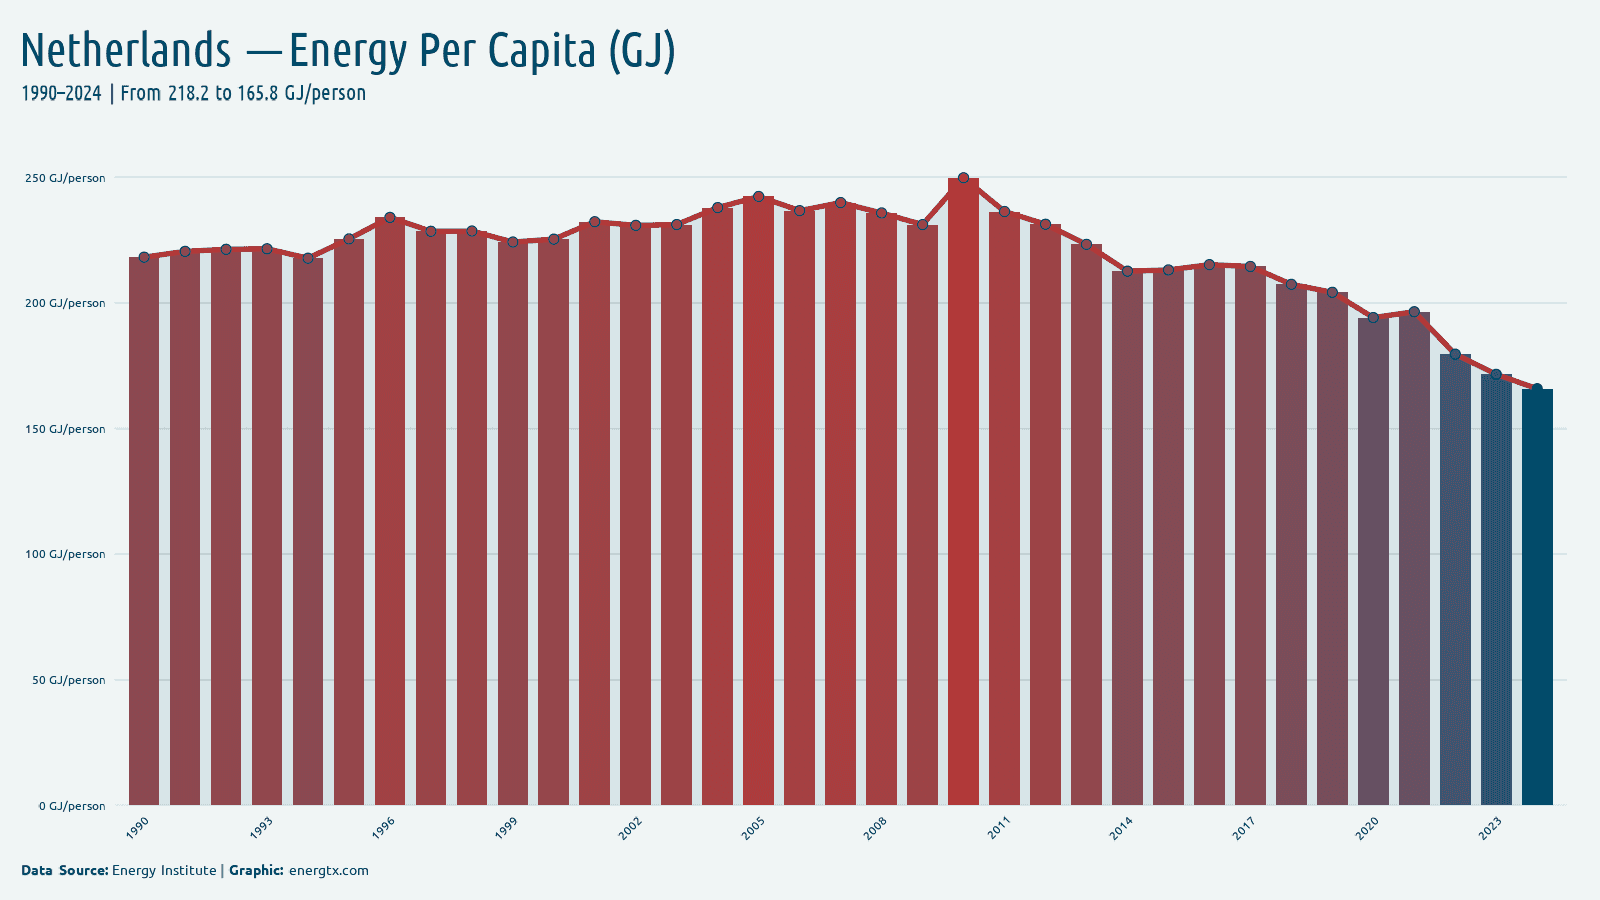
2024
Energy Per Capita (GJ)
165.8
GJ/person
2024
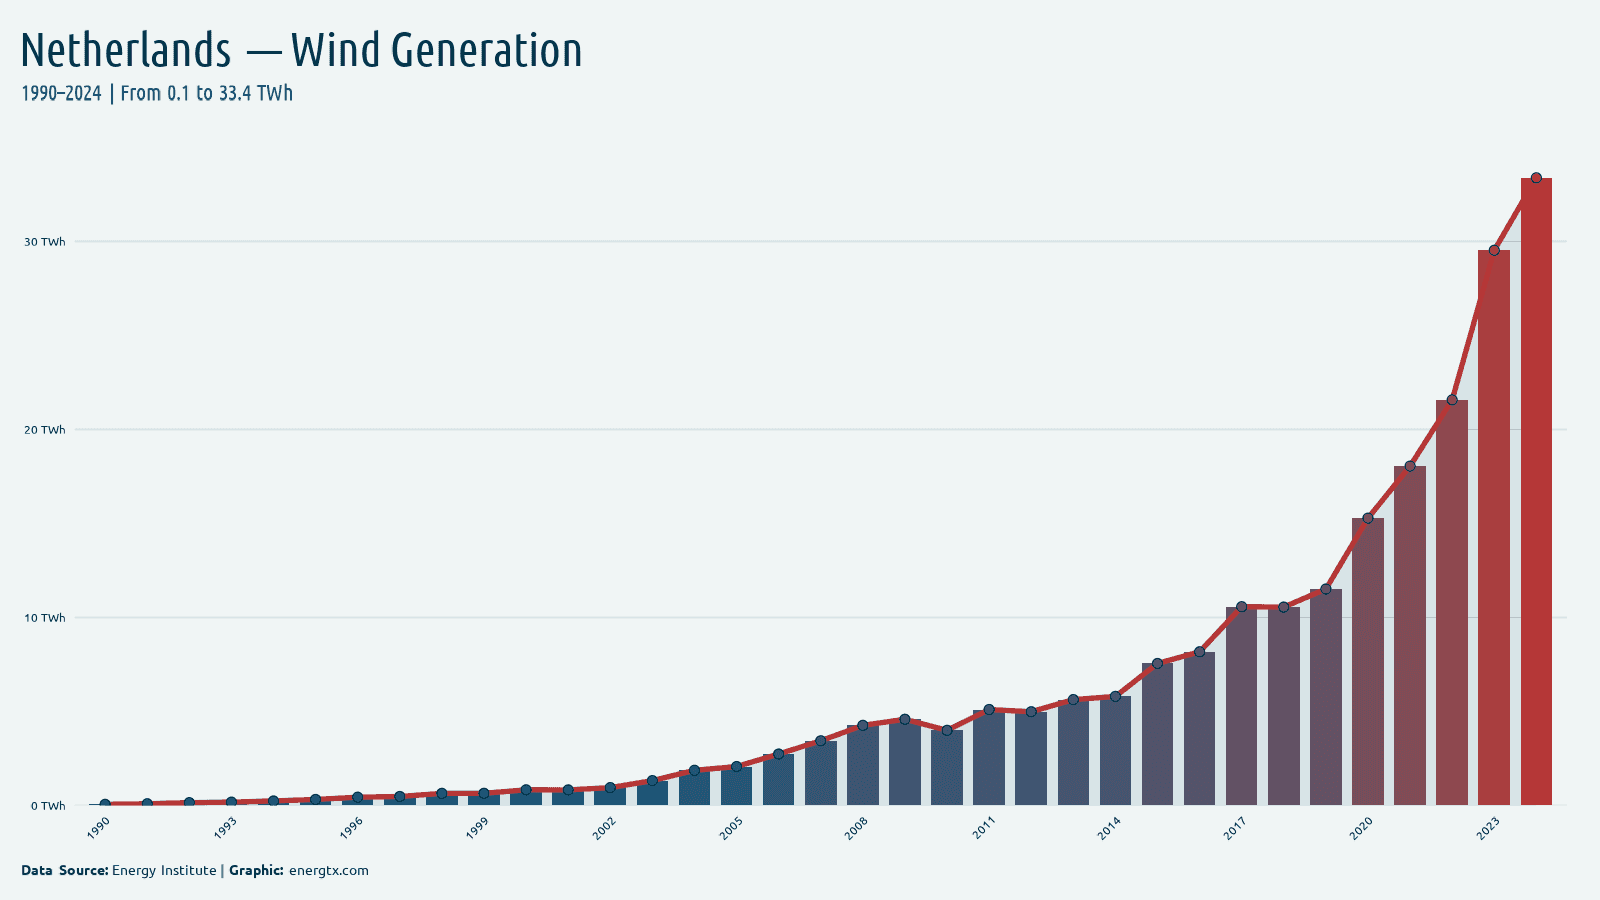
Wind Generation
33.4
TWh
2024
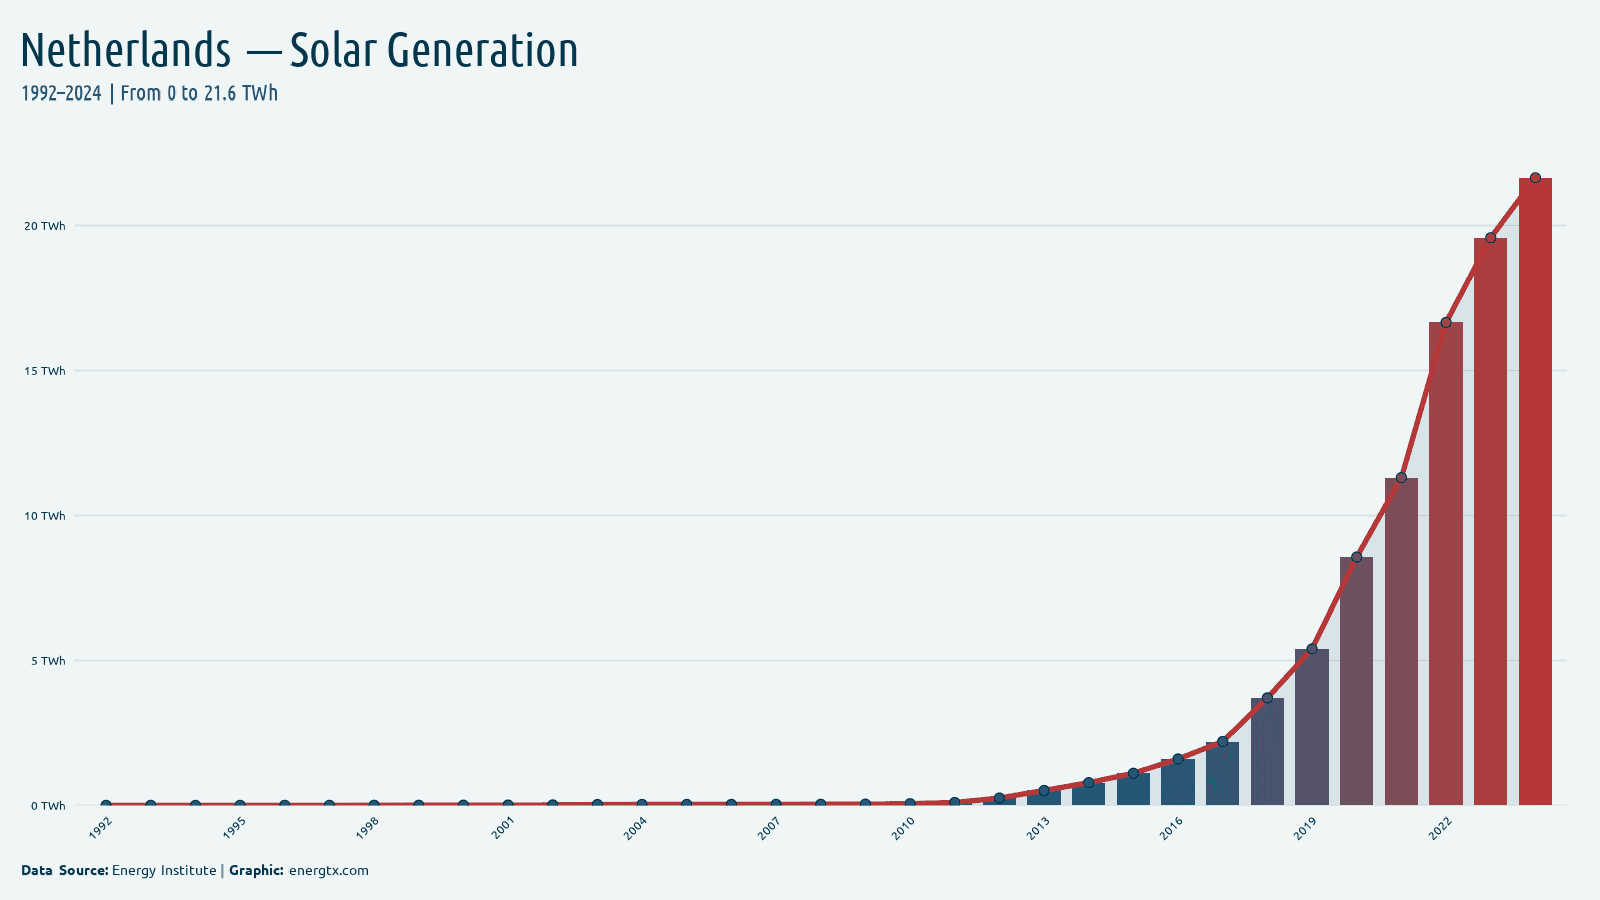
Solar Generation
21.6
TWh
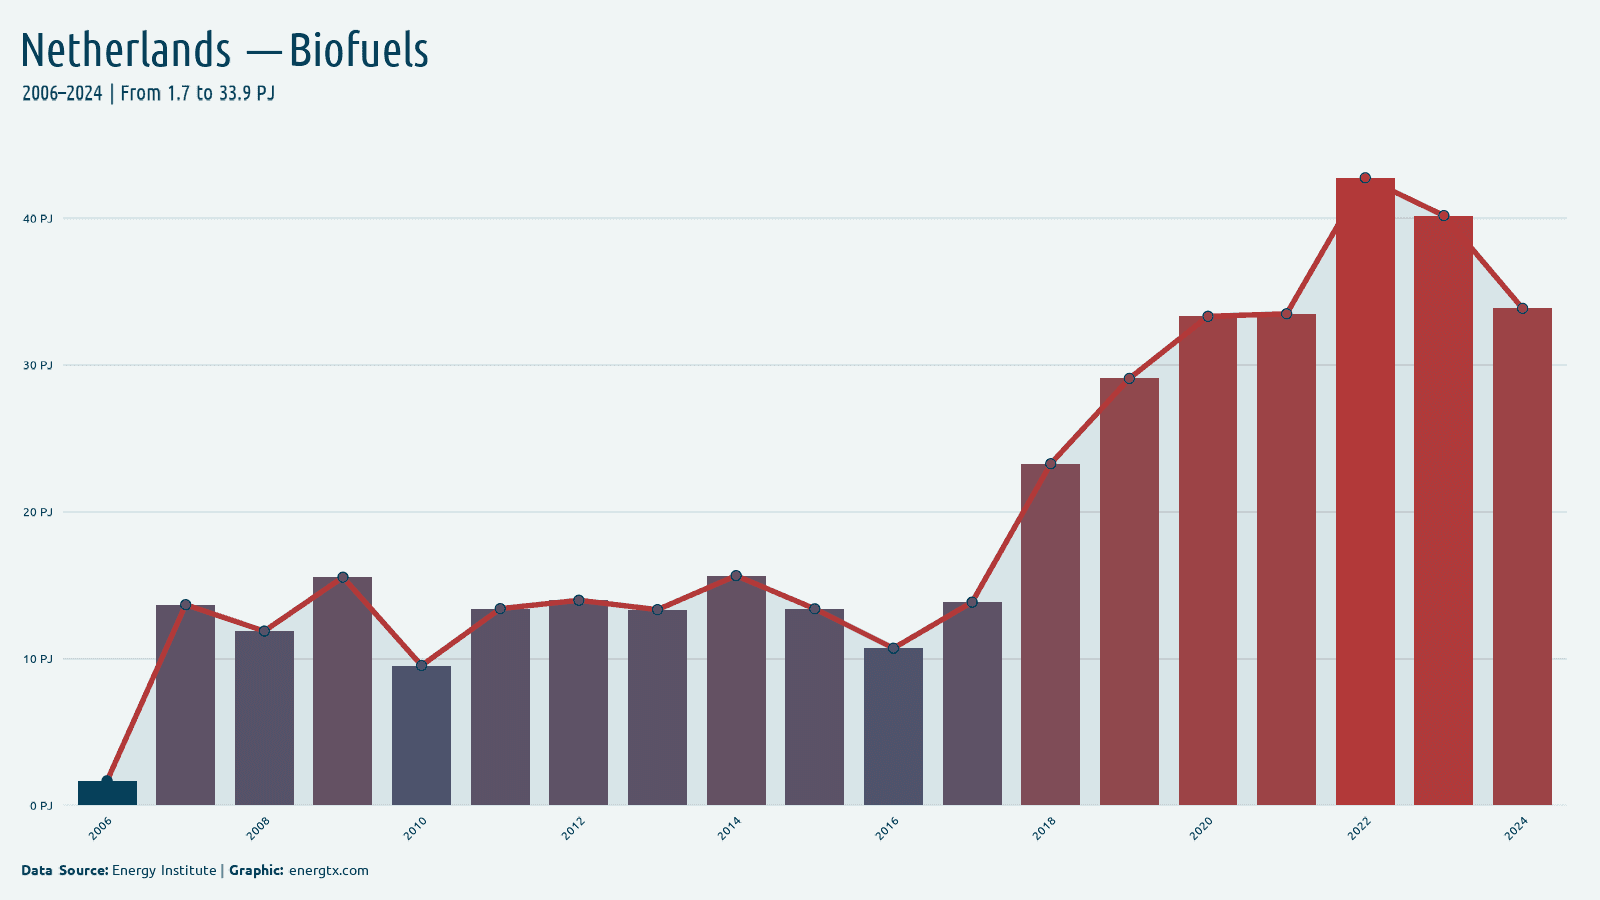
2024
Biofuels Consumption
33.9
PJ
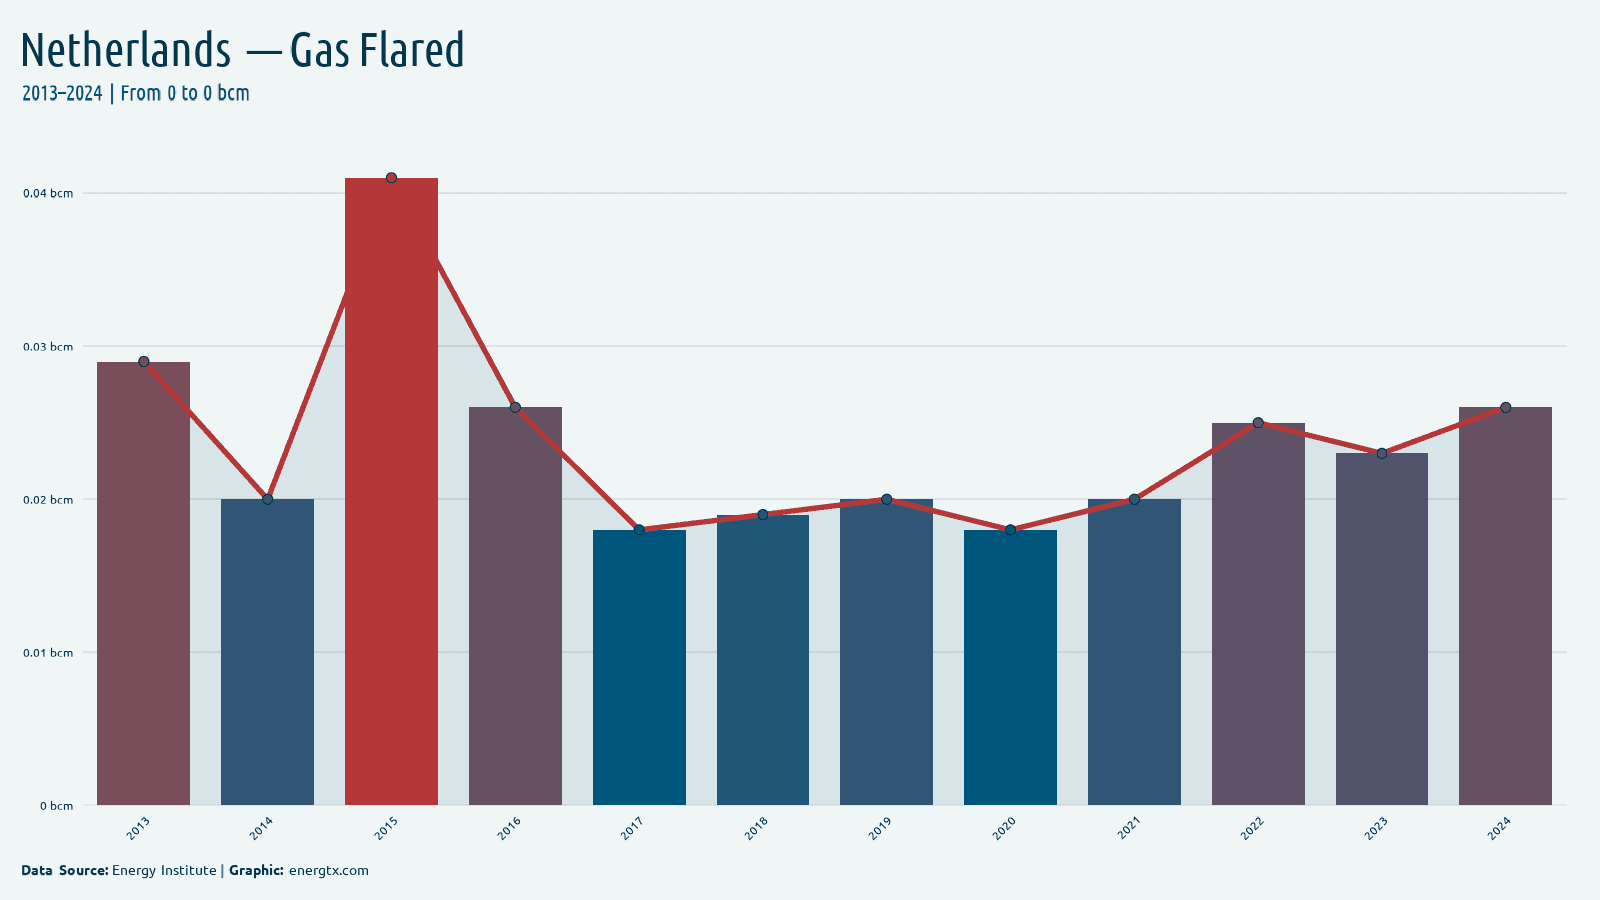
2024
Gas Flared
0.0
bcm
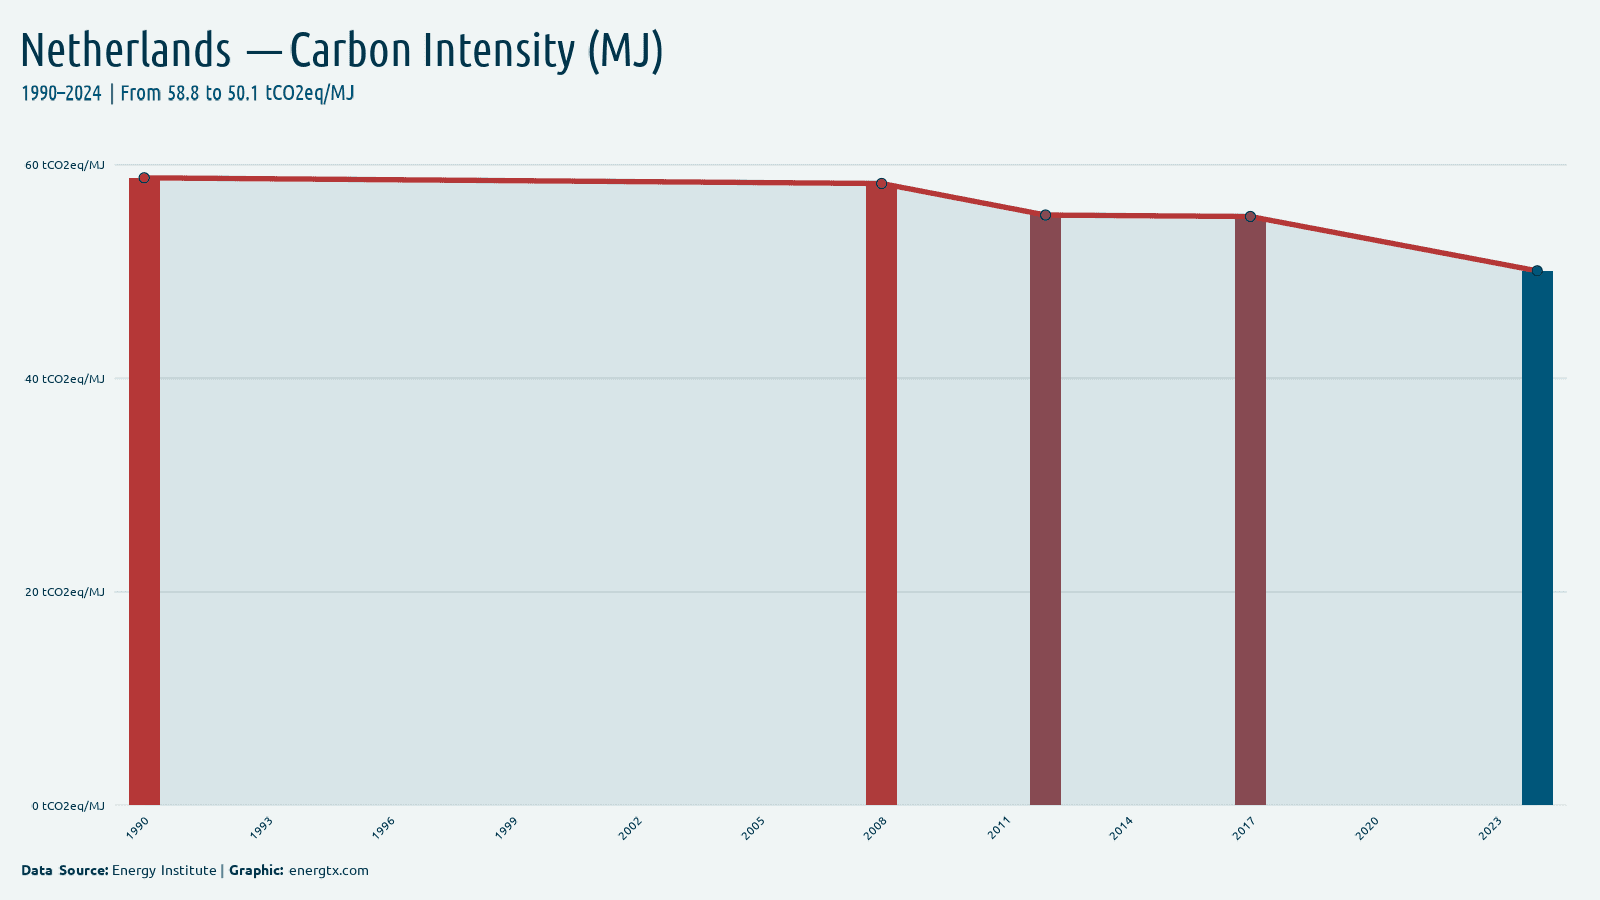
2024
Carbon Intensity (MJ)
50.1
tCO2eq/MJ
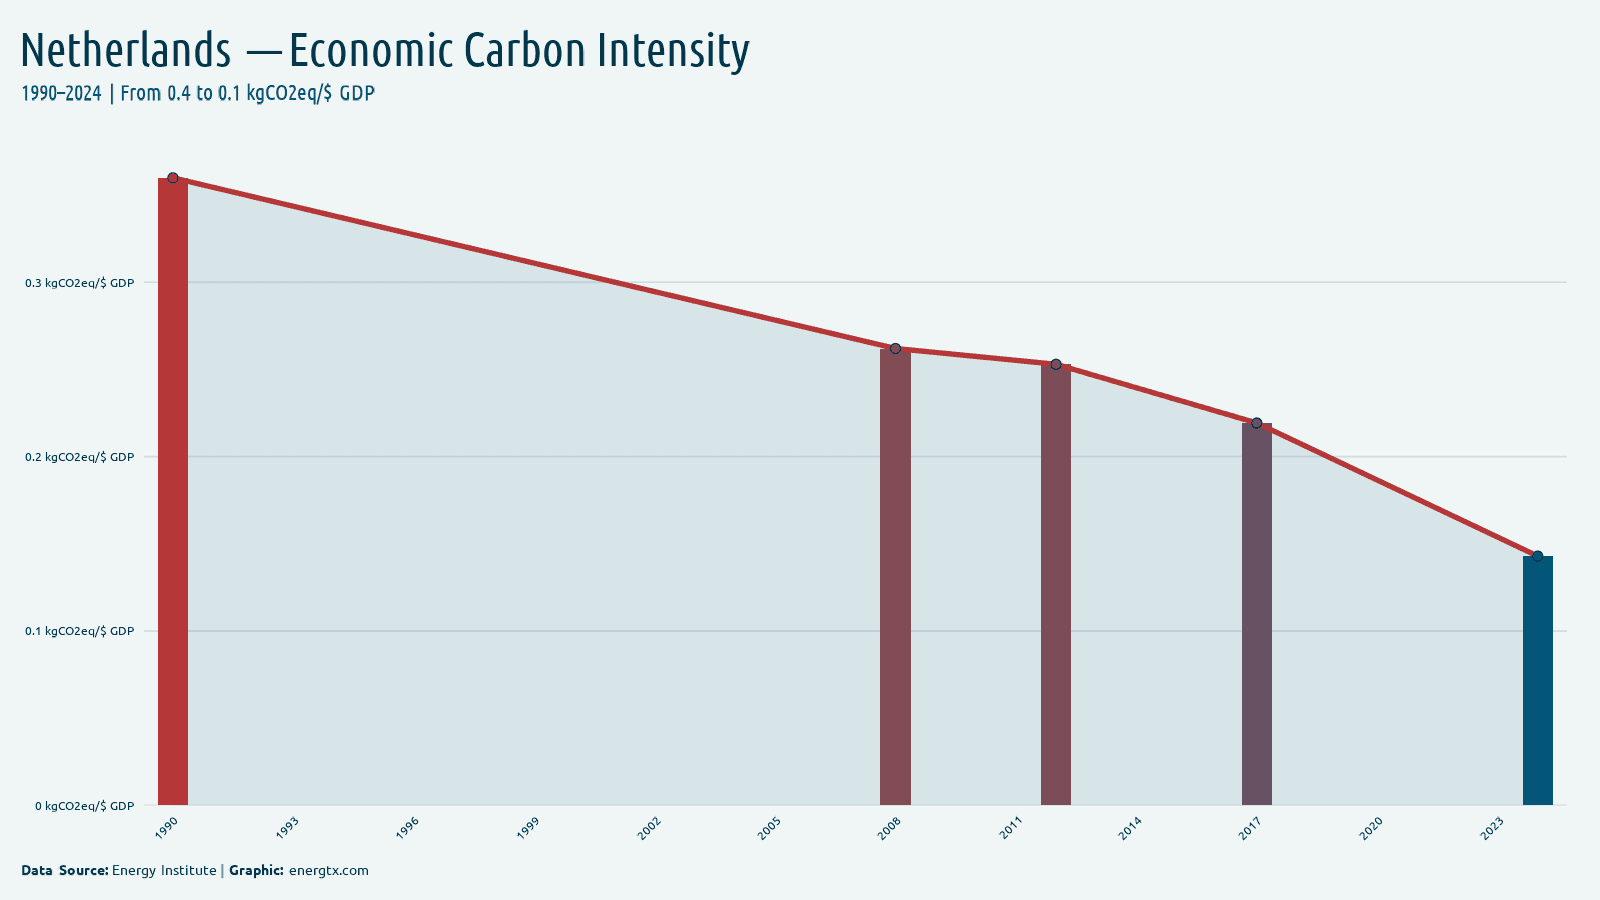
2024
Economic Carbon Intensity
0.1
kgCO2eq/$ GDP
2024
Petroleum Consumption
816.2
k barrels/day
2024
Petroleum Production
82.2
k barrels/day
2024
Crude Oil Production
23.9
k barrels/day
2024
Motor Gasoline
105.2
k barrels/day
2024
Jet Fuel
75.0
k barrels/day
2024
Distillate Fuel
149.7
k barrels/day
2024
LPG
77.0
k barrels/day
2024
Gas Production (BCF)
342.0
billion cubic feet
2024
Gas Consumption (BCF)
1.1k
billion cubic feet
2024
Gas Imports
2.2k
billion cubic feet
2024
Gas Exports
1.5k
billion cubic feet
2024
Coal Production (TST)
0.0
thousand short tons
2024
Coal Consumption (TST)
11.8k
thousand short tons
2024
Coal Imports
27.7k
thousand short tons
2024
Coal Exports
17.3k
thousand short tons
2023
Coal Reserves
3.6k
million short tons
2024
Elec. Generation (EIA)
119.5
billion kWh
2024
Elec. Consumption (EIA)
110.3
billion kWh
2024
Elec. Capacity
61.5
GW
2024
Elec. Imports
20.0
billion kWh
2024
Elec. Exports
24.3
billion kWh
2024
Elec. Losses
5.0
billion kWh
2024
Nuclear Capacity
0.5
GW
2024
Nuclear Generation (EIA)
3.4
billion kWh
2024
Fossil Capacity
24.4
GW
2024
Fossil Generation
52.8
billion kWh
2024
Renewable Capacity
36.6
GW
2024
Renewable Generation (EIA)
63.4
billion kWh
2024
Hydro Capacity
0.0
GW
2024
Hydro Generation
0.1
billion kWh
2024
Solar Capacity (EIA)
24.1
GW
2024
Solar Generation (EIA)
21.2
billion kWh
2024
Wind Capacity (EIA)
11.7
GW
2024
Wind Generation (EIA)
33.0
billion kWh
2024
Geothermal Capacity
0.0
GW
2024
Geothermal Generation
0.0
billion kWh
2024
Biomass Capacity
0.9
GW
2024
Biomass Generation
9.1
billion kWh
2023
Primary Energy Production
20.1
Mtoe
2023
Primary Energy Consumption (EIA)
83.6
Mtoe
2023
CO2 from Coal
23.7
million metric tonnes CO2
2023
CO2 from Petroleum
112.0
million metric tonnes CO2
2023
Energy Per Capita (Btu)
185.4
million Btu/person
2023
Energy Intensity (Btu/USD)
3.2
thousand Btu/USD PPP
2023
Elec. from Oil
1.3%
%
2023
Elec. from Fossil
48.0%
%
2021
Elec. Renew. (excl. Hydro)
33.1%
%
2021
Renew. excl. Hydro (kWh)
40383500.0k
kWh/capita
2023
T&D Losses
4.1%
%
2023
Net Energy Imports
87.0%
%
2023
Fossil Fuel Share
0.0%
%
2023
Renewables & Waste
7.8%
%
2023
Alt. & Nuclear Energy
9.0%
%
2022
Energy Intensity (MJ/GDP)
2.5
MJ/$ GDP
2023
Elec. from Nuclear
3.3%
%
2021
Final Energy (PJ)
1.8k
PJ
2022
Renew. Capacity/Capita
1.6k
watts/capita
2025
Crude oil closing stocks — JODI (thousand barrels)
28.9k
KBBL
2025
Crude oil production — JODI (thousand barrels/day)
5.9
k barrels/day
2025
Refinery crude intake — JODI (thousand barrels/day)
1.0k
k barrels/day
2025
Crude oil exports — JODI (thousand barrels/day)
0.5
k barrels/day
2025
Crude oil imports — JODI (thousand barrels/day)
1.1k
k barrels/day
2025
Diesel demand — JODI (thousand barrels/day)
142.5
k barrels/day
2025
Gasoline demand — JODI (thousand barrels/day)
99.3
k barrels/day
2025
Kerosene demand — JODI (thousand barrels/day)
77.9
k barrels/day
2025
LPG demand — JODI (thousand barrels/day)
91.3
k barrels/day
2025
Fuel oil demand — JODI (thousand barrels/day)
148.9
k barrels/day
2025
Oil products closing stocks — JODI (thousand barrels)
73.3k
KBBL
2025
Refinery output — JODI (thousand barrels/day)
1.2k
k barrels/day
2025
Total oil products demand — JODI (thousand barrels/day)
875.2
k barrels/day
2025
Oil products exports — JODI (thousand barrels/day)
2.1k
k barrels/day
2025
Oil products imports — JODI (thousand barrels/day)
1.6k
k barrels/day
2025
Bioenergy Share
5.1%
%
2025
Coal Share
7.1%
%
2025
Gas Share
34.9%
%
2025
Hydro Share
0.0%
%
2025
Nuclear Share
3.0%
%
2025
Other Fossil Share
3.9%
%
2025
Other Renewables Share
0.0%
%
2025
Solar Share
21.1%
%
2025
Wind Share
25.0%
%
2025
GHG Emissions (Total)
206.2
Mt CO2e
2025
GHG Per Capita
11.8
t CO2e/person
2025
Global GHG Share
0.3%
%
2025
GHG from Power
35.0
Mt CO2e
2025
GHG from Transport
56.7
Mt CO2e
2025
GHG from Manufacturing
44.4
Mt CO2e
2025
GHG from Buildings
24.6
Mt CO2e
2025
GHG from Agriculture
22.6
Mt CO2e
2025
GHG from Fossil Ops
15.5
Mt CO2e
2025
GHG from Waste
5.0
Mt CO2e
2025
GHG from Land Use
0.9
Mt CO2e
2023
Effective carbon rate (€/tCO2)
140.3
€/tCO2
2023
Net effective carbon rate (€/tCO2)
138.5
€/tCO2
Charts


Trends Over Time
Electricity Consumption (per capita)kWh/capita
Dataset
| Indicator | Year | Value | Unit | Source |
|---|---|---|---|---|
| Electricity Access | 2023 | 100.0% | % | World Bank |
| Electricity Access | 2022 | 100.0% | % | World Bank |
| Electricity Access | 2021 | 100.0% | % | World Bank |
| Electricity Access | 2020 | 100.0% | % | World Bank |
| Electricity Access | 2019 | 100.0% | % | World Bank |
| Electricity Access | 2018 | 100.0% | % | World Bank |
| Electricity Access | 2017 | 100.0% | % | World Bank |
| Electricity Access | 2016 | 100.0% | % | World Bank |
| Electricity Access | 2015 | 100.0% | % | World Bank |
| Electricity Access | 2014 | 100.0% | % | World Bank |
| Electricity Access | 2013 | 100.0% | % | World Bank |
| Electricity Access | 2012 | 100.0% | % | World Bank |
| Electricity Access | 2011 | 100.0% | % | World Bank |
| Electricity Access | 2010 | 100.0% | % | World Bank |
| Electricity Access | 2009 | 100.0% | % | World Bank |
| Electricity Access | 2008 | 100.0% | % | World Bank |
| Electricity Access | 2007 | 100.0% | % | World Bank |
| Electricity Access | 2006 | 100.0% | % | World Bank |
| Electricity Access | 2005 | 100.0% | % | World Bank |
| Electricity Access | 2004 | 100.0% | % | World Bank |
| Electricity Access | 2003 | 100.0% | % | World Bank |
| Electricity Access | 2002 | 100.0% | % | World Bank |
| Electricity Access | 2001 | 100.0% | % | World Bank |
| Electricity Access | 2000 | 100.0% | % | World Bank |
| Electricity Access | 1999 | 100.0% | % | World Bank |
| Electricity Access | 1998 | 100.0% | % | World Bank |
| Electricity Access | 1997 | 100.0% | % | World Bank |
| Electricity Access | 1996 | 100.0% | % | World Bank |
| Electricity Access | 1995 | 100.0% | % | World Bank |
| Electricity Access | 1994 | 100.0% | % | World Bank |
| Electricity Access | 1993 | 100.0% | % | World Bank |
| Electricity Access | 1992 | 100.0% | % | World Bank |
| Electricity Access | 1991 | 100.0% | % | World Bank |
| Electricity Access | 1990 | 100.0% | % | World Bank |
| Alt. & Nuclear Energy | 2023 | 9.0% | % | World Bank |
| Alt. & Nuclear Energy | 2022 | 7.3% | % | World Bank |
| Alt. & Nuclear Energy | 2021 | 5.3% | % | World Bank |
| Alt. & Nuclear Energy | 2020 | 4.8% | % | World Bank |
| Alt. & Nuclear Energy | 2019 | 3.8% | % | World Bank |
| Alt. & Nuclear Energy | 2018 | 3.2% | % | World Bank |
| Alt. & Nuclear Energy | 2017 | 3.0% | % | World Bank |
| Alt. & Nuclear Energy | 2016 | 2.9% | % | World Bank |
| Alt. & Nuclear Energy | 2015 | 2.9% | % | World Bank |
| Alt. & Nuclear Energy | 2014 | 2.4% | % | World Bank |
| Alt. & Nuclear Energy | 2013 | 1.8% | % | World Bank |
| Alt. & Nuclear Energy | 2012 | 2.0% | % | World Bank |
| Alt. & Nuclear Energy | 2011 | 2.0% | % | World Bank |
| Alt. & Nuclear Energy | 2010 | 1.7% | % | World Bank |
| Alt. & Nuclear Energy | 2009 | 2.0% | % | World Bank |
| Alt. & Nuclear Energy | 2008 | 1.9% | % | World Bank |
| Alt. & Nuclear Energy | 2007 | 1.8% | % | World Bank |
| Alt. & Nuclear Energy | 2006 | 1.5% | % | World Bank |
| Alt. & Nuclear Energy | 2005 | 1.6% | % | World Bank |
| Alt. & Nuclear Energy | 2004 | 1.5% | % | World Bank |
| Alt. & Nuclear Energy | 2003 | 1.5% | % | World Bank |
| Alt. & Nuclear Energy | 2002 | 1.5% | % | World Bank |
| Alt. & Nuclear Energy | 2001 | 1.5% | % | World Bank |
| Alt. & Nuclear Energy | 2000 | 1.5% | % | World Bank |
| Alt. & Nuclear Energy | 1999 | 1.5% | % | World Bank |
| Alt. & Nuclear Energy | 1998 | 1.4% | % | World Bank |
| Alt. & Nuclear Energy | 1997 | 0.9% | % | World Bank |
| Alt. & Nuclear Energy | 1996 | 1.5% | % | World Bank |
| Alt. & Nuclear Energy | 1995 | 1.5% | % | World Bank |
| Alt. & Nuclear Energy | 1994 | 1.5% | % | World Bank |
| Alt. & Nuclear Energy | 1993 | 1.5% | % | World Bank |
| Alt. & Nuclear Energy | 1992 | 1.5% | % | World Bank |
| Alt. & Nuclear Energy | 1991 | 1.3% | % | World Bank |
| Alt. & Nuclear Energy | 1990 | 1.4% | % | World Bank |
| Biofuels Consumption | 2024 | 33.9 | PJ | Energy Institute |
| Biofuels Consumption | 2023 | 40.2 | PJ | Energy Institute |
| Biofuels Consumption | 2022 | 42.8 | PJ | Energy Institute |
| Biofuels Consumption | 2021 | 33.5 | PJ | Energy Institute |
| Biofuels Consumption | 2020 | 33.3 | PJ | Energy Institute |
| Biofuels Consumption | 2019 | 29.1 | PJ | Energy Institute |
| Biofuels Consumption | 2018 | 23.3 | PJ | Energy Institute |
| Biofuels Consumption | 2017 | 13.9 | PJ | Energy Institute |
| Biofuels Consumption | 2016 | 10.7 | PJ | Energy Institute |
| Biofuels Consumption | 2015 | 13.4 | PJ | Energy Institute |
| Biofuels Consumption | 2014 | 15.7 | PJ | Energy Institute |
| Biofuels Consumption | 2013 | 13.3 | PJ | Energy Institute |
| Biofuels Consumption | 2012 | 14.0 | PJ | Energy Institute |
| Biofuels Consumption | 2011 | 13.4 | PJ | Energy Institute |
| Biofuels Consumption | 2010 | 9.5 | PJ | Energy Institute |
| Biofuels Consumption | 2009 | 15.6 | PJ | Energy Institute |
| Biofuels Consumption | 2008 | 11.9 | PJ | Energy Institute |
| Biofuels Consumption | 2007 | 13.7 | PJ | Energy Institute |
| Biofuels Consumption | 2006 | 1.7 | PJ | Energy Institute |
| Biomass Capacity | 2024 | 0.9 | GW | EIA |
| Biomass Capacity | 2023 | 0.9 | GW | EIA |
| Biomass Capacity | 2022 | 0.9 | GW | EIA |
| Biomass Capacity | 2021 | 0.9 | GW | EIA |
| Biomass Capacity | 2020 | 0.9 | GW | EIA |
| Biomass Capacity | 2019 | 0.8 | GW | EIA |
| Biomass Capacity | 2018 | 0.8 | GW | EIA |
| Biomass Capacity | 2017 | 0.8 | GW | EIA |
| Biomass Capacity | 2016 | 0.8 | GW | EIA |
| Biomass Capacity | 2015 | 0.8 | GW | EIA |
| Biomass Capacity | 2014 | 0.8 | GW | EIA |
| Biomass Capacity | 2013 | 0.8 | GW | EIA |
| Biomass Capacity | 2012 | 0.7 | GW | EIA |
| Biomass Capacity | 2011 | 0.7 | GW | EIA |
| Biomass Capacity | 2010 | 0.7 | GW | EIA |
| Biomass Capacity | 2009 | 0.6 | GW | EIA |
| Biomass Capacity | 2008 | 0.6 | GW | EIA |
| Biomass Capacity | 2007 | 0.5 | GW | EIA |
| Biomass Capacity | 2006 | 0.3 | GW | EIA |
| Biomass Capacity | 2005 | 0.3 | GW | EIA |
| Biomass Capacity | 2004 | 0.3 | GW | EIA |
| Biomass Capacity | 2003 | 0.3 | GW | EIA |
| Biomass Capacity | 2002 | 0.3 | GW | EIA |
| Biomass Capacity | 2001 | 0.3 | GW | EIA |
| Biomass Capacity | 2000 | 0.3 | GW | EIA |
| Biomass Generation | 2024 | 9.1 | billion kWh | EIA |
| Biomass Generation | 2023 | 9.7 | billion kWh | EIA |
| Biomass Generation | 2022 | 11.1 | billion kWh | EIA |
| Biomass Generation | 2021 | 12.6 | billion kWh | EIA |
| Biomass Generation | 2020 | 10.7 | billion kWh | EIA |
| Biomass Generation | 2019 | 7.7 | billion kWh | EIA |
| Biomass Generation | 2018 | 6.6 | billion kWh | EIA |
| Biomass Generation | 2017 | 6.3 | billion kWh | EIA |
| Biomass Generation | 2016 | 6.6 | billion kWh | EIA |
| Biomass Generation | 2015 | 6.5 | billion kWh | EIA |
| Biomass Generation | 2014 | 6.6 | billion kWh | EIA |
| Biomass Generation | 2013 | 7.7 | billion kWh | EIA |
| Biomass Generation | 2012 | 9.0 | billion kWh | EIA |
| Biomass Generation | 2011 | 8.8 | billion kWh | EIA |
| Biomass Generation | 2010 | 8.6 | billion kWh | EIA |
| Biomass Generation | 2009 | 7.6 | billion kWh | EIA |
| Biomass Generation | 2008 | 6.6 | billion kWh | EIA |
| Biomass Generation | 2007 | 5.5 | billion kWh | EIA |
| Biomass Generation | 2006 | 6.6 | billion kWh | EIA |
| Biomass Generation | 2005 | 6.7 | billion kWh | EIA |
| Biomass Generation | 2004 | 4.6 | billion kWh | EIA |
| Biomass Generation | 2003 | 3.9 | billion kWh | EIA |
| Biomass Generation | 2002 | 4.1 | billion kWh | EIA |
| Biomass Generation | 2001 | 3.5 | billion kWh | EIA |
| Biomass Generation | 2000 | 3.2 | billion kWh | EIA |
| Biomass Generation | 1999 | 3.0 | billion kWh | EIA |
| Biomass Generation | 1998 | 2.7 | billion kWh | EIA |
| Biomass Generation | 1997 | 2.5 | billion kWh | EIA |
| Biomass Generation | 1996 | 2.2 | billion kWh | EIA |
| Biomass Generation | 1995 | 1.6 | billion kWh | EIA |
| Biomass Generation | 1994 | 1.5 | billion kWh | EIA |
| Biomass Generation | 1993 | 1.3 | billion kWh | EIA |
| Biomass Generation | 1992 | 1.1 | billion kWh | EIA |
| Biomass Generation | 1991 | 1.2 | billion kWh | EIA |
| Biomass Generation | 1990 | 1.1 | billion kWh | EIA |
| Carbon Intensity (MJ) | 2024 | 50.1 | tCO2eq/MJ | Energy Institute |
| Carbon Intensity (MJ) | 2017 | 55.2 | tCO2eq/MJ | Energy Institute |
| Carbon Intensity (MJ) | 2012 | 55.3 | tCO2eq/MJ | Energy Institute |
| Carbon Intensity (MJ) | 2008 | 58.2 | tCO2eq/MJ | Energy Institute |
| Carbon Intensity (MJ) | 1990 | 58.8 | tCO2eq/MJ | Energy Institute |
| Carbon Intensity | 2024 | 0.2 | tCO2/EJ | Energy Institute |
| Carbon Intensity | 2023 | 0.1 | tCO2/EJ | Energy Institute |
| Carbon Intensity | 2022 | 0.0 | tCO2/EJ | Energy Institute |
| Carbon Intensity | 2021 | 0.1 | tCO2/EJ | Energy Institute |
| Carbon Intensity | 2020 | 0.1 | tCO2/EJ | Energy Institute |
| Carbon Intensity | 2019 | 0.1 | tCO2/EJ | Energy Institute |
| Carbon Intensity | 2018 | 0.1 | tCO2/EJ | Energy Institute |
| Carbon Intensity | 2017 | 0.1 | tCO2/EJ | Energy Institute |
| Carbon Intensity | 2016 | 0.1 | tCO2/EJ | Energy Institute |
| Carbon Intensity | 2015 | 0.2 | tCO2/EJ | Energy Institute |
| Carbon Intensity | 2014 | 0.2 | tCO2/EJ | Energy Institute |
| Carbon Intensity | 2013 | 0.2 | tCO2/EJ | Energy Institute |
| Carbon Intensity | 2012 | 0.2 | tCO2/EJ | Energy Institute |
| Carbon Intensity | 2011 | 0.2 | tCO2/EJ | Energy Institute |
| Carbon Intensity | 2010 | 0.2 | tCO2/EJ | Energy Institute |
| Carbon Intensity | 2009 | 0.2 | tCO2/EJ | Energy Institute |
| Carbon Intensity | 2008 | 0.2 | tCO2/EJ | Energy Institute |
| Carbon Intensity | 2007 | 0.2 | tCO2/EJ | Energy Institute |
| Carbon Intensity | 2006 | 0.2 | tCO2/EJ | Energy Institute |
| Carbon Intensity | 2005 | 0.2 | tCO2/EJ | Energy Institute |
| Carbon Intensity | 2004 | 0.2 | tCO2/EJ | Energy Institute |
| Carbon Intensity | 2003 | 0.2 | tCO2/EJ | Energy Institute |
| Carbon Intensity | 2002 | 0.2 | tCO2/EJ | Energy Institute |
| Carbon Intensity | 2001 | 0.2 | tCO2/EJ | Energy Institute |
| Carbon Intensity | 2000 | 0.2 | tCO2/EJ | Energy Institute |
| Carbon Intensity | 1999 | 0.2 | tCO2/EJ | Energy Institute |
| Carbon Intensity | 1998 | 0.2 | tCO2/EJ | Energy Institute |
| Carbon Intensity | 1997 | 0.2 | tCO2/EJ | Energy Institute |
| Carbon Intensity | 1996 | 0.2 | tCO2/EJ | Energy Institute |
| Carbon Intensity | 1995 | 0.2 | tCO2/EJ | Energy Institute |
| Carbon Intensity | 1994 | 0.2 | tCO2/EJ | Energy Institute |
| Carbon Intensity | 1993 | 0.2 | tCO2/EJ | Energy Institute |
| Carbon Intensity | 1992 | 0.2 | tCO2/EJ | Energy Institute |
| Carbon Intensity | 1991 | 0.2 | tCO2/EJ | Energy Institute |
| Carbon Intensity | 1990 | 0.2 | tCO2/EJ | Energy Institute |
| CO2 Emissions (per capita) | 2023 | 6.5 | metric tons/capita | Global Carbon Project |
| CO2 Emissions (per capita) | 2022 | 7.1 | metric tons/capita | Global Carbon Project |
| CO2 Emissions (per capita) | 2021 | 7.9 | metric tons/capita | Global Carbon Project |
| CO2 Emissions (per capita) | 2020 | 7.8 | metric tons/capita | Global Carbon Project |
| CO2 Emissions (per capita) | 2019 | 8.7 | metric tons/capita | Global Carbon Project |
| CO2 Emissions (per capita) | 2018 | 9.1 | metric tons/capita | Global Carbon Project |
| CO2 Emissions (per capita) | 2017 | 9.4 | metric tons/capita | Global Carbon Project |
| CO2 Emissions (per capita) | 2016 | 9.6 | metric tons/capita | Global Carbon Project |
| CO2 Emissions (per capita) | 2015 | 9.6 | metric tons/capita | Global Carbon Project |
| CO2 Emissions (per capita) | 2014 | 9.2 | metric tons/capita | Global Carbon Project |
| CO2 Emissions (per capita) | 2013 | 9.7 | metric tons/capita | Global Carbon Project |
| CO2 Emissions (per capita) | 2012 | 9.8 | metric tons/capita | Global Carbon Project |
| CO2 Emissions (per capita) | 2011 | 10.1 | metric tons/capita | Global Carbon Project |
Showing 200 of 3755 records. Download for the full dataset.
Download Netherlands Data
Found a data error?
Our data is sourced from World Bank, Energy Institute, OWID, OECD, IAEA, GCP, and Eurostat. If you notice an incorrect value, missing data, or any discrepancy for Netherlands, please let us know so we can investigate and correct it. Include the indicator name, year, and a brief description of the issue.
Report a data error