🇮🇩
Indonesia
3502 records · 126 indicators · 1990–2025
3,502
Data Records
126
Indicators
1990–2025
Time Range
IDN
ISO Code
Latest Indicator Values
2023
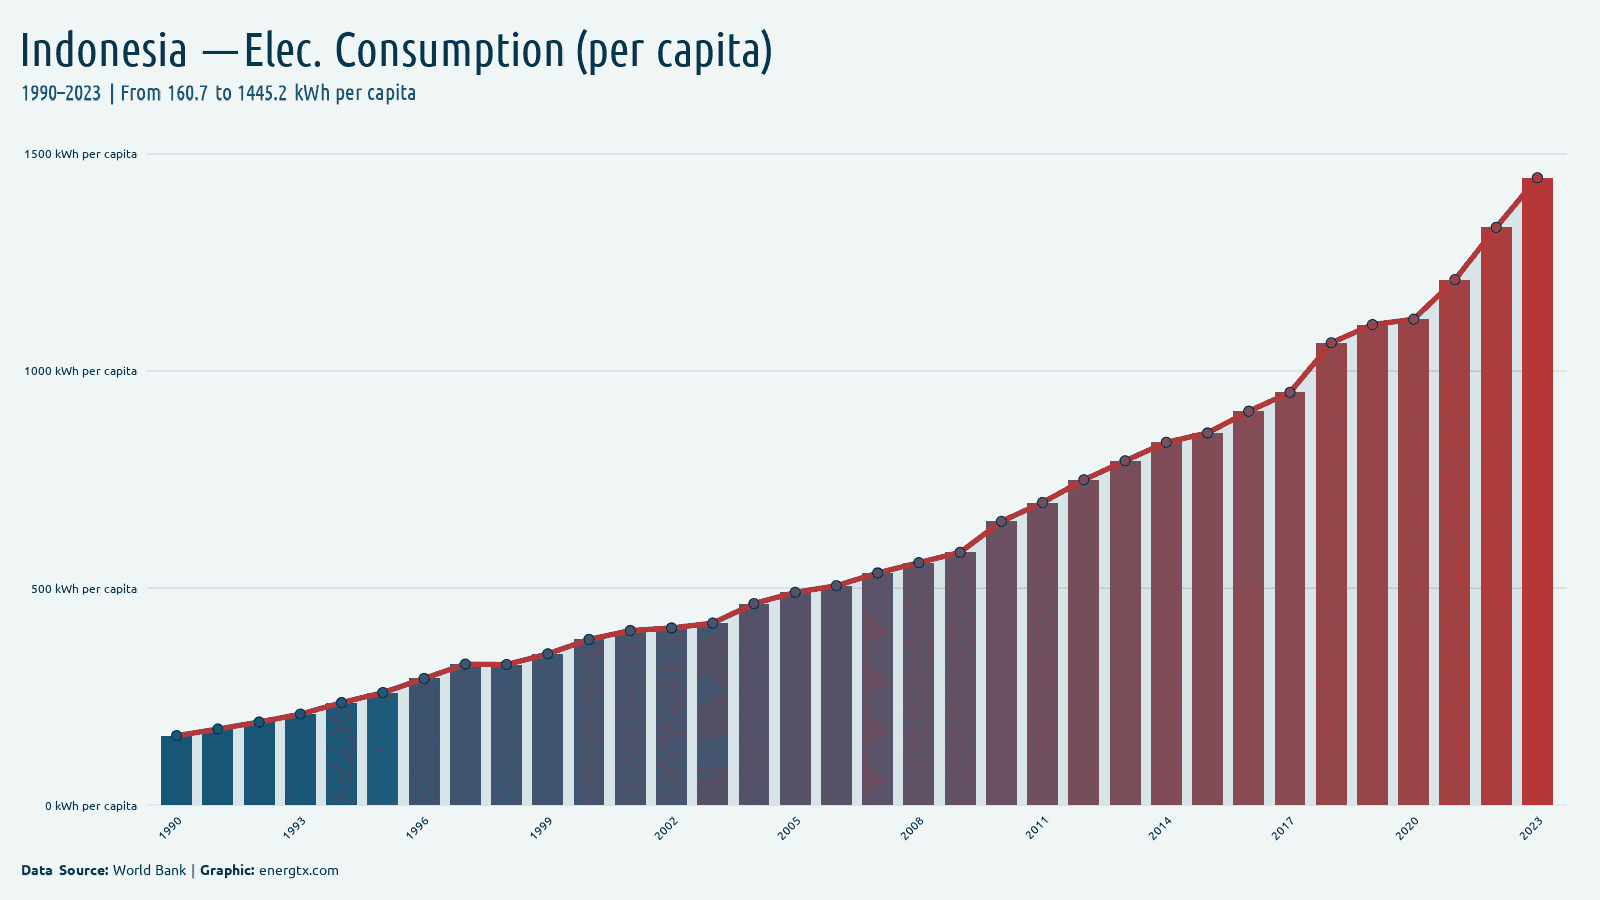
Electricity Consumption (per capita)
1.4k
kWh/capita
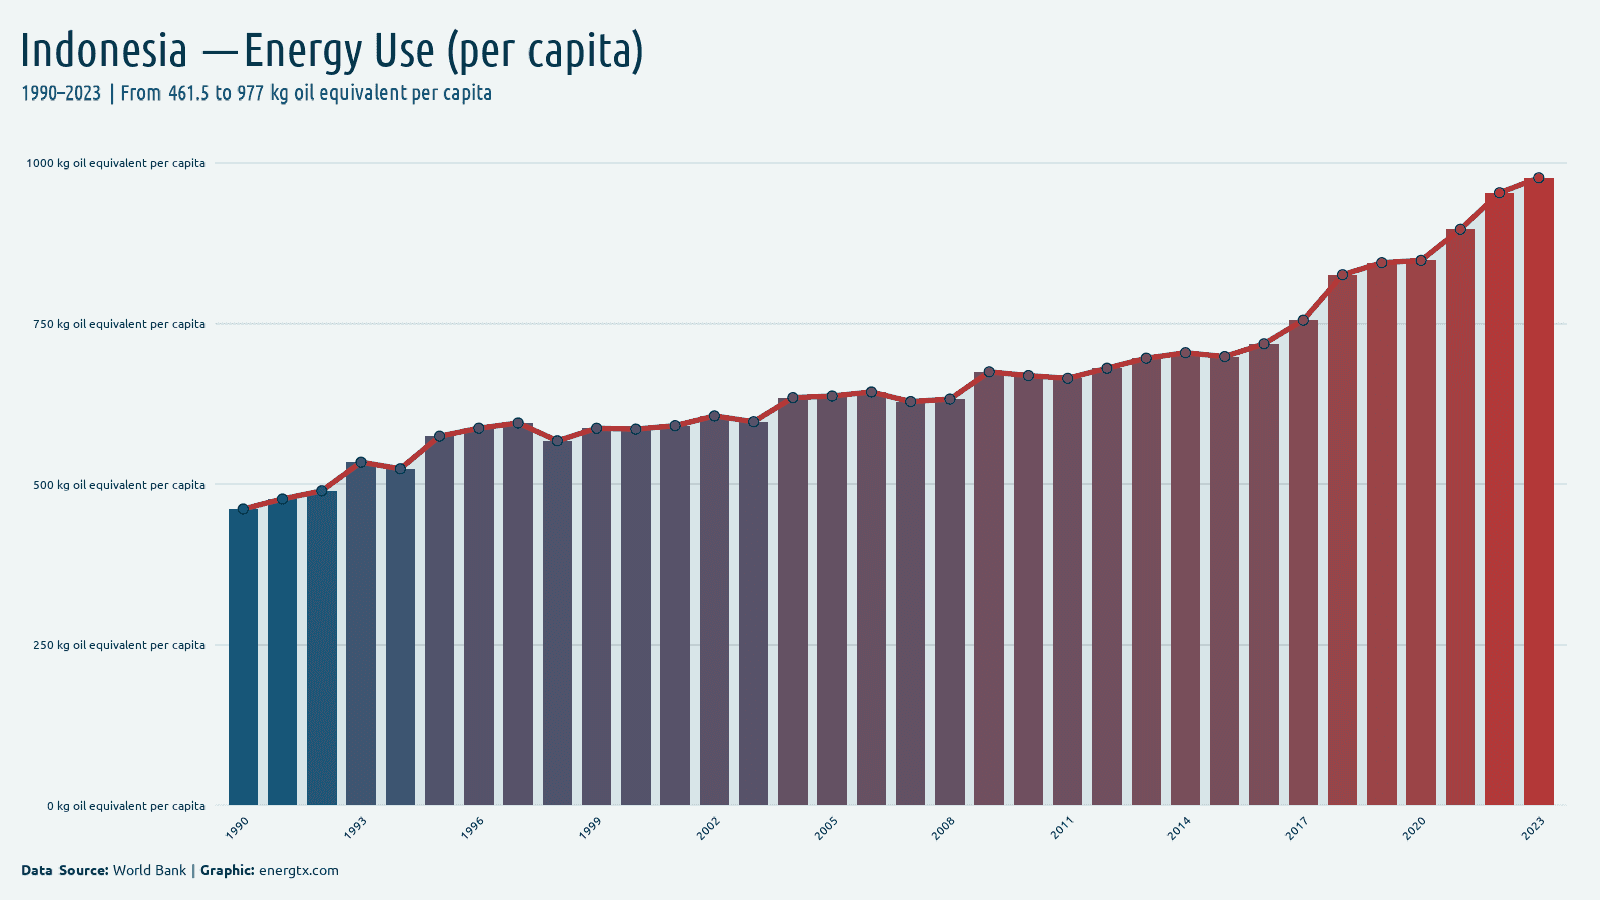
2023
Energy Use (per capita)
977.0
kg oil eq./capita
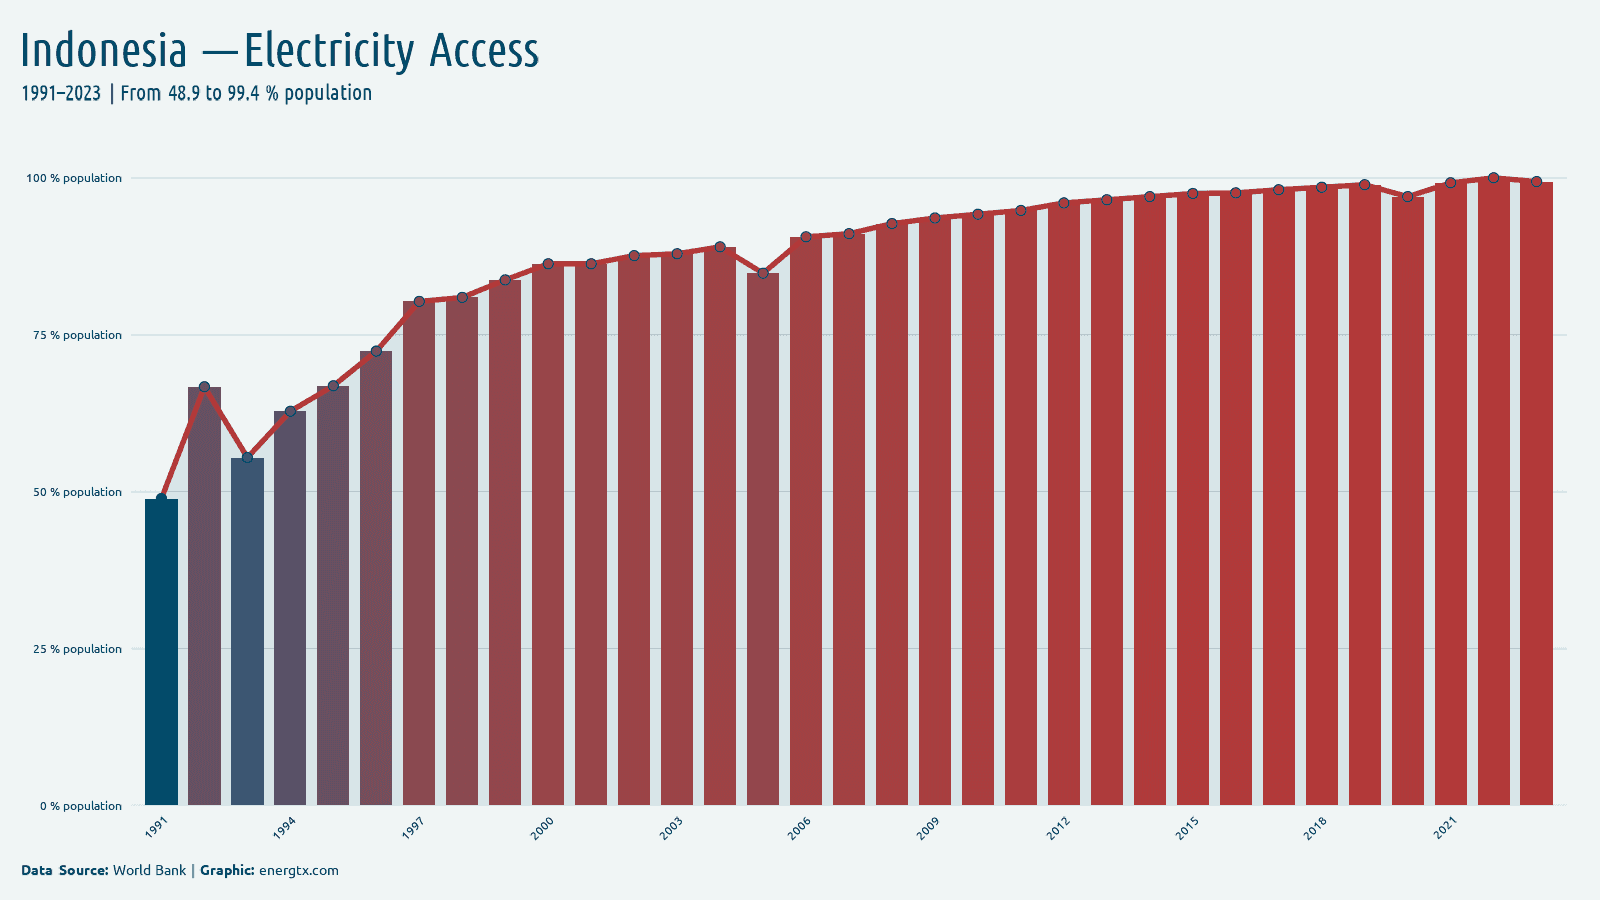
2023
Electricity Access
99.4%
%
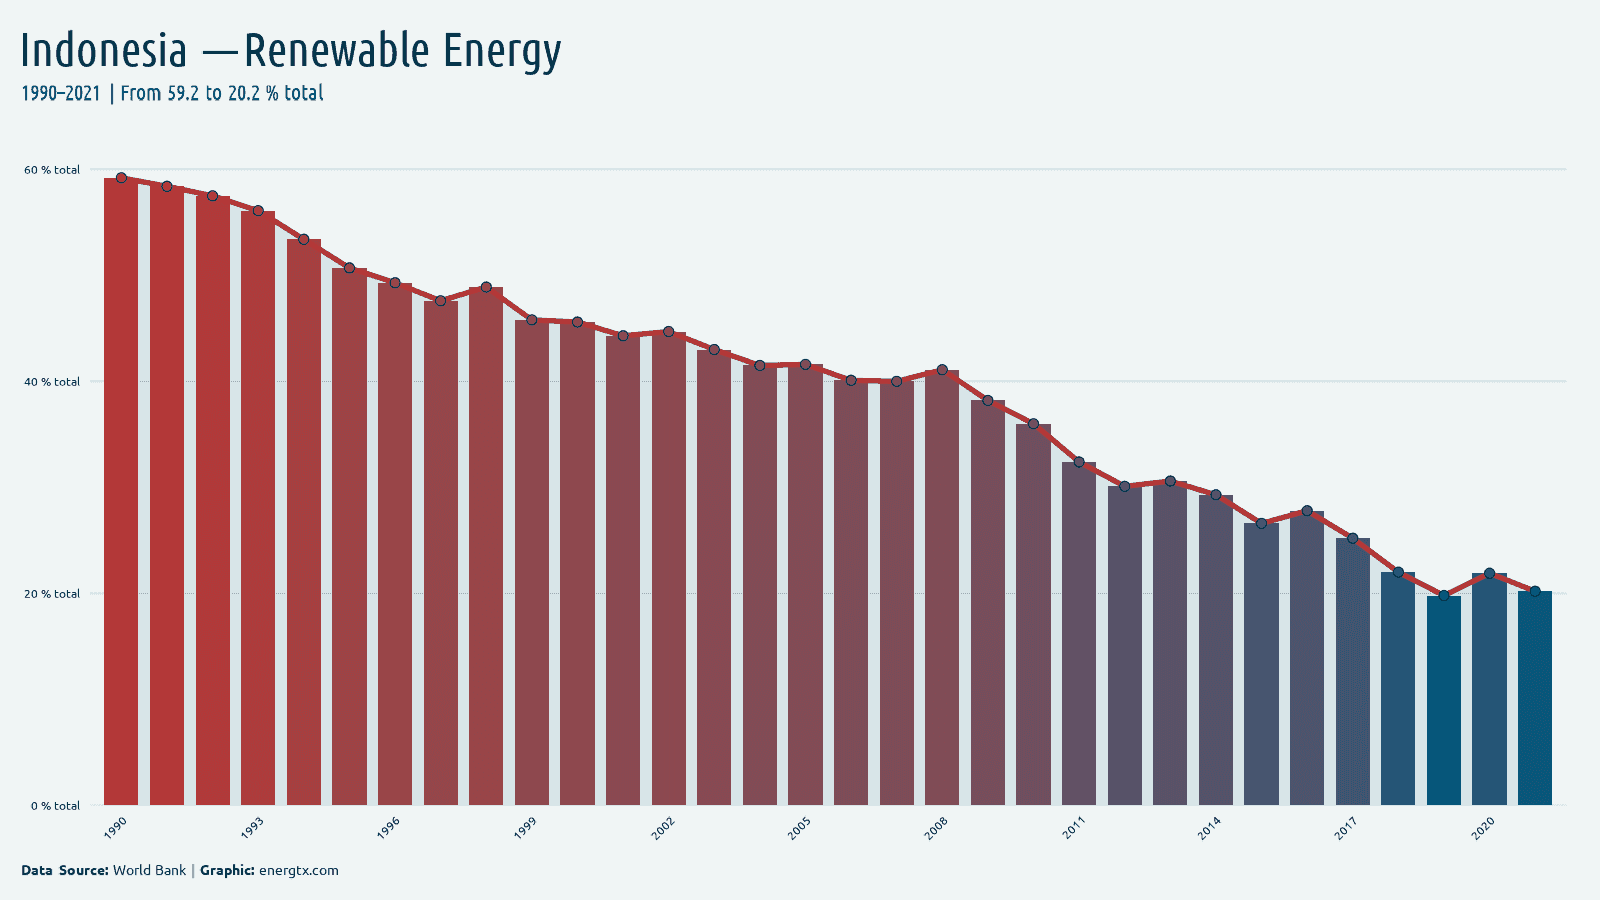
2021
Renewable Energy
20.2%
%
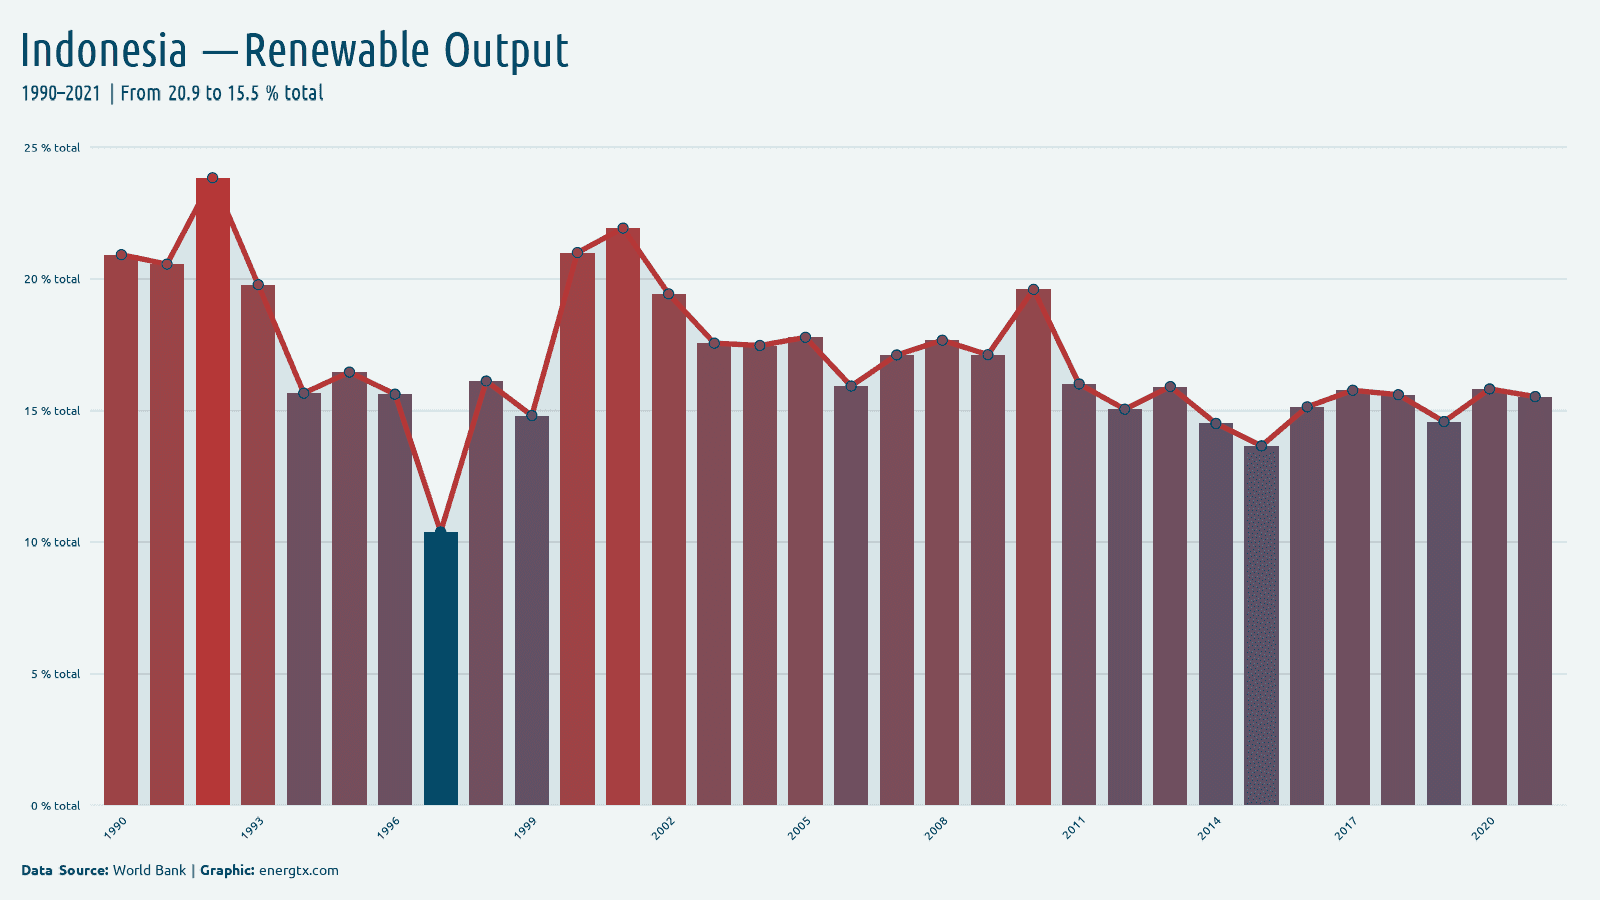
2021
Renewable Output
15.5%
%
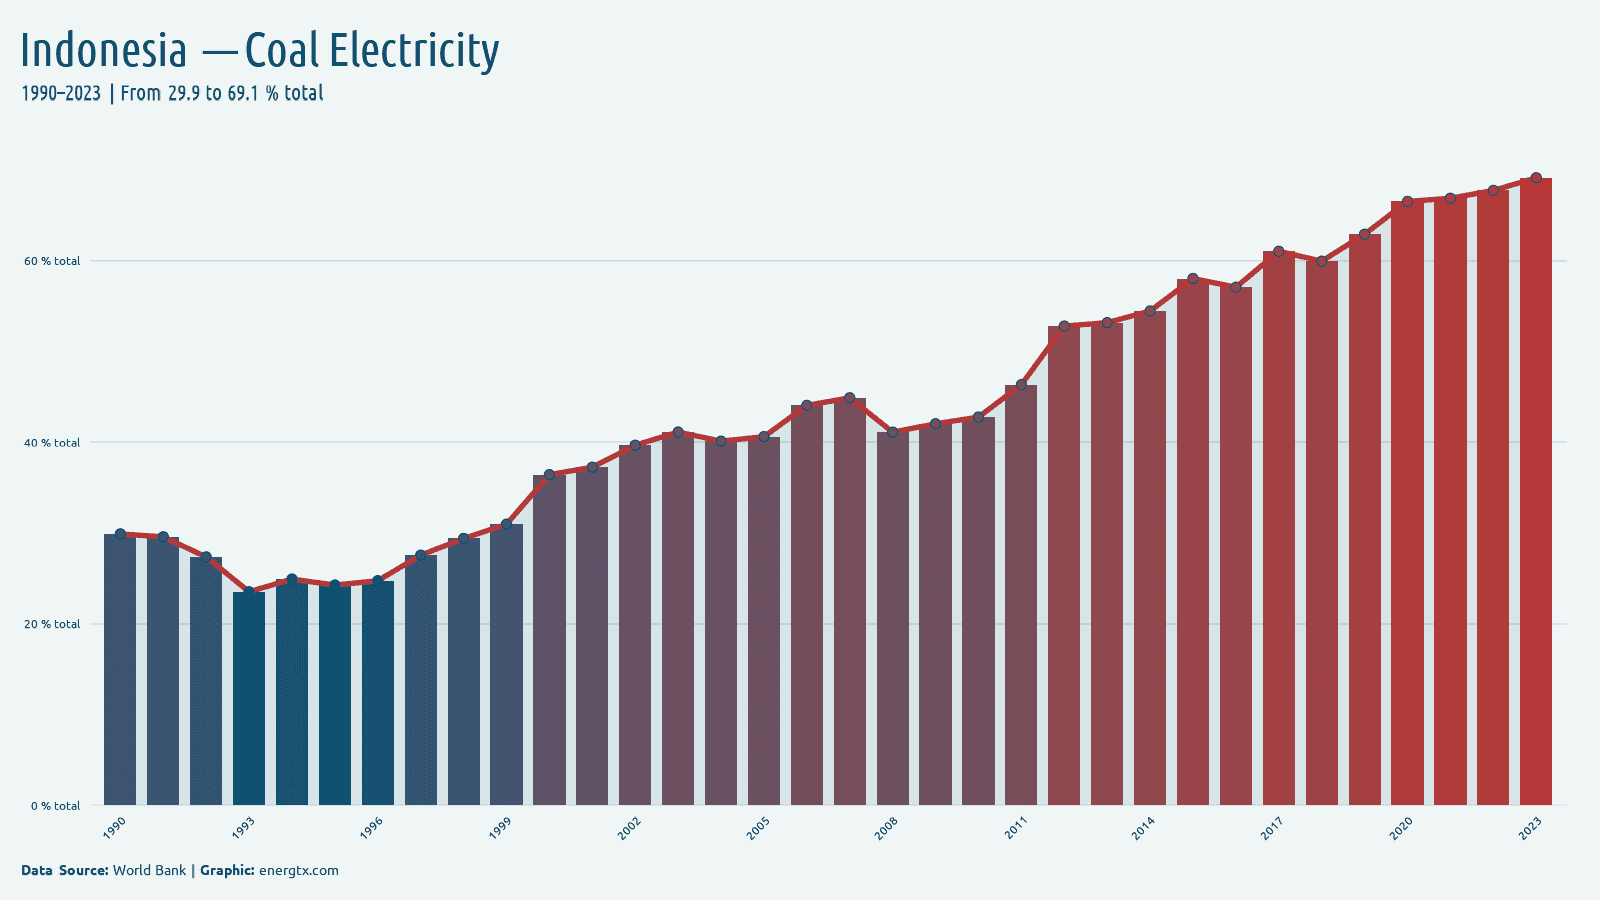
2023
Coal Electricity
69.1%
%
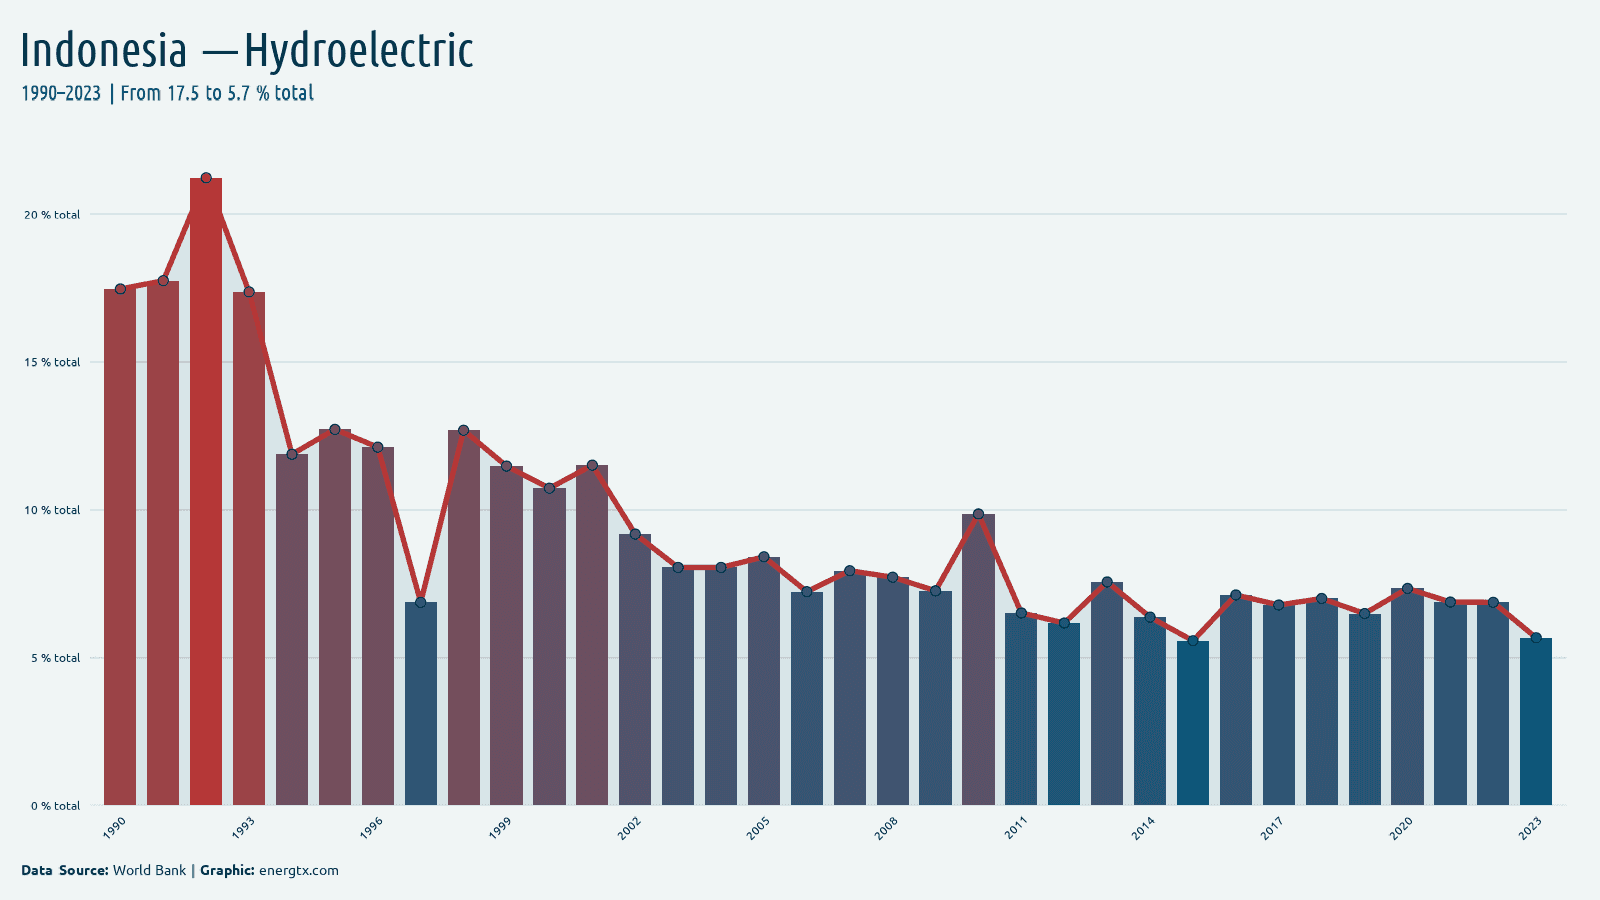
2023
Hydroelectric
5.7%
%
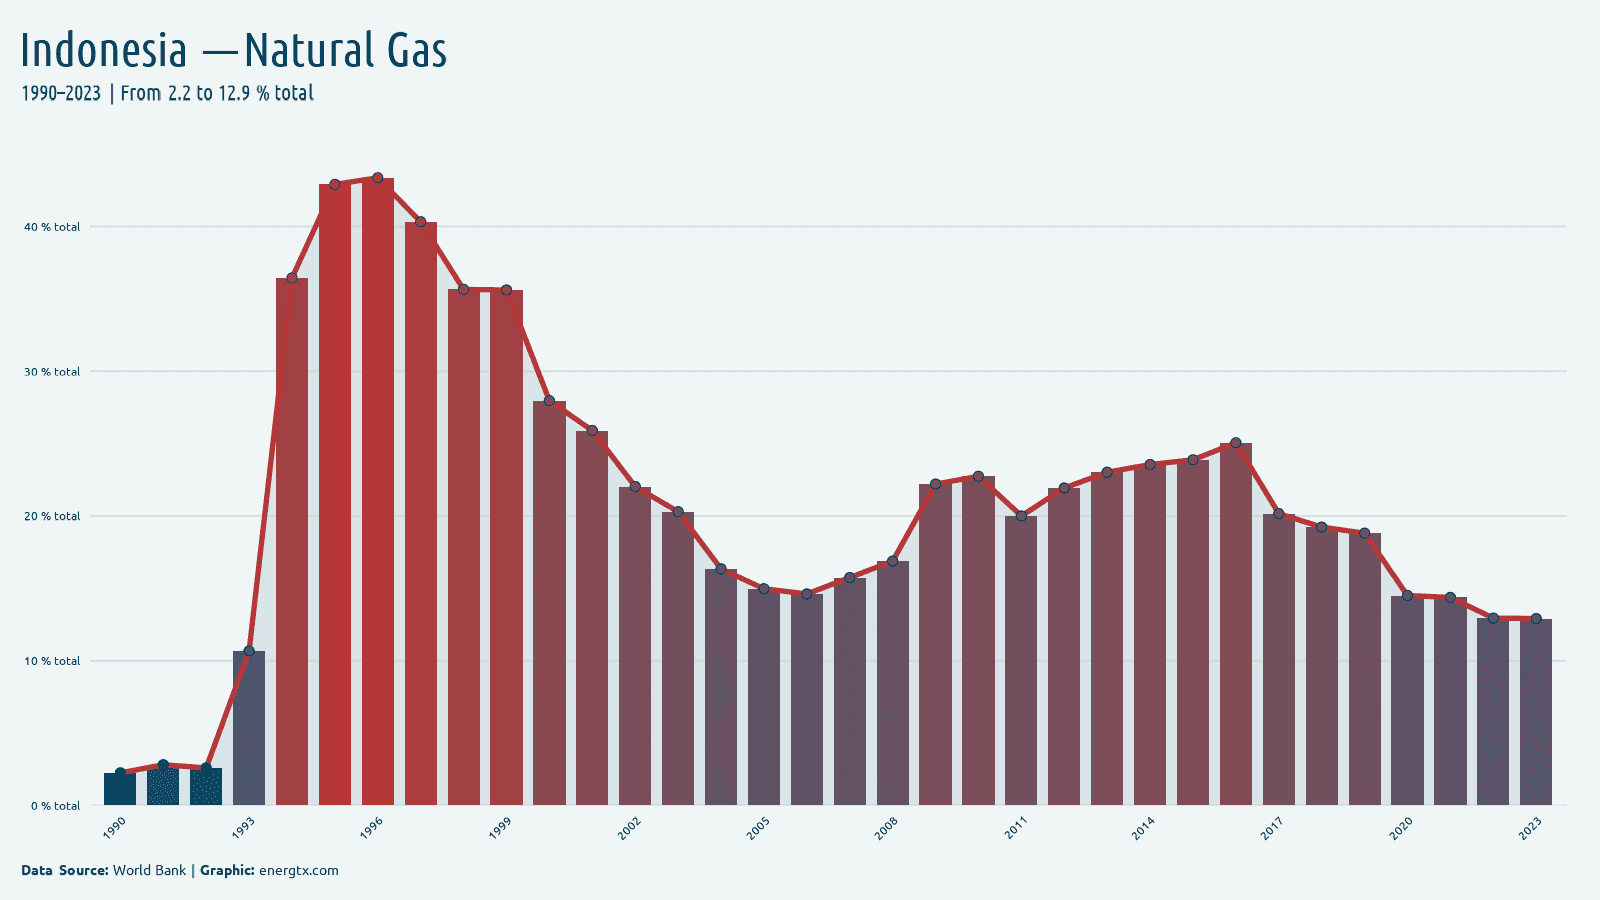
2023
Natural Gas
12.9%
%
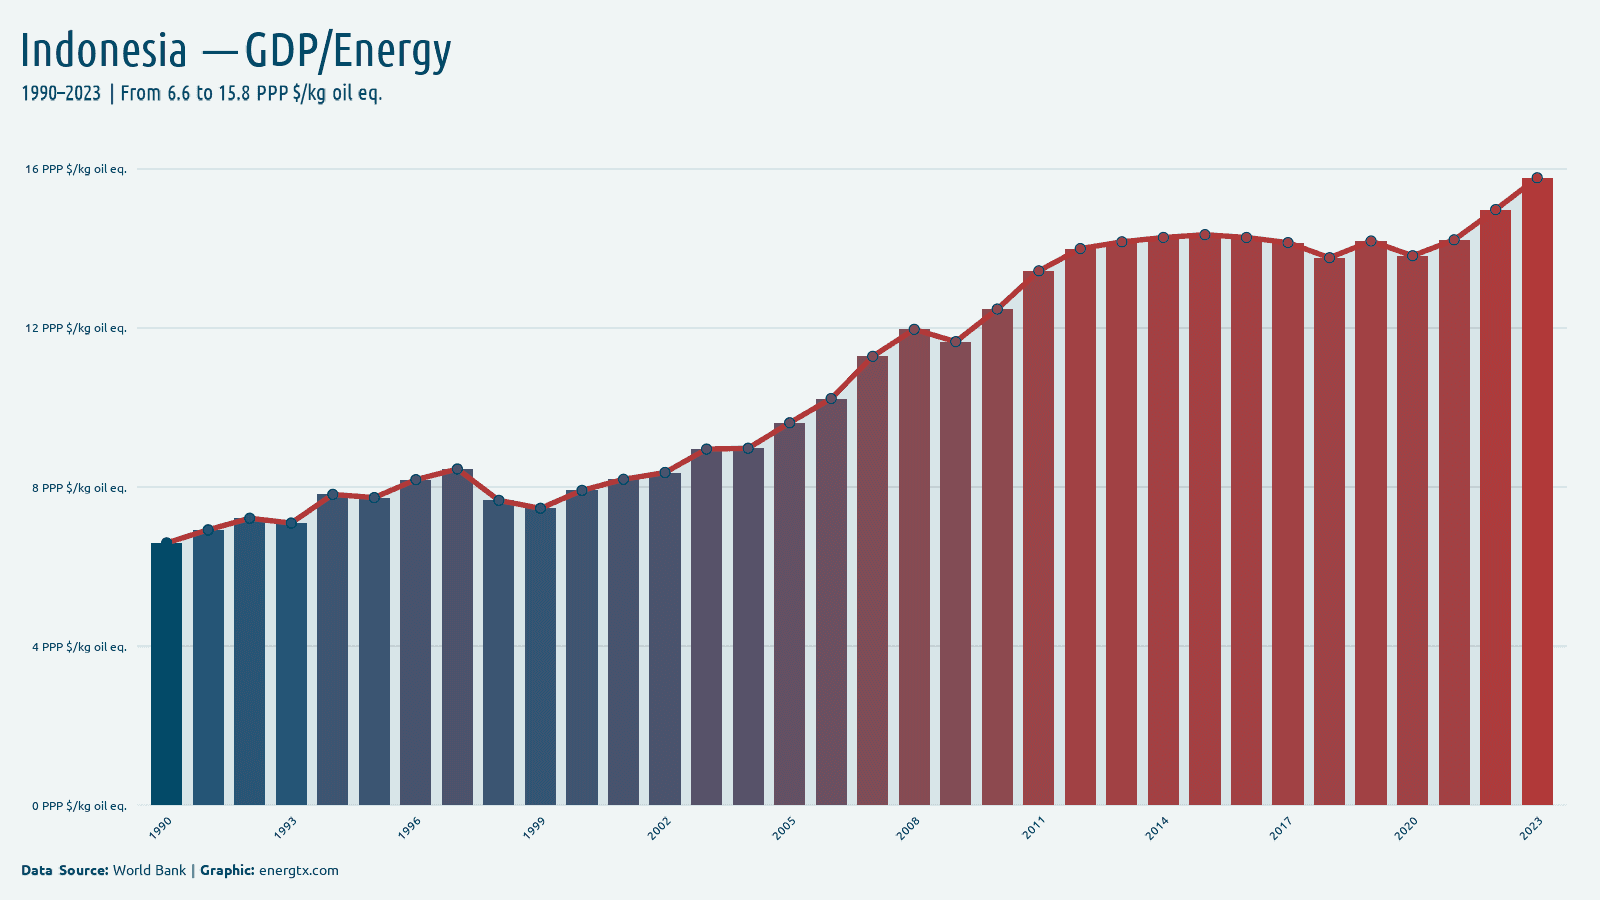
2023
GDP/Energy
15.8
PPP $/kg oil eq.
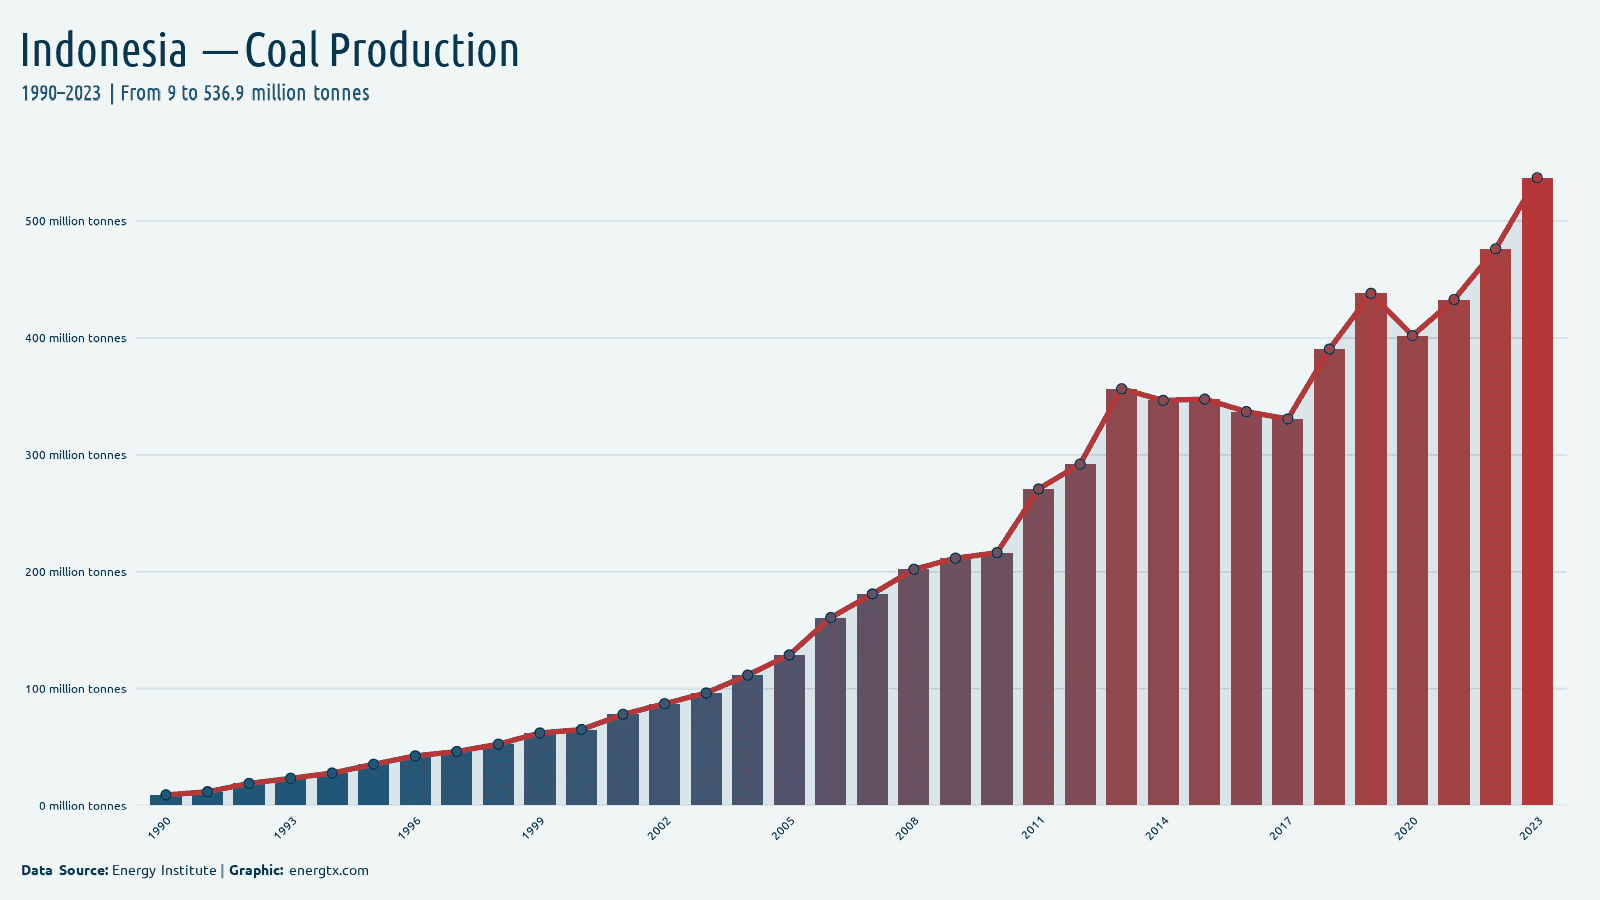
2023
Coal Production
536.9
Mt
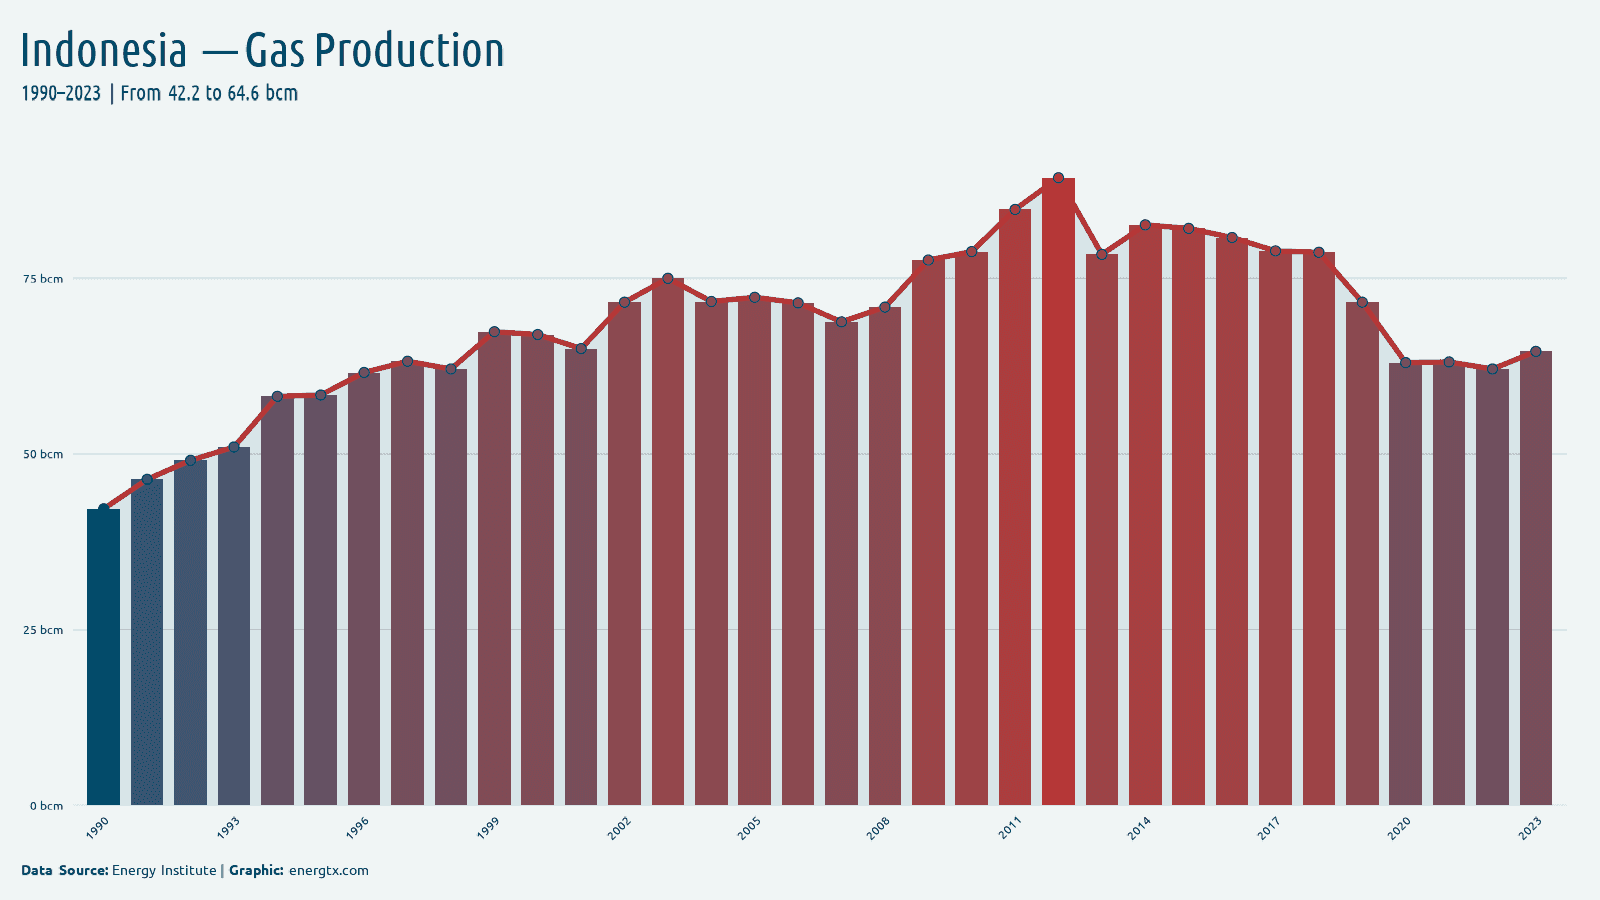
2023
Gas Production
64.6
bcm
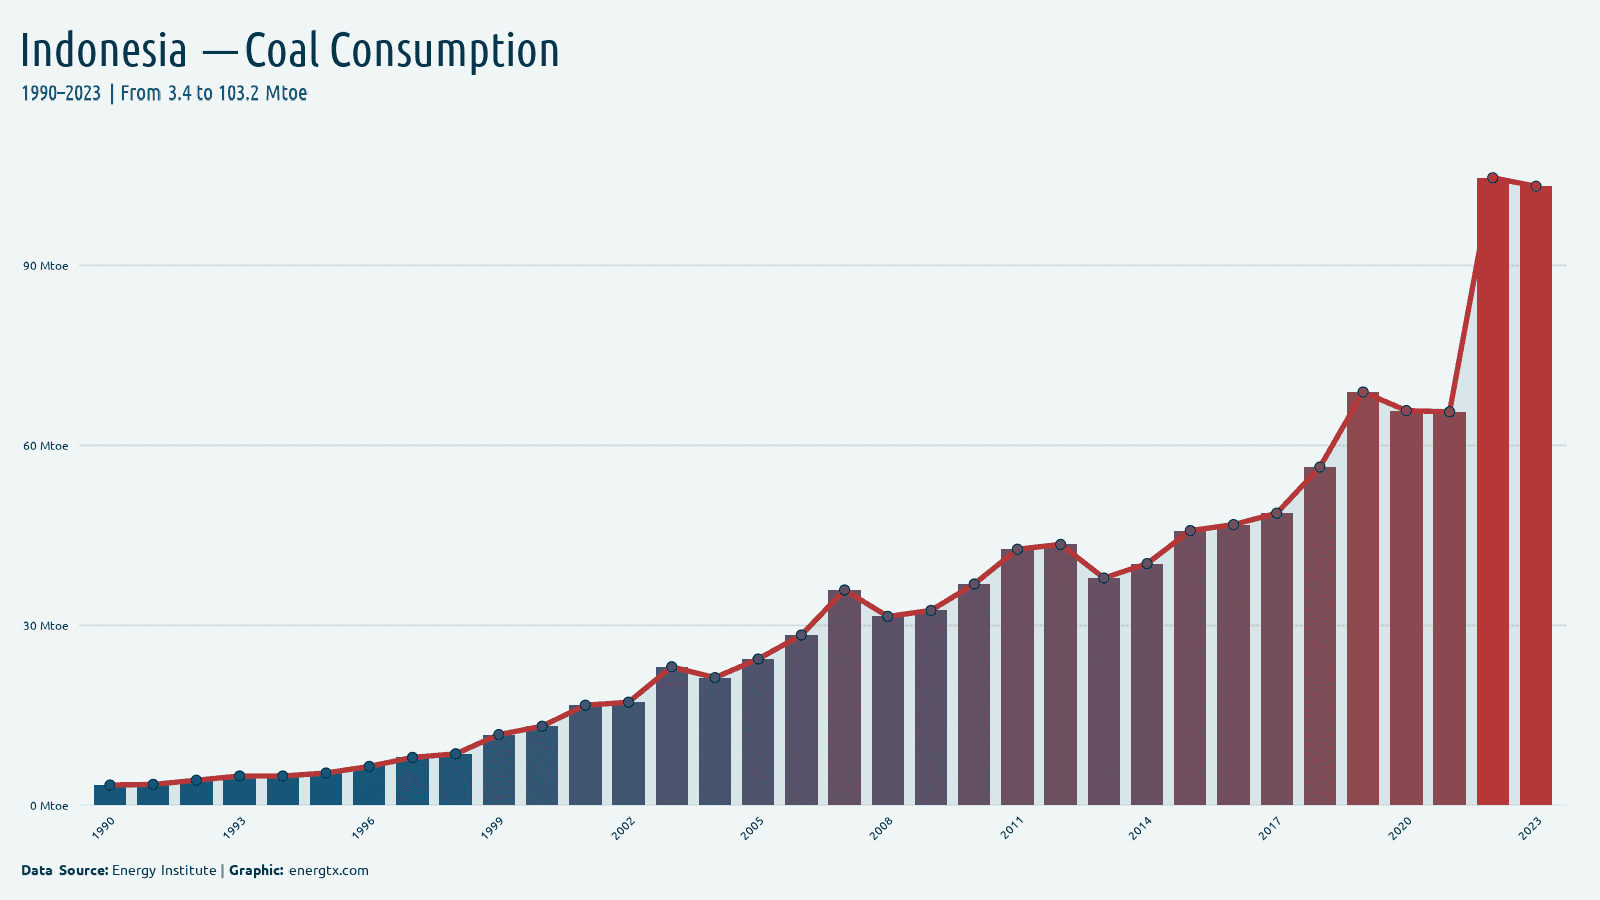
2023
Coal Consumption
103.2
Mtoe
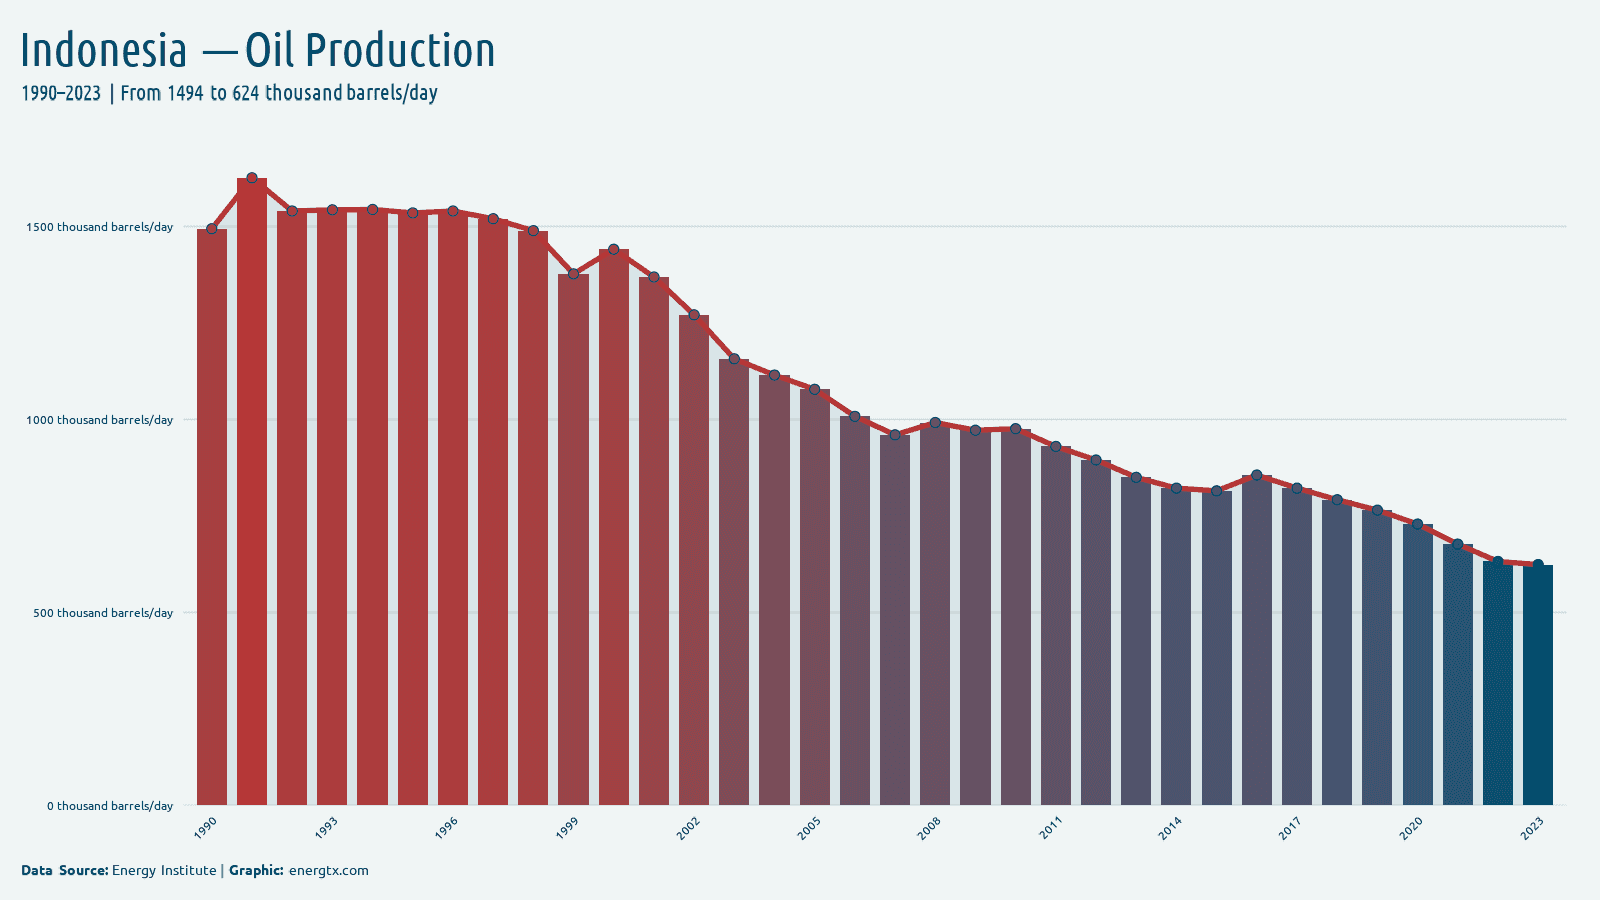
2023
Oil Production
624.0
k barrels/day
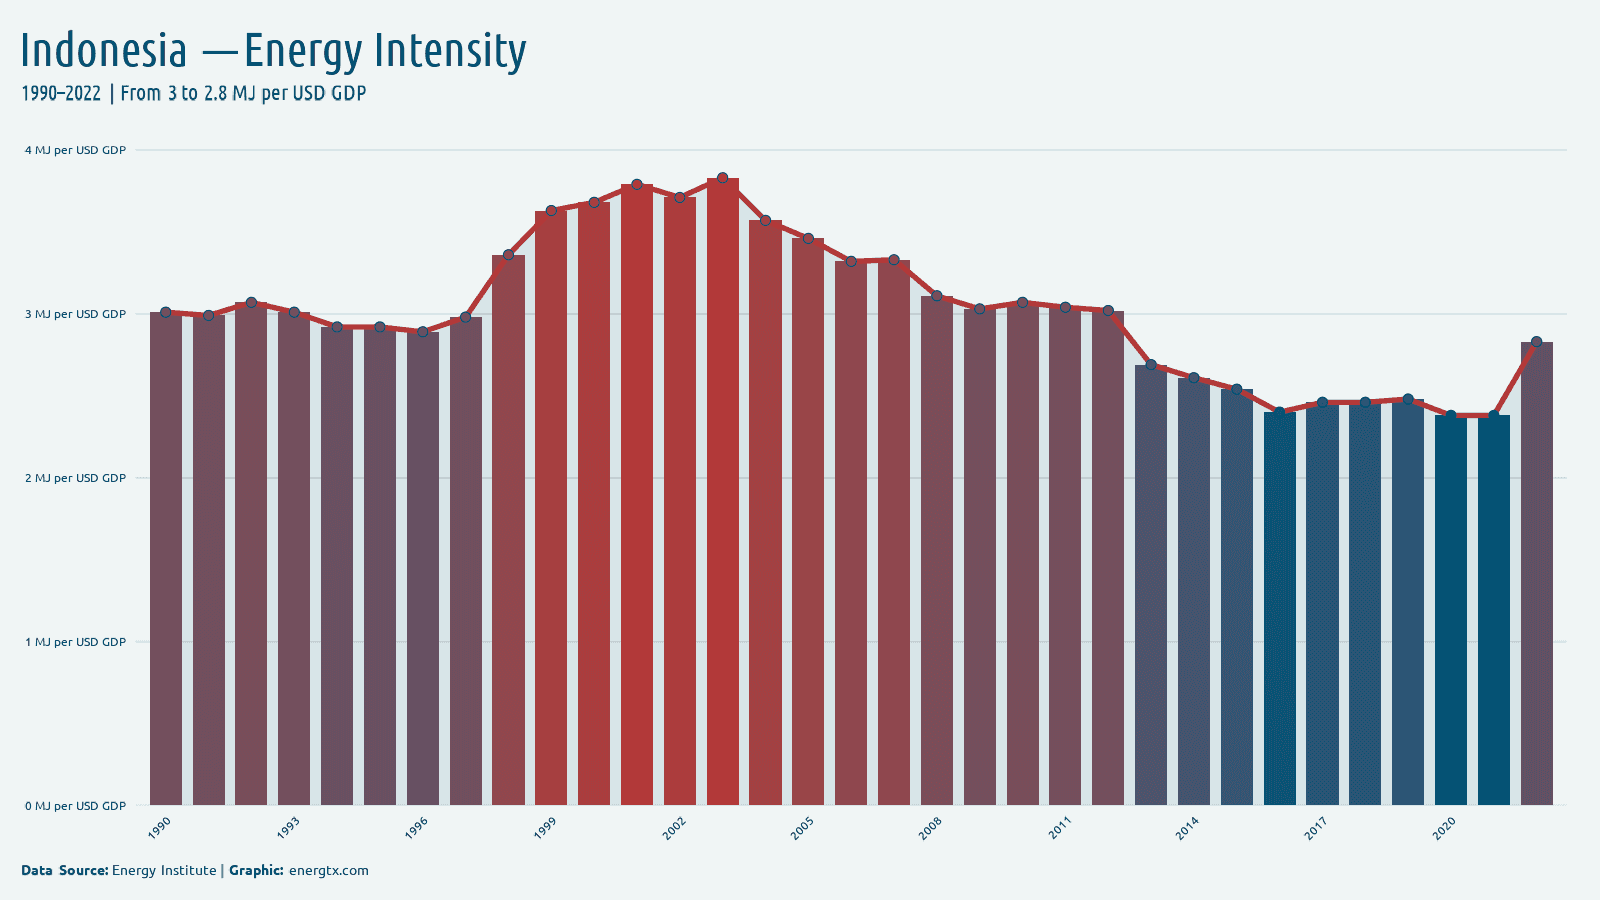
2022
Energy Intensity
2.8
MJ/$ GDP
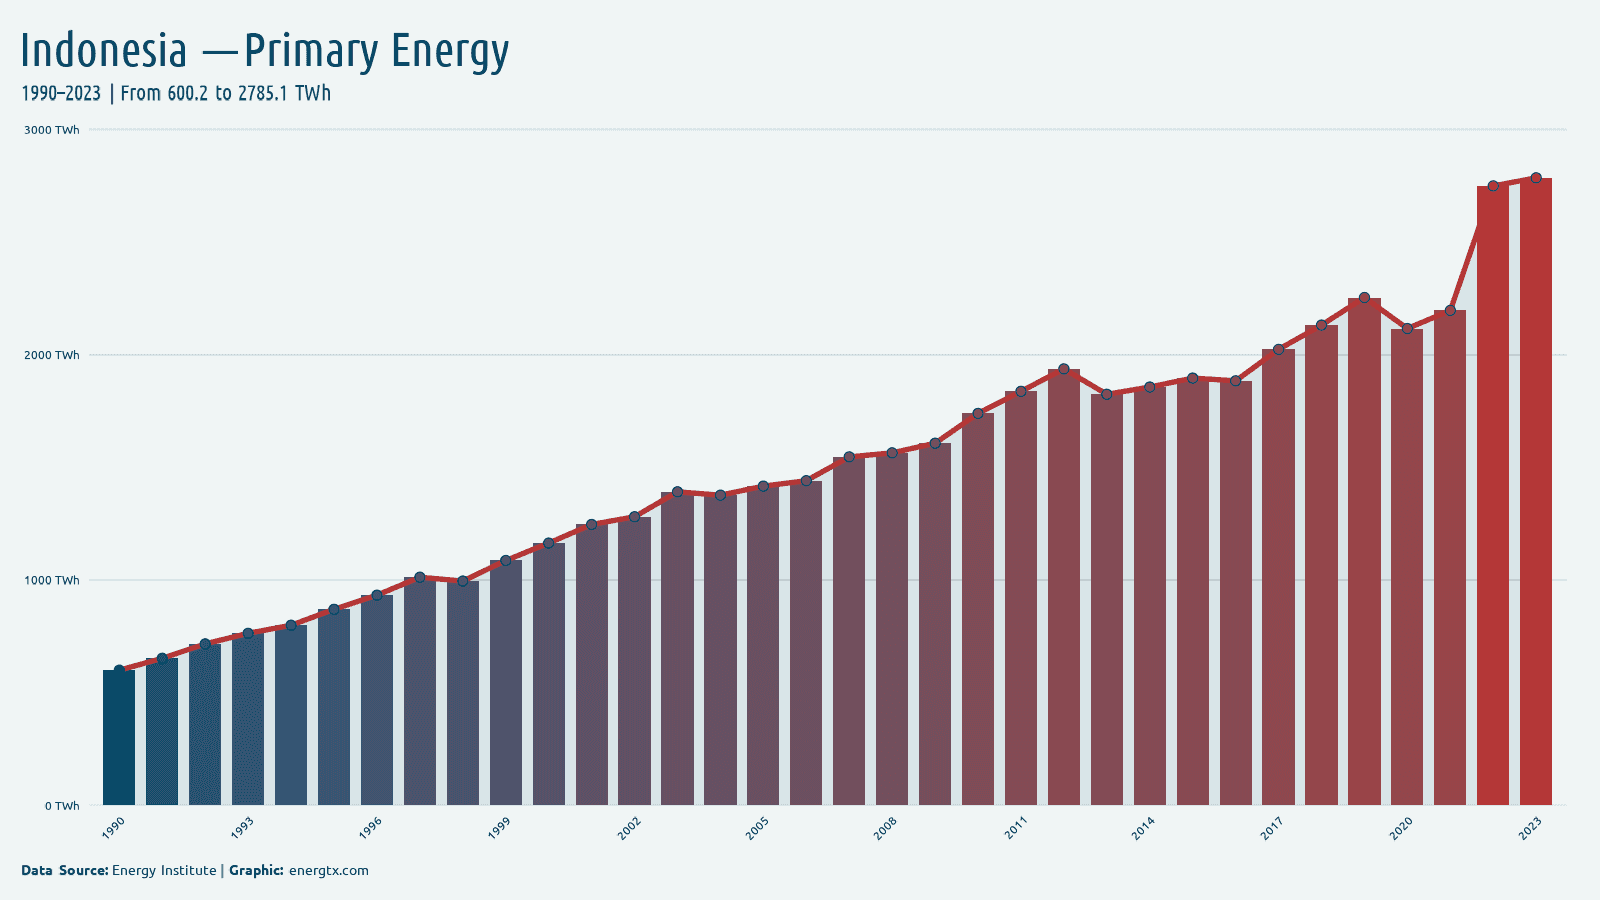
2023
Primary Energy
2.8k
TWh
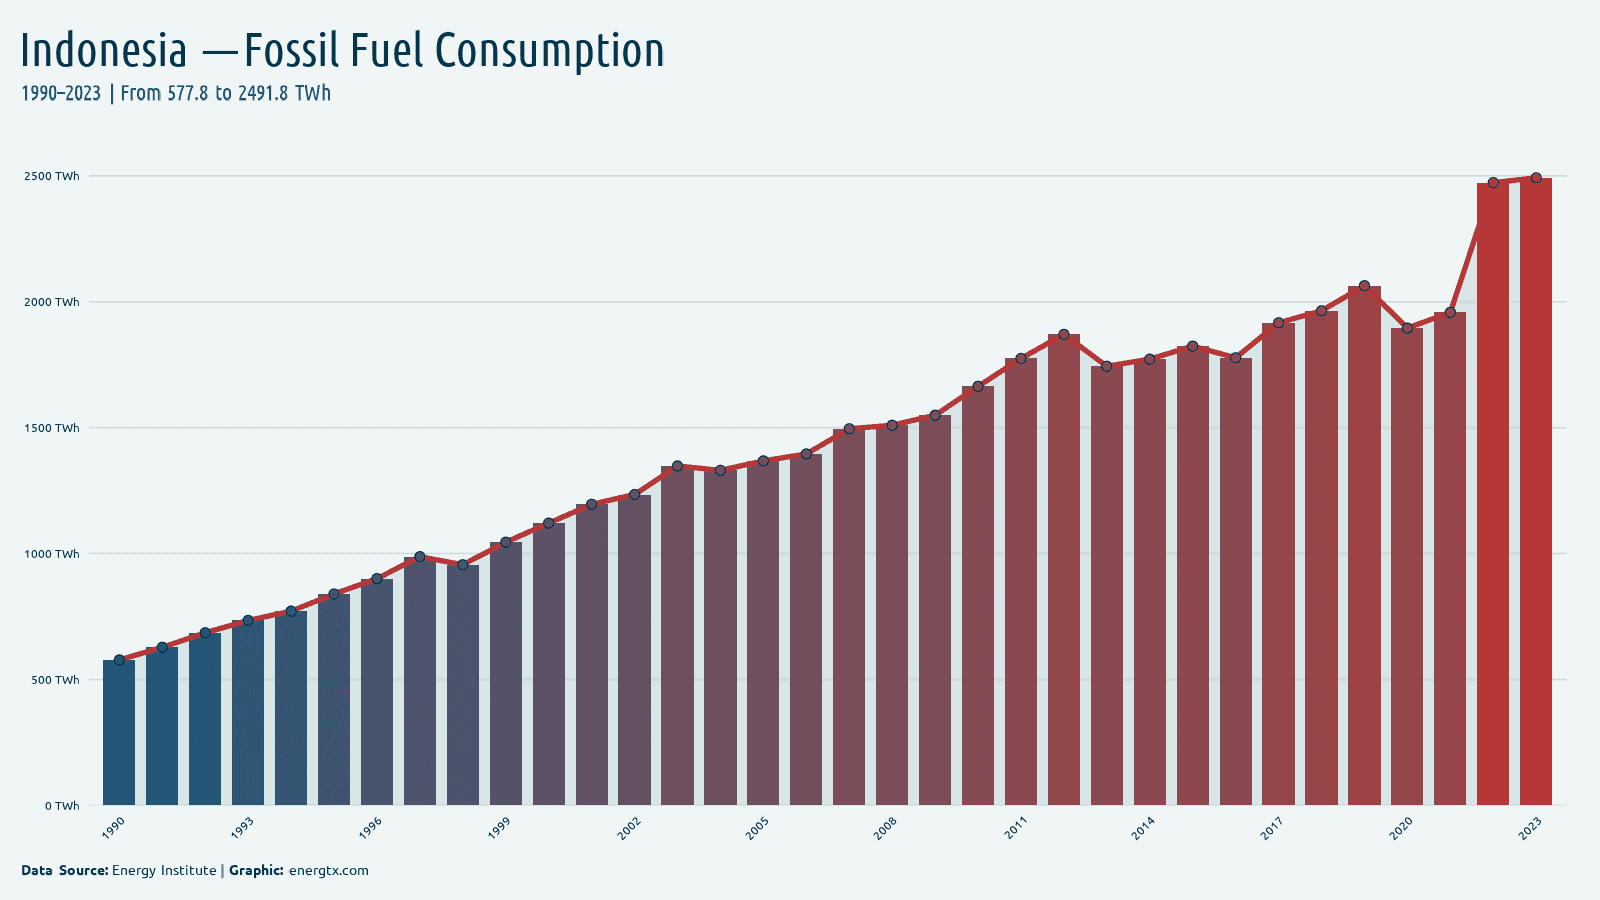
2023
Fossil Fuel Consumption
2.5k
TWh
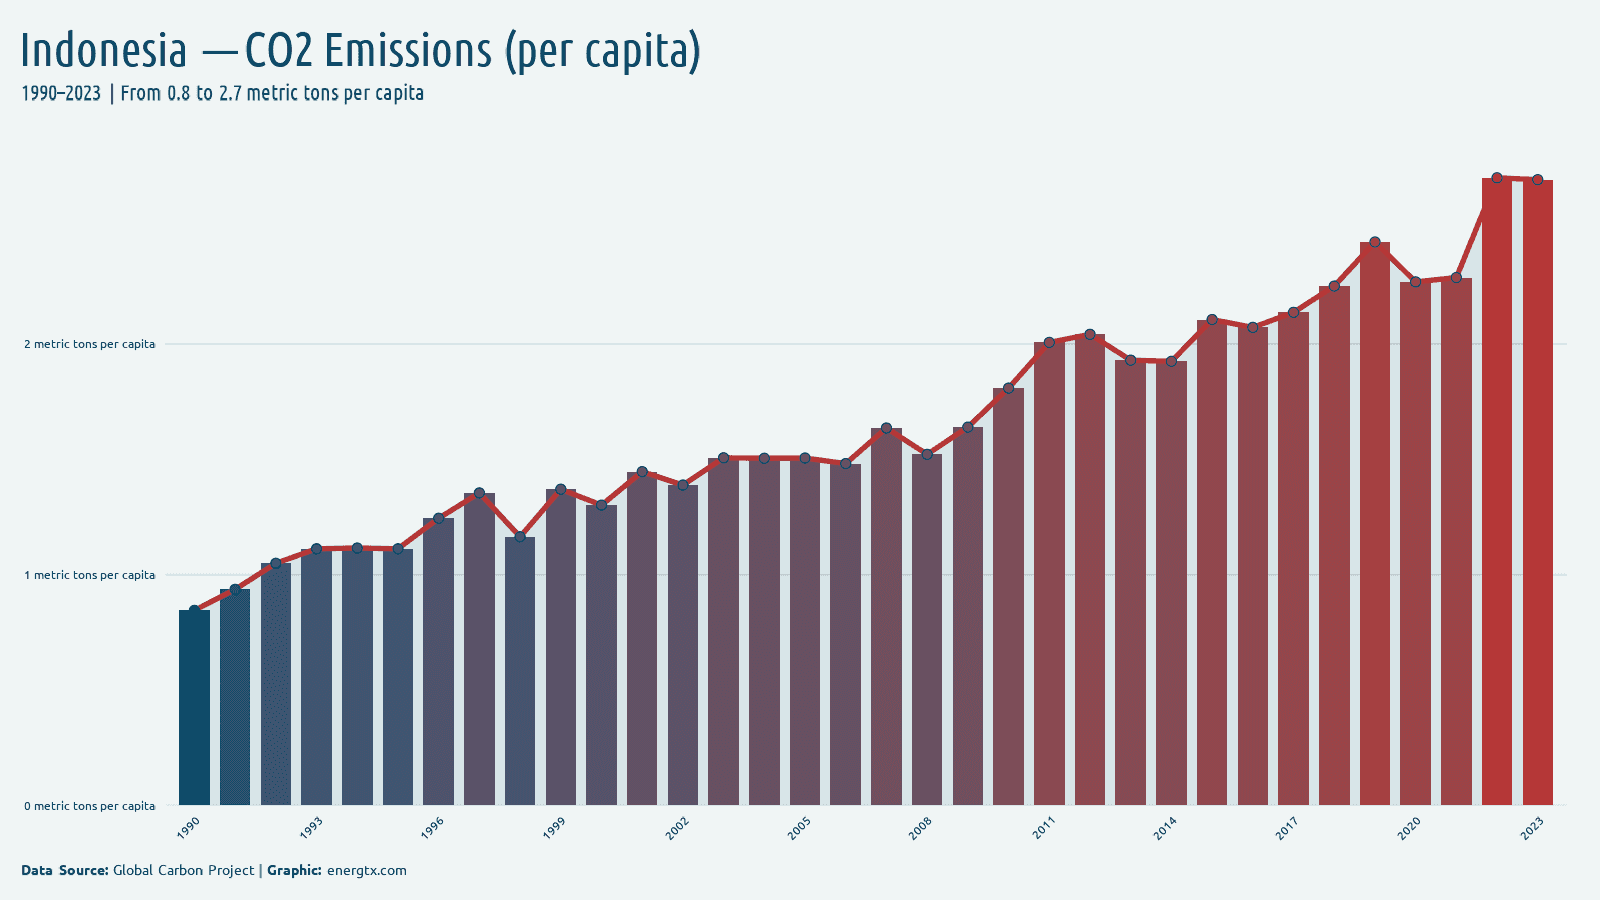
2023
CO2 Emissions (per capita)
2.7
metric tons/capita
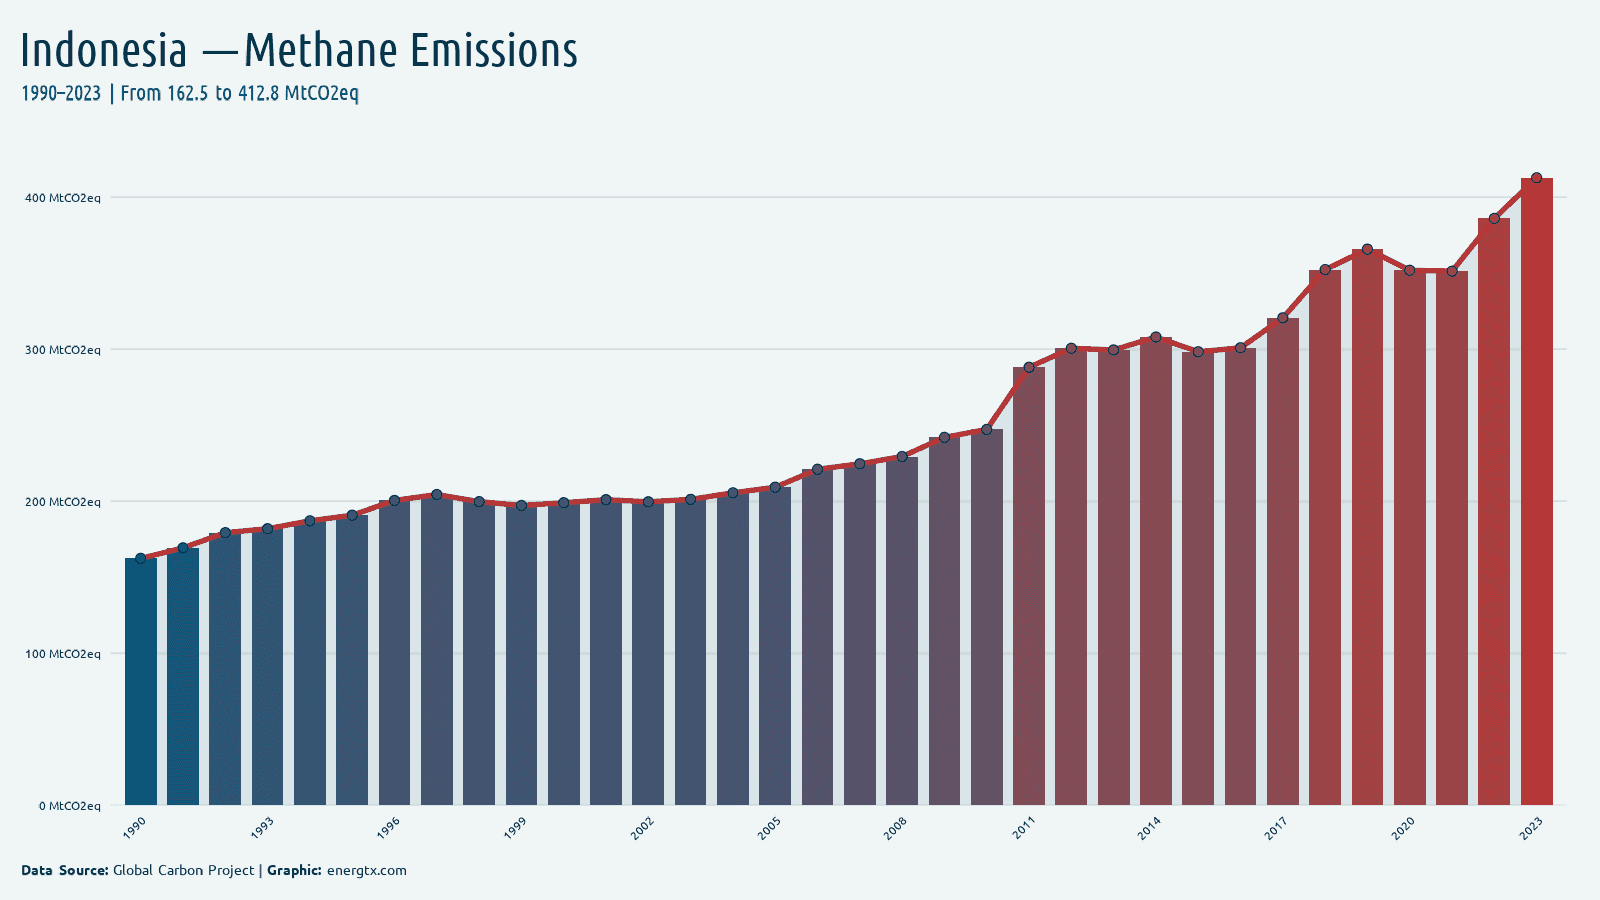
2023
Methane Emissions
412.8
MtCO2eq
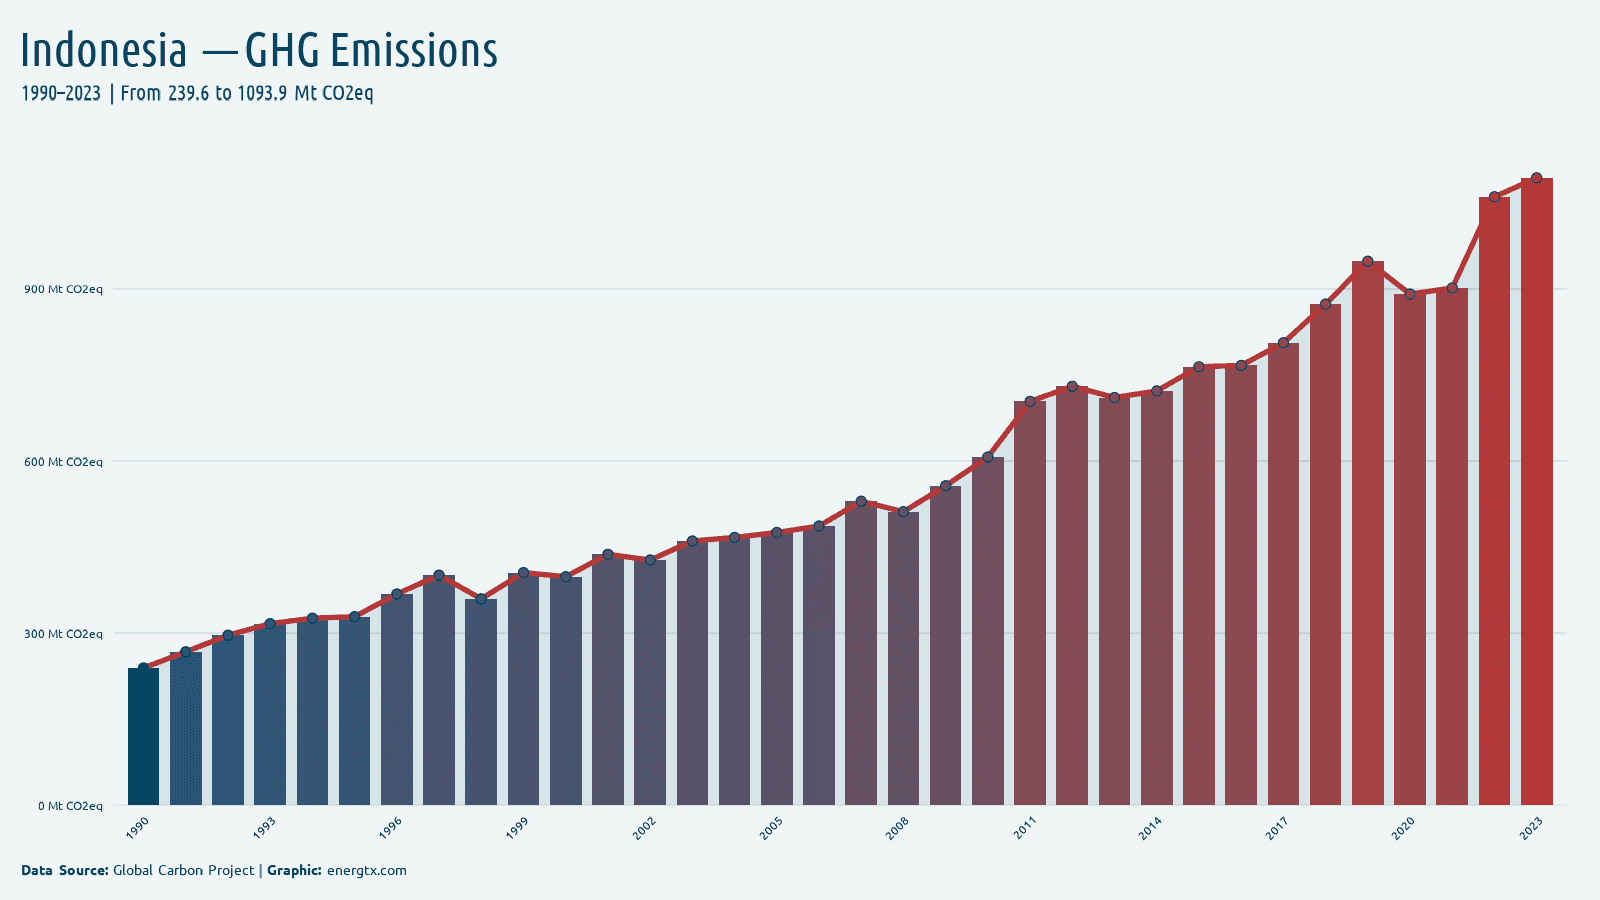
2023
GHG Emissions
1.1k
MtCO2eq
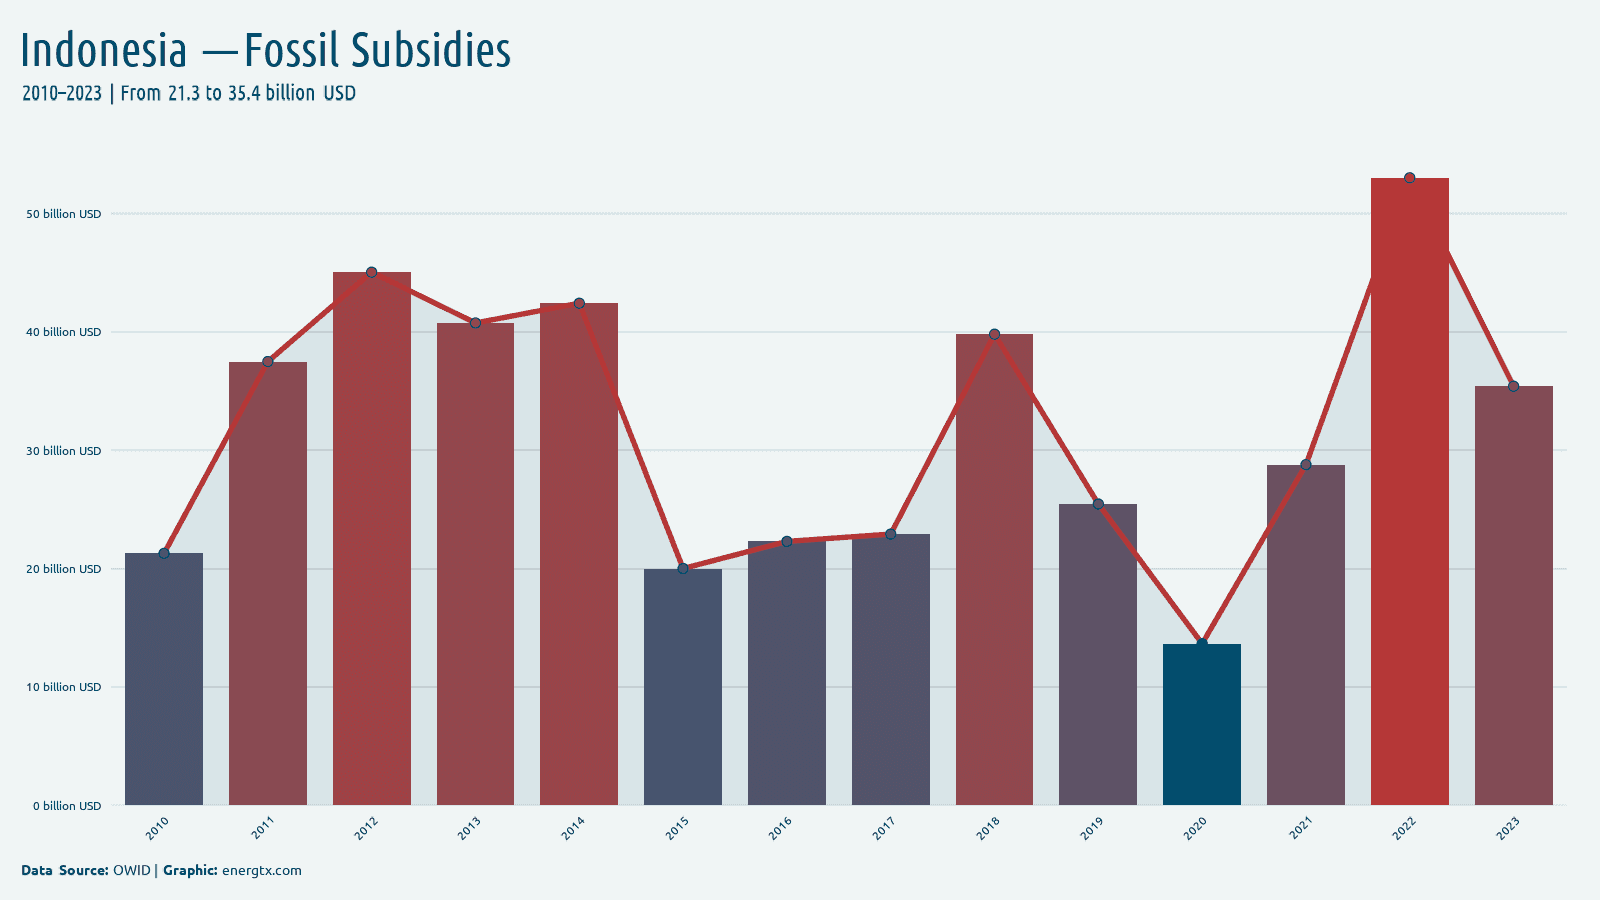
2023
Fossil Subsidies
35.4
billion $
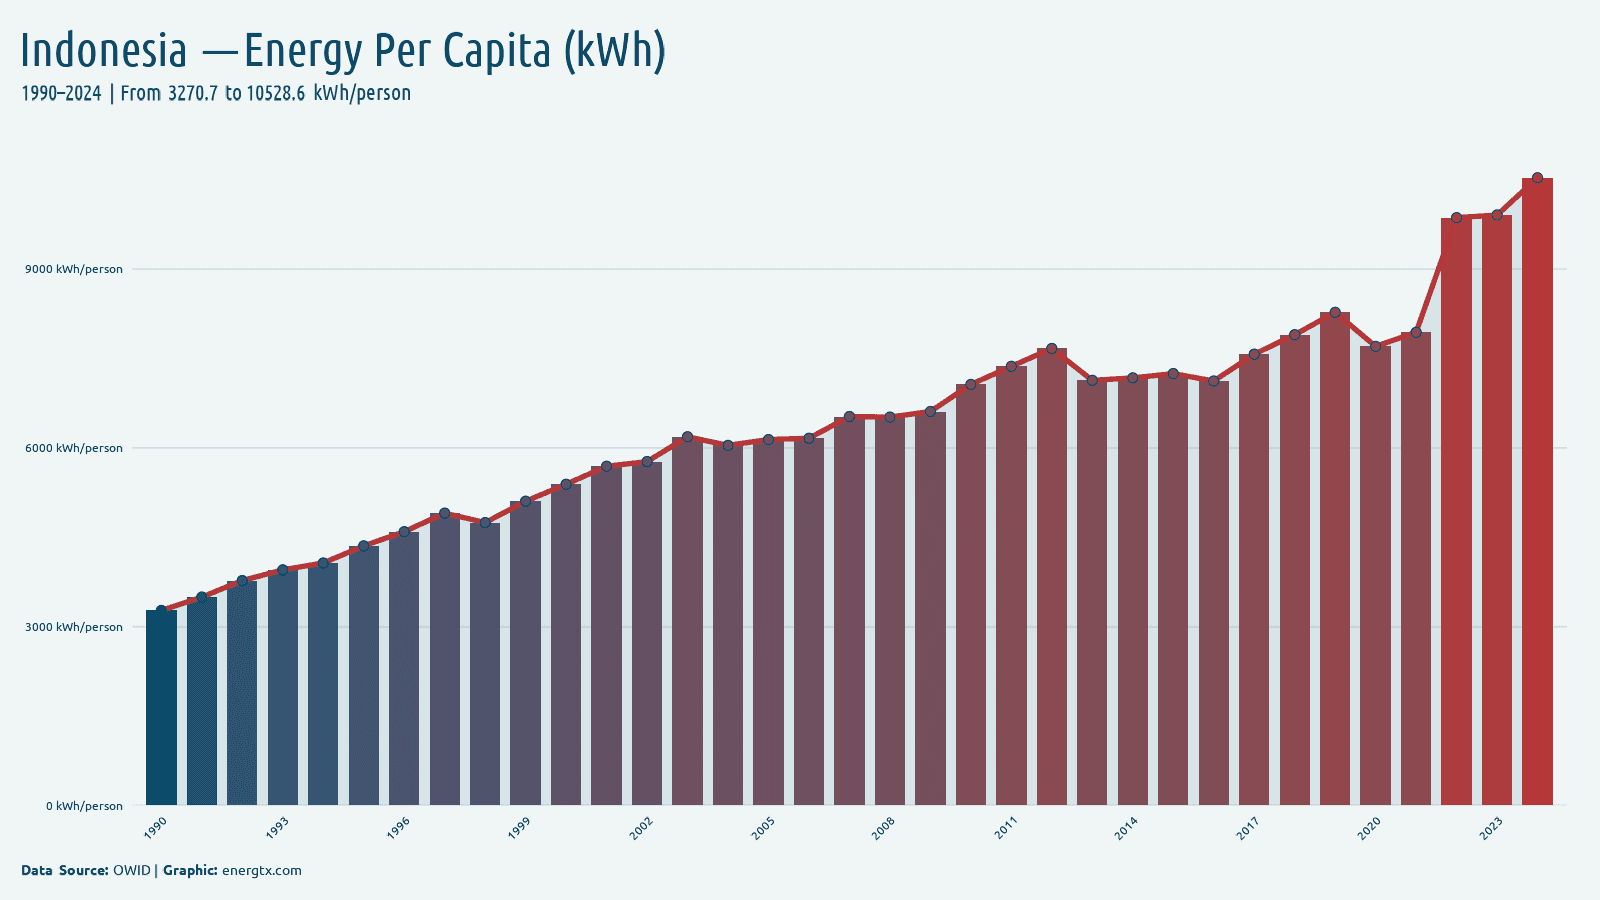
2024
Energy Use Per Capita (kWh)
10.5k
kWh/capita
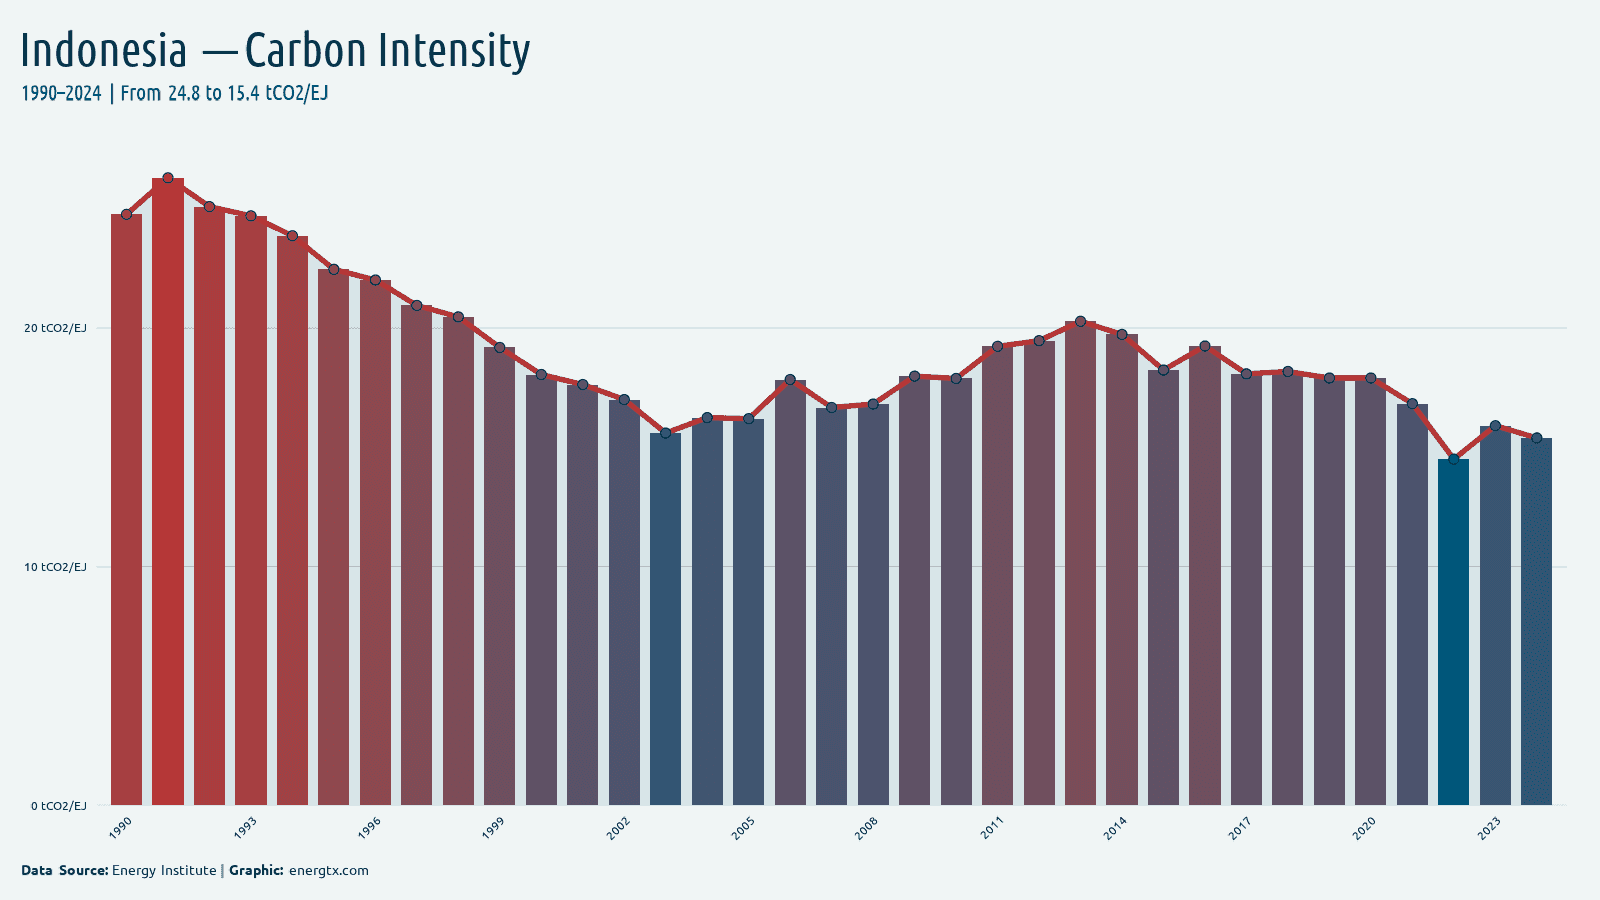
2024
Carbon Intensity
15.4
tCO2/EJ
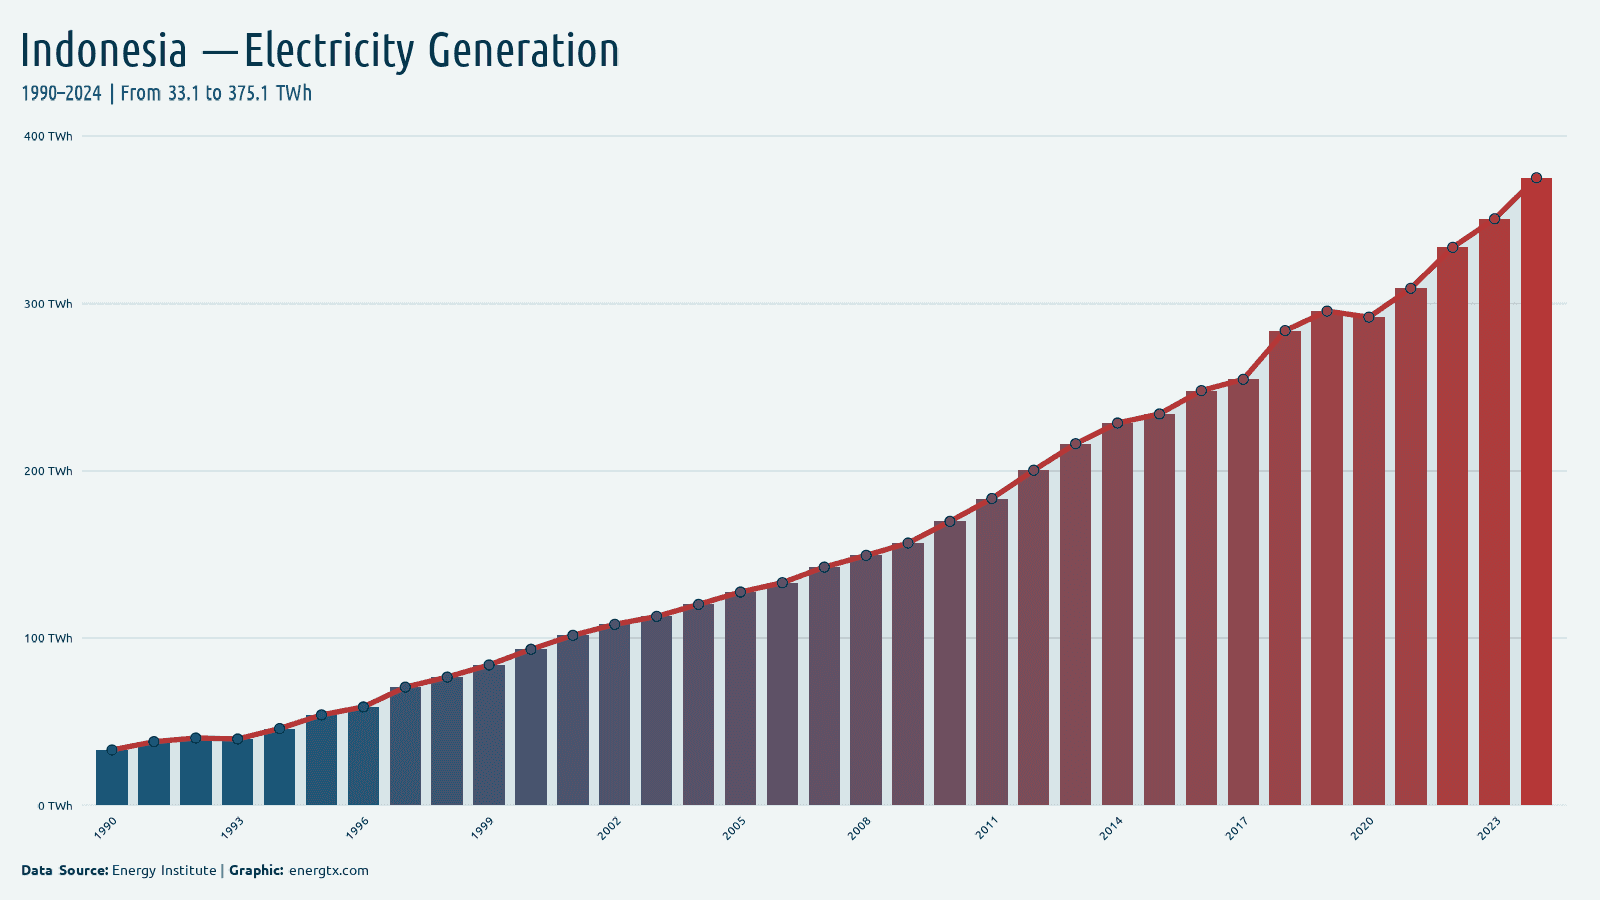
2024
Electricity Generation
375.1
TWh
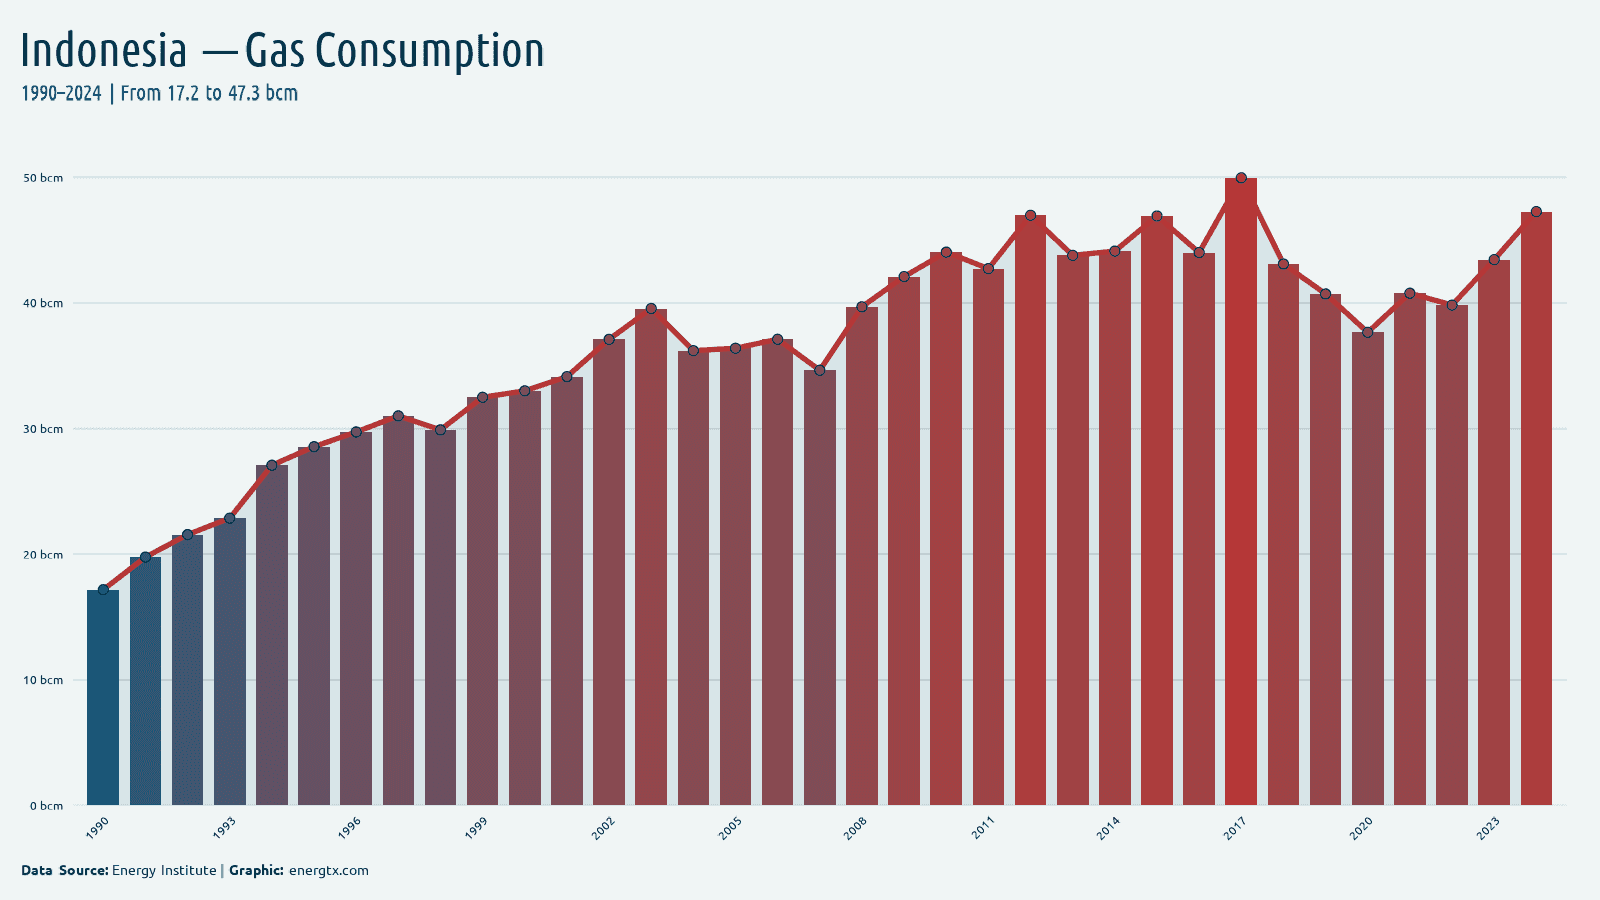
2024
Gas Consumption
47.3
bcm
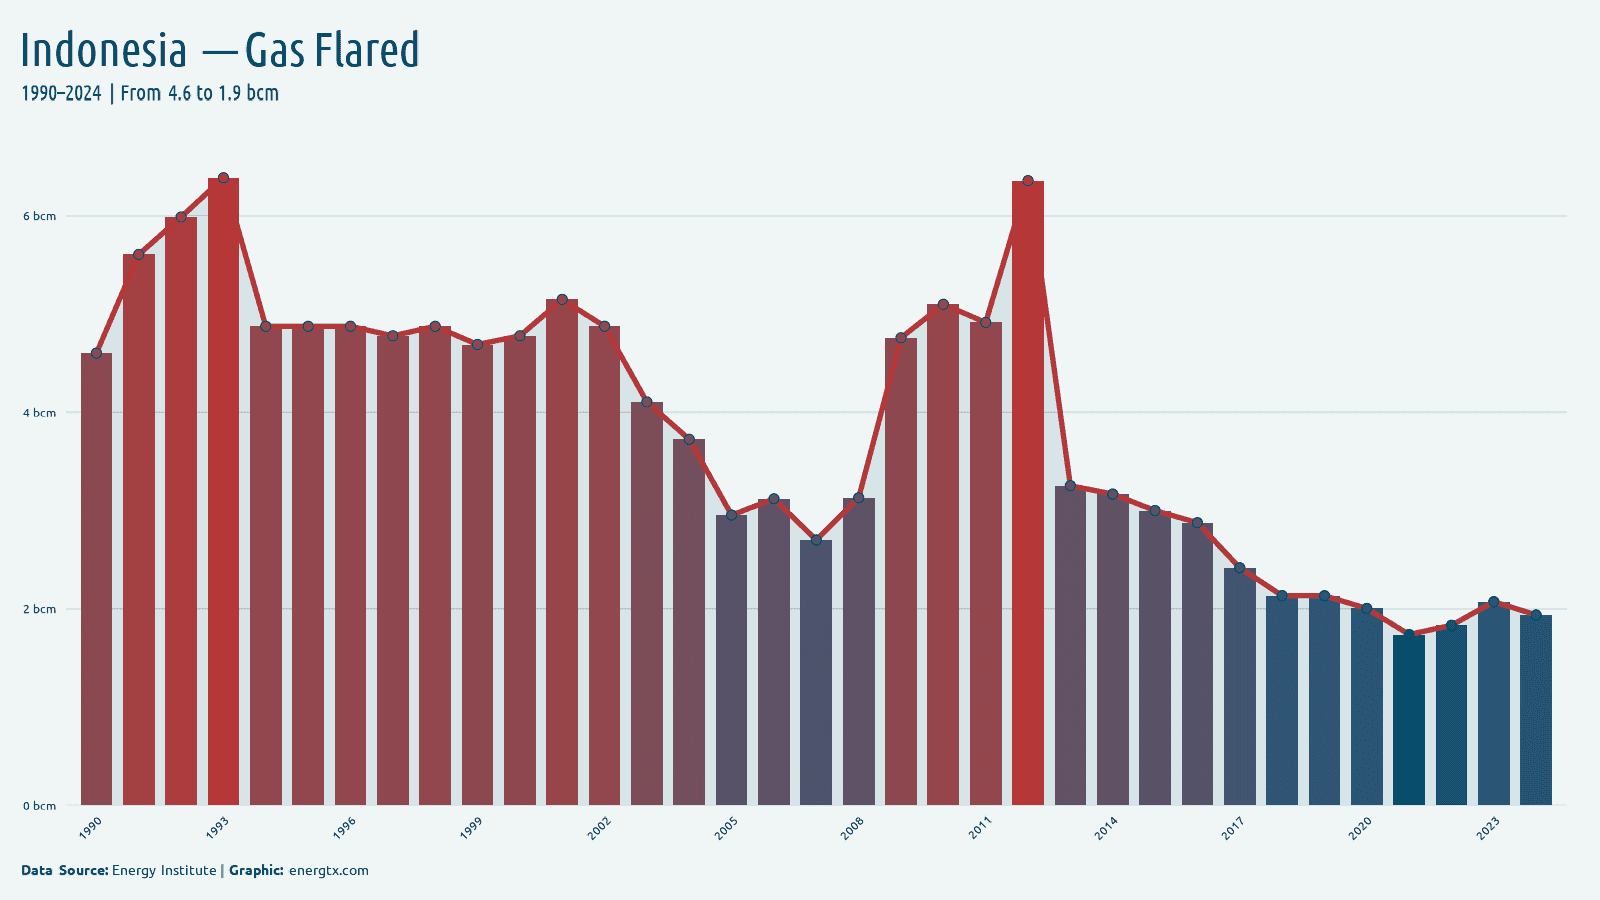
2024
Gas Flared
1.9
bcm
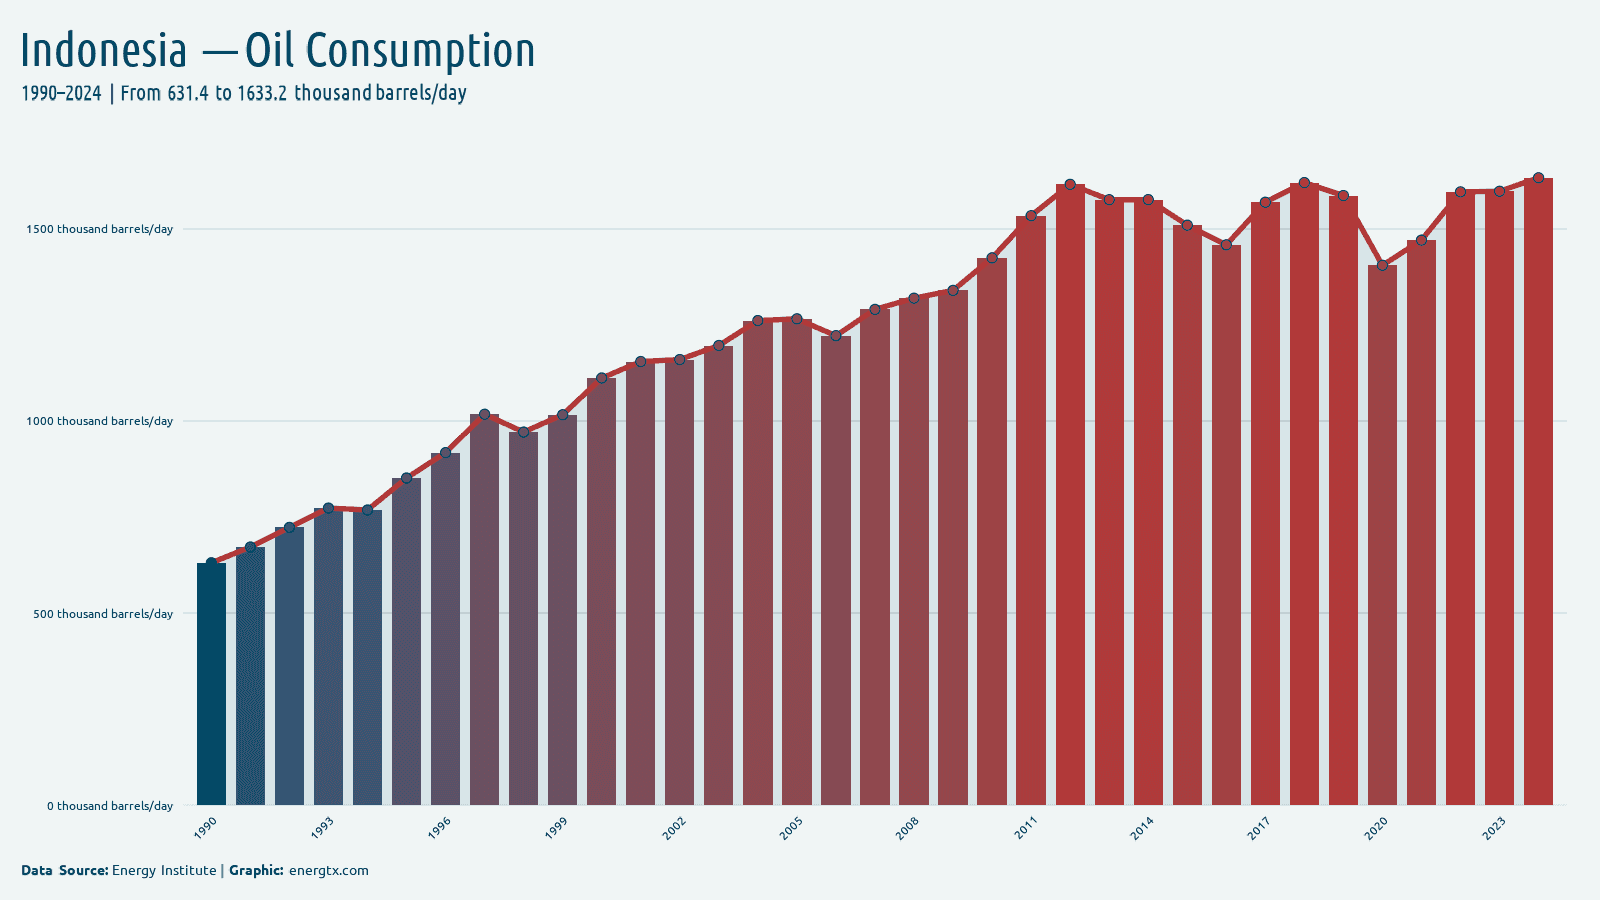
2024
Oil Consumption
1.6k
k barrels/day
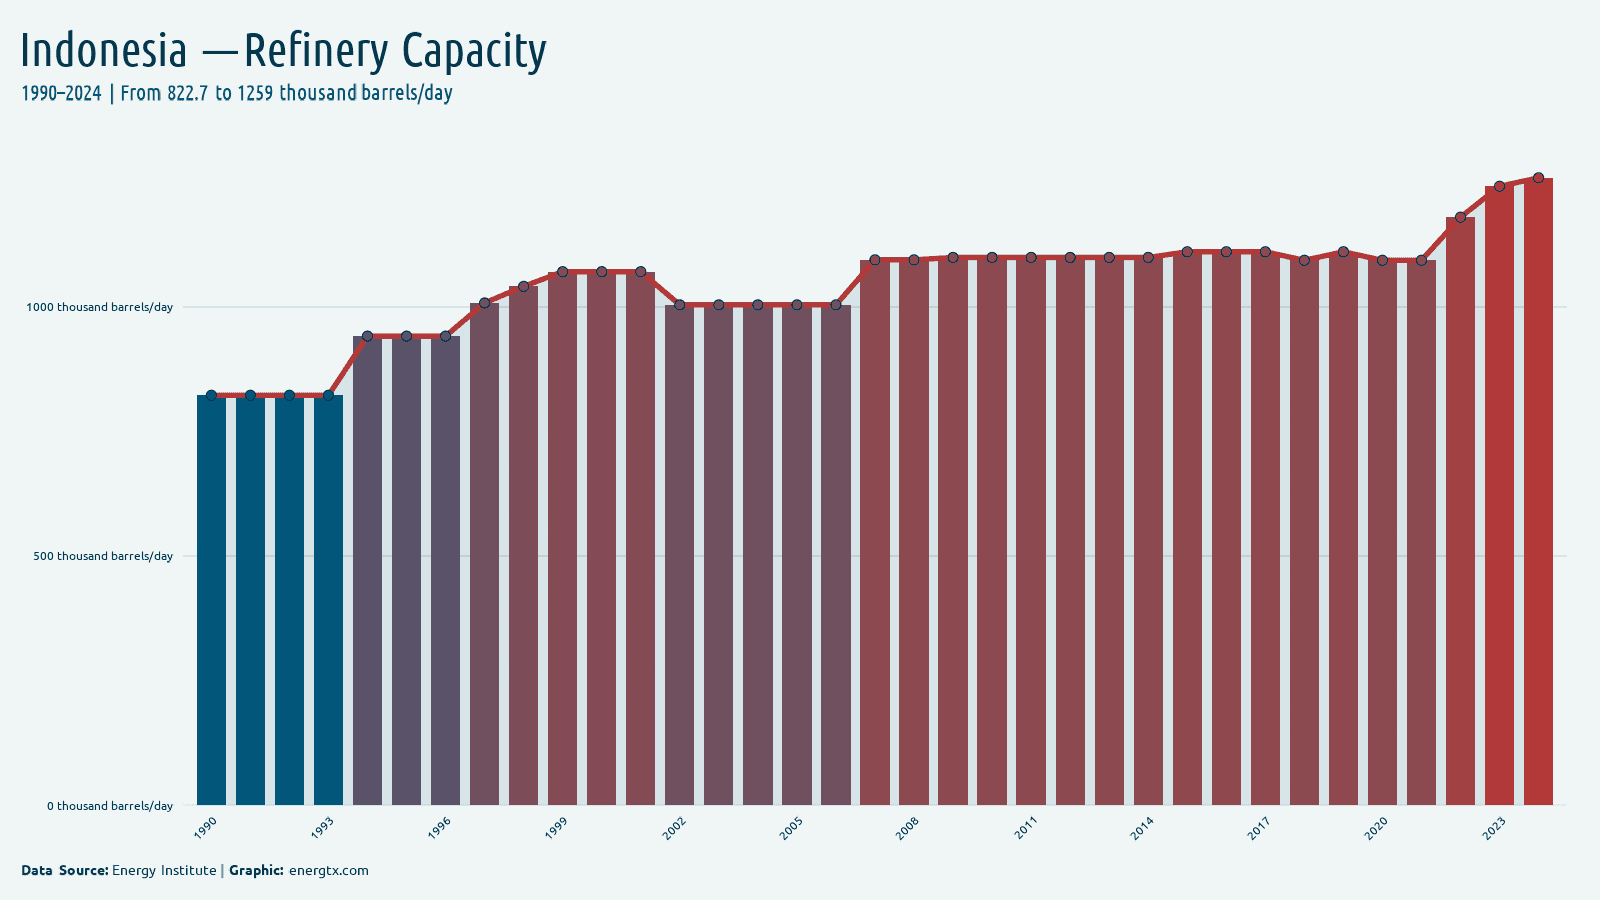
2024
Refinery Capacity
1.3k
k barrels/day
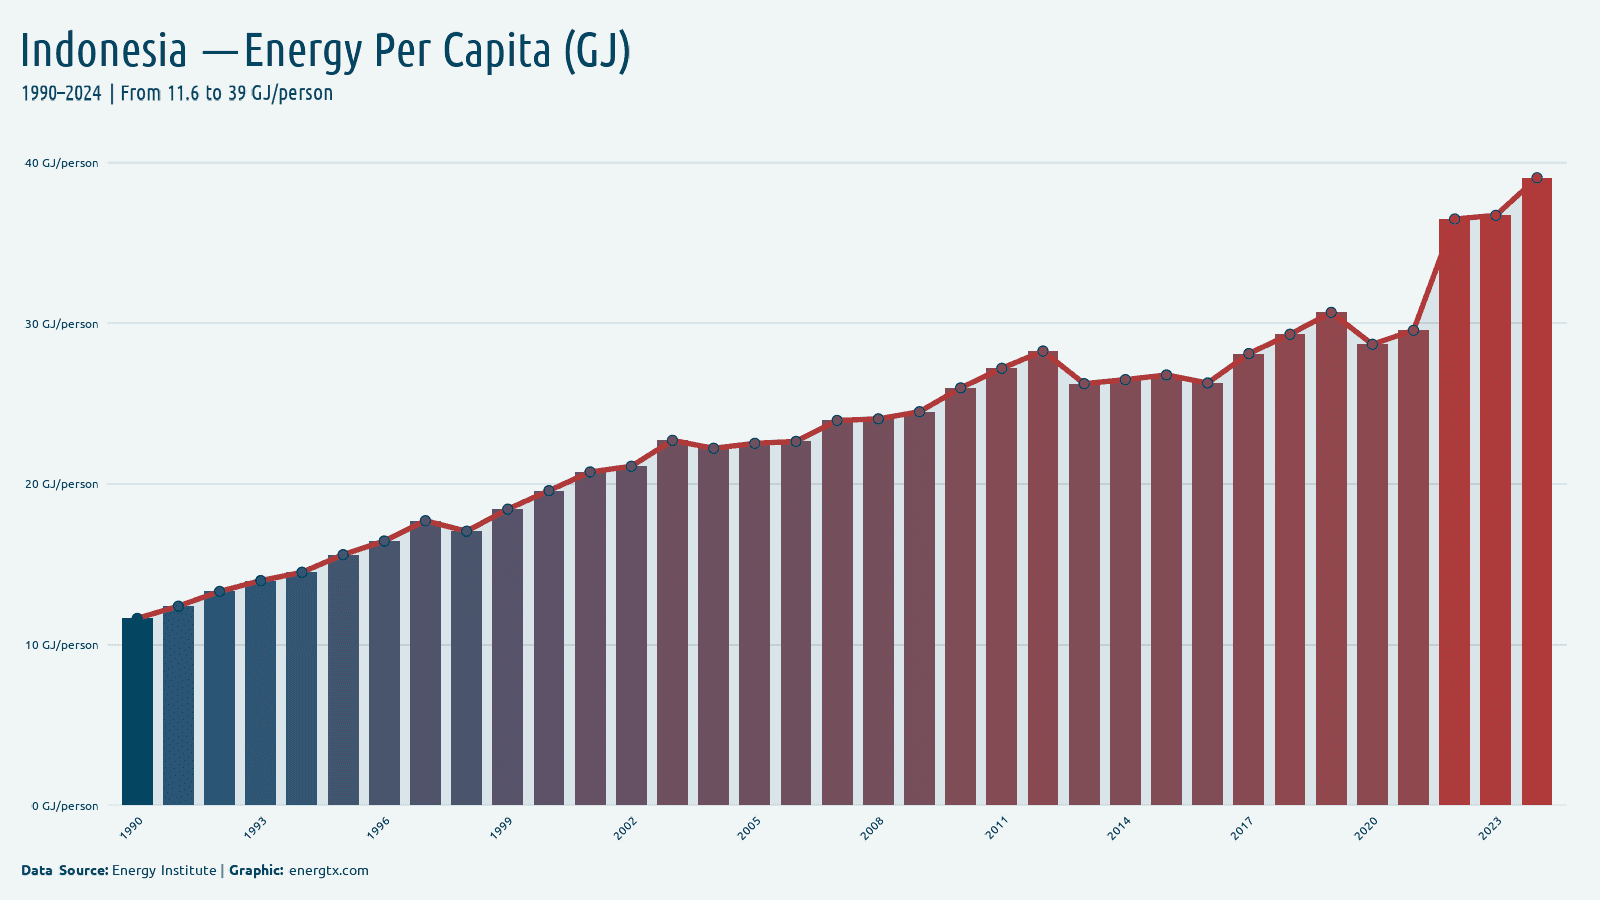
2024
Energy Per Capita (GJ)
39.0
GJ/person
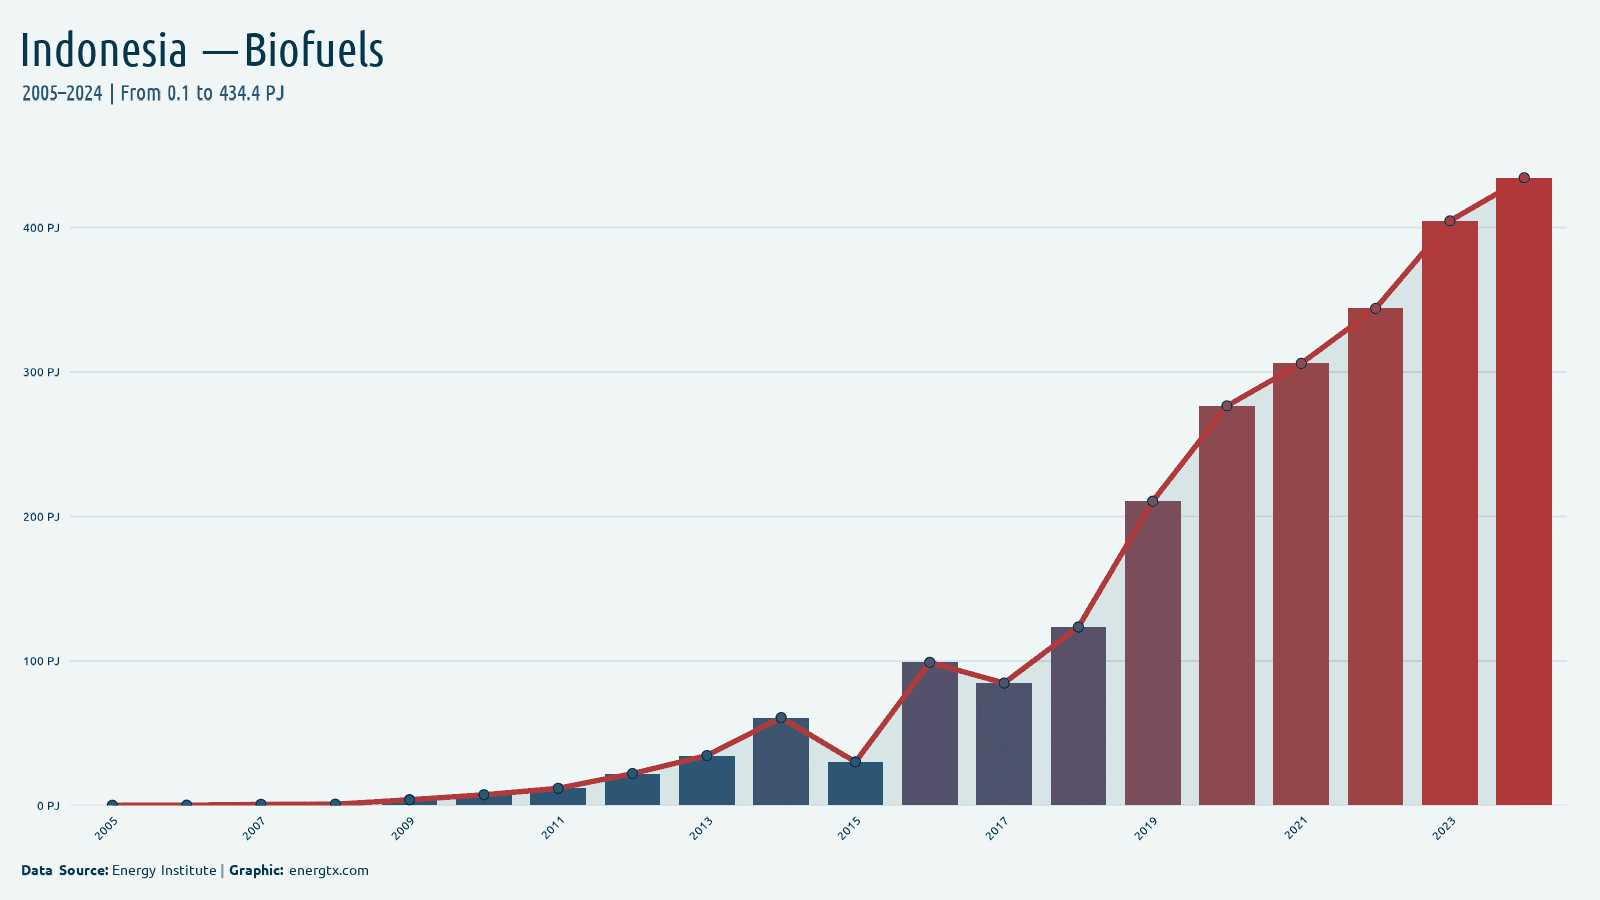
2024
Biofuels Consumption
434.4
PJ
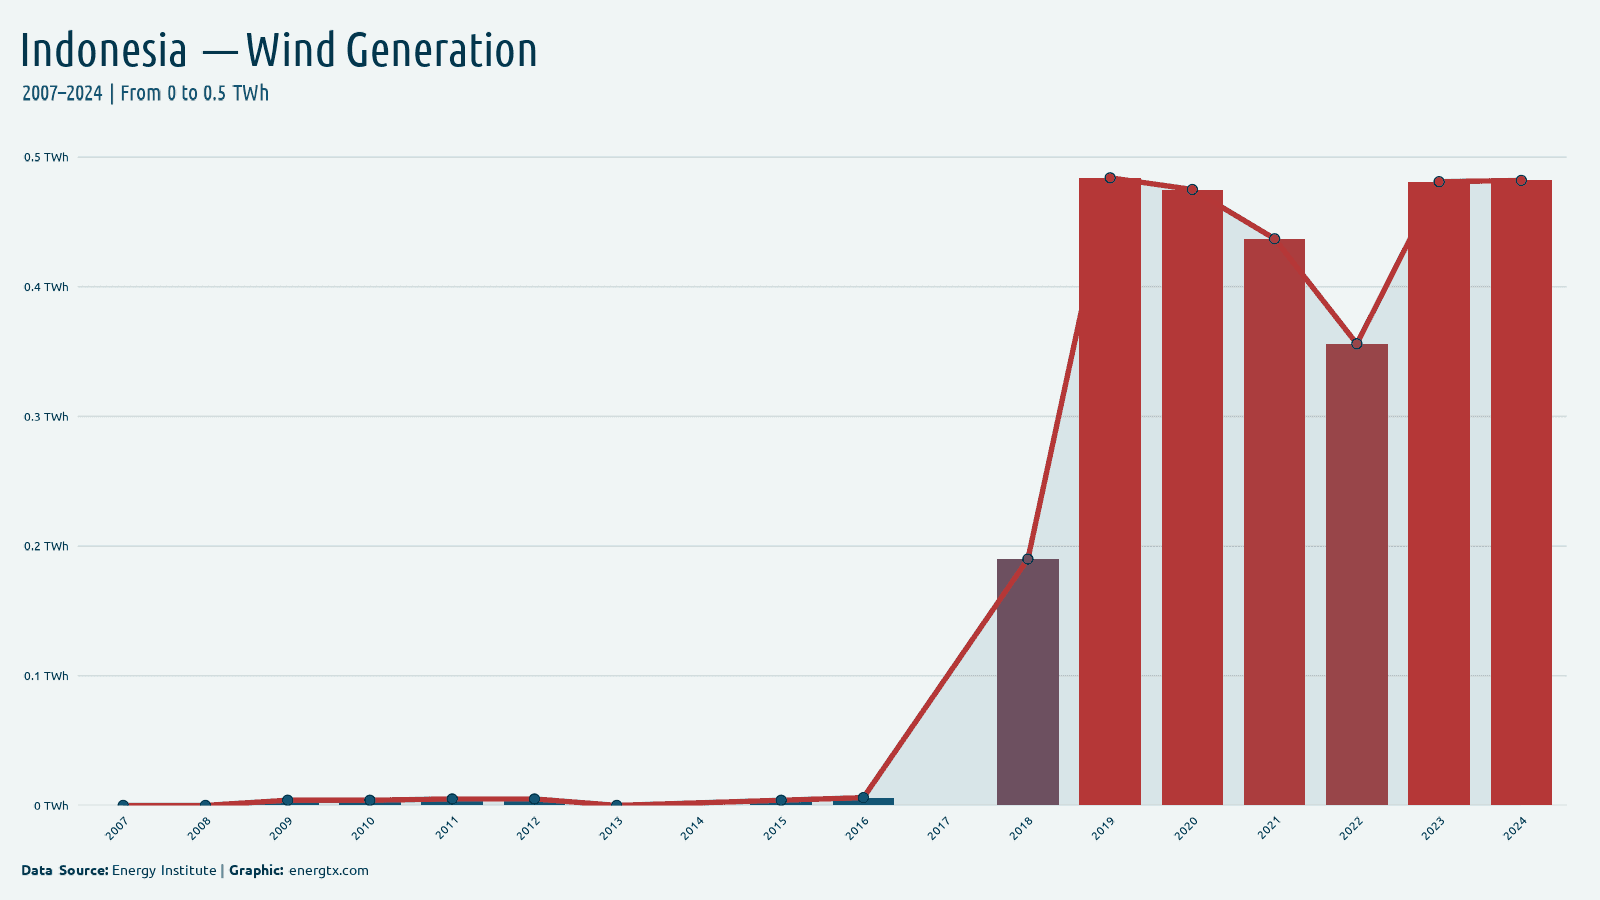
2024
Wind Generation
0.5
TWh
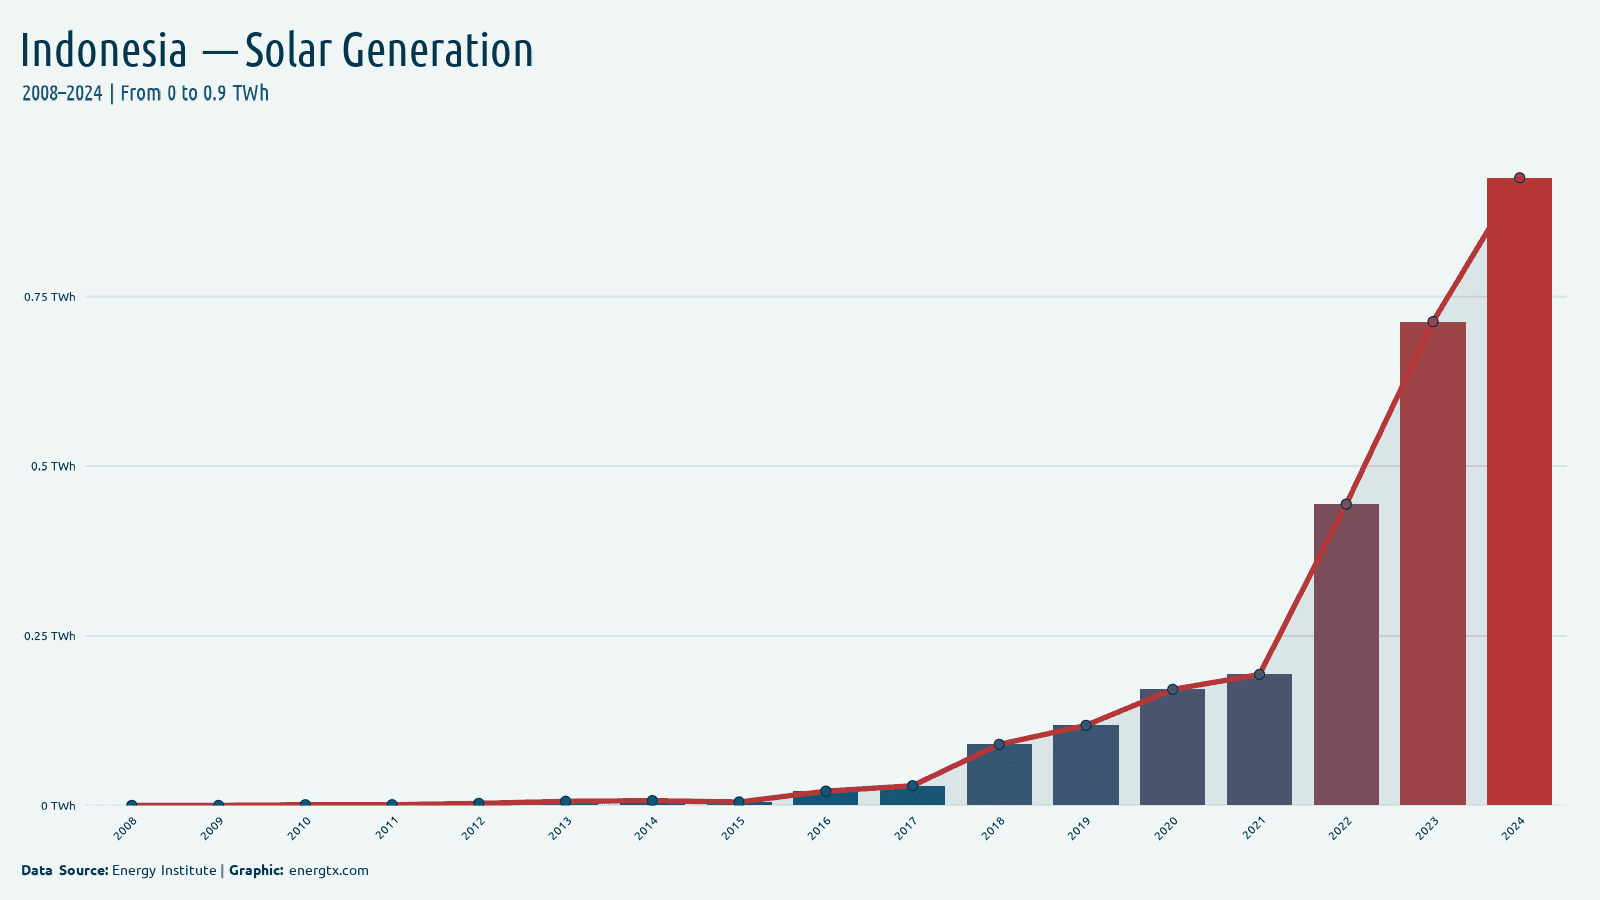
2024
Solar Generation
0.9
TWh
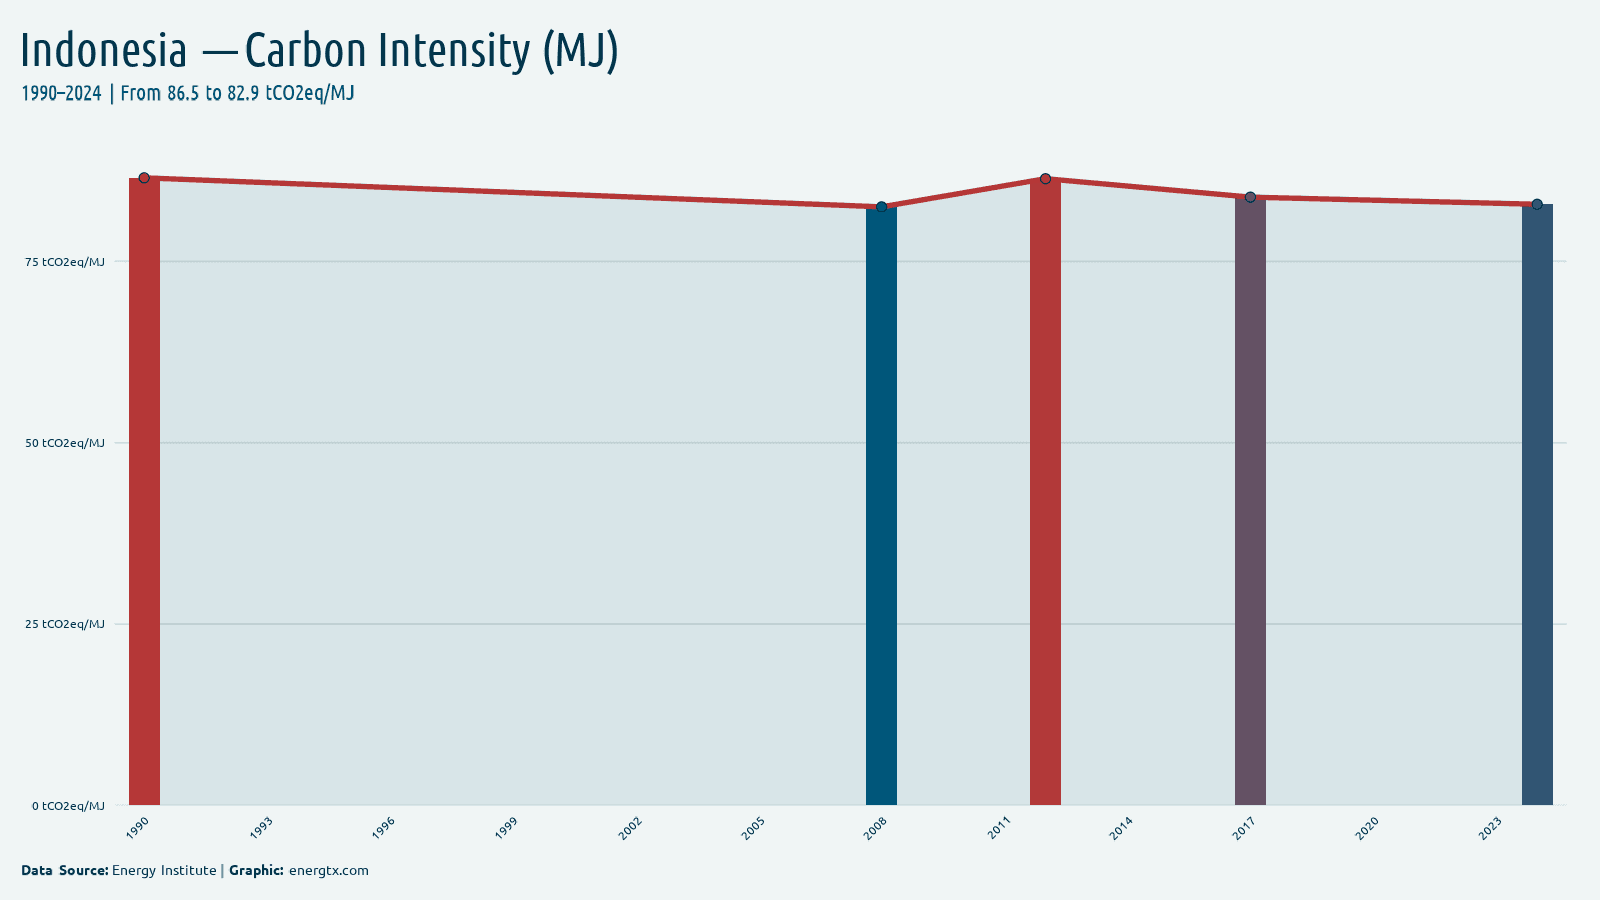
2024
Carbon Intensity (MJ)
82.9
tCO2eq/MJ
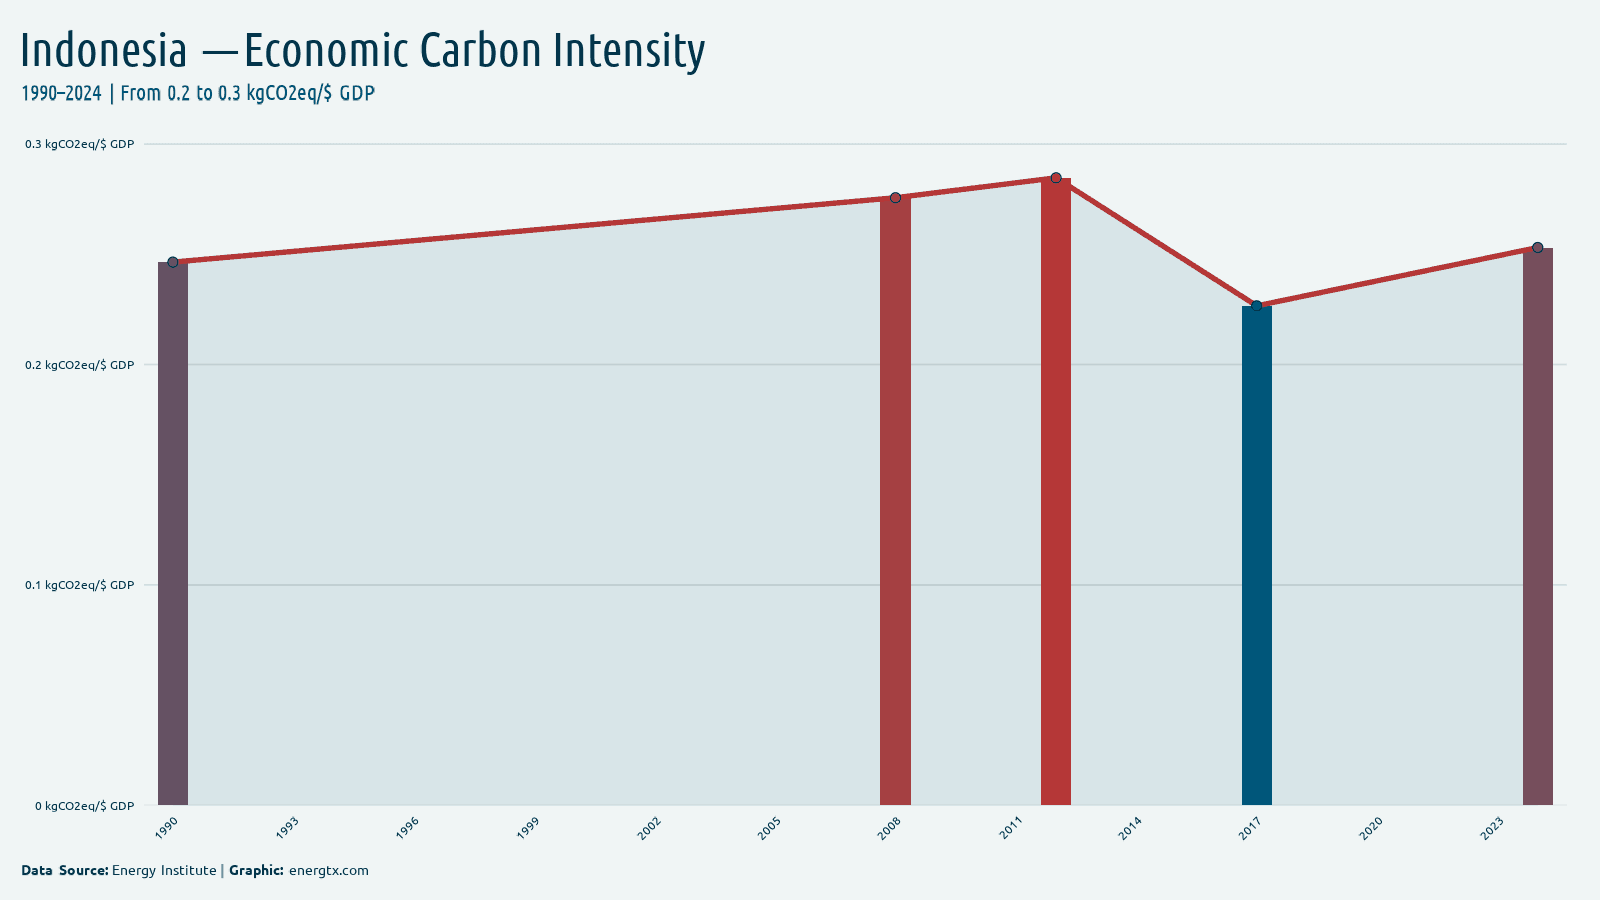
2024
Economic Carbon Intensity
0.3
kgCO2eq/$ GDP
2024
Petroleum Consumption
1.6k
k barrels/day
2024
Petroleum Production
841.7
k barrels/day
2024
Crude Oil Production
582.0
k barrels/day
2024
Motor Gasoline
636.3
k barrels/day
2024
Jet Fuel
76.5
k barrels/day
2024
Distillate Fuel
495.1
k barrels/day
2024
LPG
283.7
k barrels/day
2024
Gas Production (BCF)
2.5k
billion cubic feet
2024
Gas Consumption (BCF)
1.8k
billion cubic feet
2024
Gas Imports
31.3
billion cubic feet
2024
Gas Exports
731.4
billion cubic feet
2024
Coal Production (TST)
921.5k
thousand short tons
2024
Coal Consumption (TST)
326.9k
thousand short tons
2024
Coal Imports
20.2k
thousand short tons
2024
Coal Exports
614.8k
thousand short tons
2023
Coal Reserves
38.6k
million short tons
2024
Elec. Generation (EIA)
404.9
billion kWh
2024
Elec. Consumption (EIA)
376.2
billion kWh
2024
Elec. Capacity
99.9
GW
2024
Elec. Imports
1.0
billion kWh
2024
Elec. Exports
0.0
billion kWh
2024
Elec. Losses
29.6
billion kWh
2024
Nuclear Capacity
0.0
GW
2024
Nuclear Generation (EIA)
0.0
billion kWh
2024
Fossil Capacity
86.3
GW
2024
Fossil Generation
334.2
billion kWh
2024
Renewable Capacity
13.6
GW
2024
Renewable Generation (EIA)
70.7
billion kWh
2024
Hydro Capacity
6.6
GW
2024
Hydro Generation
27.1
billion kWh
2024
Solar Capacity (EIA)
0.8
GW
2024
Solar Generation (EIA)
1.4
billion kWh
2024
Wind Capacity (EIA)
0.1
GW
2024
Wind Generation (EIA)
0.5
billion kWh
2024
Geothermal Capacity
2.6
GW
2024
Geothermal Generation
16.8
billion kWh
2024
Biomass Capacity
3.4
GW
2024
Biomass Generation
25.0
billion kWh
2023
Primary Energy Production
485.3
Mtoe
2023
Primary Energy Consumption (EIA)
264.9
Mtoe
2023
CO2 from Coal
527.9
million metric tonnes CO2
2023
CO2 from Petroleum
223.3
million metric tonnes CO2
2023
Energy Per Capita (Btu)
37.4
million Btu/person
2023
Energy Intensity (Btu/USD)
3.0
thousand Btu/USD PPP
2023
Elec. from Oil
2.0%
%
2023
Elec. from Fossil
84.0%
%
2021
Elec. Renew. (excl. Hydro)
8.7%
%
2021
Renew. excl. Hydro (kWh)
31069820.0k
kWh/capita
2023
T&D Losses
6.5%
%
2023
Net Energy Imports
-89.5%
%
2023
Fossil Fuel Share
0.0%
%
2023
Renewables & Waste
11.1%
%
2023
Alt. & Nuclear Energy
11.5%
%
2021
Energy Intensity (MJ/GDP)
3.0
MJ/$ GDP
2021
Elec. from Nuclear
0.0%
%
2021
Final Energy (PJ)
6.1k
PJ
2022
Renew. Capacity/Capita
46.0
watts/capita
2025
Crude oil production — JODI (thousand barrels/day)
582.0
k barrels/day
2025
Refinery crude intake — JODI (thousand barrels/day)
882.8
k barrels/day
2025
Crude oil exports — JODI (thousand barrels/day)
62.3
k barrels/day
2025
Crude oil imports — JODI (thousand barrels/day)
362.4
k barrels/day
2025
Crude oil closing stocks — JODI (thousand barrels)
0.0
KBBL
2025
Refinery output — JODI (thousand barrels/day)
954.0
k barrels/day
2025
Total oil products demand — JODI (thousand barrels/day)
2.2k
k barrels/day
2025
Oil products exports — JODI (thousand barrels/day)
73.5
k barrels/day
2025
Oil products imports — JODI (thousand barrels/day)
1.1k
k barrels/day
2023
Oil products closing stocks — JODI (thousand barrels)
0.0
KBBL
2025
Diesel demand — JODI (thousand barrels/day)
682.9
k barrels/day
2025
Gasoline demand — JODI (thousand barrels/day)
656.0
k barrels/day
2025
Kerosene demand — JODI (thousand barrels/day)
88.7
k barrels/day
2025
LPG demand — JODI (thousand barrels/day)
315.4
k barrels/day
2025
Fuel oil demand — JODI (thousand barrels/day)
33.6
k barrels/day
2024
Bioenergy Share
5.7%
%
2024
Coal Share
61.5%
%
2024
Gas Share
18.5%
%
2024
Hydro Share
7.3%
%
2024
Other Fossil Share
1.9%
%
2024
Other Renewables Share
4.5%
%
2024
Solar Share
0.4%
%
2024
Wind Share
0.1%
%
2025
GHG Emissions (Total)
1.8k
Mt CO2e
2025
GHG Per Capita
6.7
t CO2e/person
2025
Global GHG Share
2.6%
%
2025
GHG from Power
366.3
Mt CO2e
2025
GHG from Transport
201.6
Mt CO2e
2025
GHG from Manufacturing
177.9
Mt CO2e
2025
GHG from Buildings
36.1
Mt CO2e
2025
GHG from Agriculture
421.6
Mt CO2e
2025
GHG from Fossil Ops
364.9
Mt CO2e
2025
GHG from Waste
42.8
Mt CO2e
2025
GHG from Land Use
205.3
Mt CO2e
2023
Effective carbon rate (€/tCO2)
2.5
€/tCO2
2023
Net effective carbon rate (€/tCO2)
-10.3
€/tCO2
Charts


Trends Over Time
Electricity Consumption (per capita)kWh/capita
Dataset
| Indicator | Year | Value | Unit | Source |
|---|---|---|---|---|
| Electricity Access | 2023 | 99.4% | % | World Bank |
| Electricity Access | 2022 | 100.0% | % | World Bank |
| Electricity Access | 2021 | 99.2% | % | World Bank |
| Electricity Access | 2020 | 97.0% | % | World Bank |
| Electricity Access | 2019 | 98.9% | % | World Bank |
| Electricity Access | 2018 | 98.5% | % | World Bank |
| Electricity Access | 2017 | 98.1% | % | World Bank |
| Electricity Access | 2016 | 97.6% | % | World Bank |
| Electricity Access | 2015 | 97.5% | % | World Bank |
| Electricity Access | 2014 | 97.0% | % | World Bank |
| Electricity Access | 2013 | 96.5% | % | World Bank |
| Electricity Access | 2012 | 96.0% | % | World Bank |
| Electricity Access | 2011 | 94.8% | % | World Bank |
| Electricity Access | 2010 | 94.2% | % | World Bank |
| Electricity Access | 2009 | 93.6% | % | World Bank |
| Electricity Access | 2008 | 92.7% | % | World Bank |
| Electricity Access | 2007 | 91.1% | % | World Bank |
| Electricity Access | 2006 | 90.6% | % | World Bank |
| Electricity Access | 2005 | 84.8% | % | World Bank |
| Electricity Access | 2004 | 89.0% | % | World Bank |
| Electricity Access | 2003 | 87.9% | % | World Bank |
| Electricity Access | 2002 | 87.6% | % | World Bank |
| Electricity Access | 2001 | 86.3% | % | World Bank |
| Electricity Access | 2000 | 86.3% | % | World Bank |
| Electricity Access | 1999 | 83.7% | % | World Bank |
| Electricity Access | 1998 | 80.9% | % | World Bank |
| Electricity Access | 1997 | 80.3% | % | World Bank |
| Electricity Access | 1996 | 72.4% | % | World Bank |
| Electricity Access | 1995 | 66.9% | % | World Bank |
| Electricity Access | 1994 | 62.8% | % | World Bank |
| Electricity Access | 1993 | 55.4% | % | World Bank |
| Electricity Access | 1992 | 66.7% | % | World Bank |
| Electricity Access | 1991 | 48.9% | % | World Bank |
| Alt. & Nuclear Energy | 2023 | 11.5% | % | World Bank |
| Alt. & Nuclear Energy | 2022 | 11.8% | % | World Bank |
| Alt. & Nuclear Energy | 2021 | 11.9% | % | World Bank |
| Alt. & Nuclear Energy | 2020 | 12.4% | % | World Bank |
| Alt. & Nuclear Energy | 2019 | 11.3% | % | World Bank |
| Alt. & Nuclear Energy | 2018 | 11.7% | % | World Bank |
| Alt. & Nuclear Energy | 2017 | 11.7% | % | World Bank |
| Alt. & Nuclear Energy | 2016 | 10.5% | % | World Bank |
| Alt. & Nuclear Energy | 2015 | 10.1% | % | World Bank |
| Alt. & Nuclear Energy | 2014 | 10.2% | % | World Bank |
| Alt. & Nuclear Energy | 2013 | 9.9% | % | World Bank |
| Alt. & Nuclear Energy | 2012 | 10.1% | % | World Bank |
| Alt. & Nuclear Energy | 2011 | 10.4% | % | World Bank |
| Alt. & Nuclear Energy | 2010 | 10.7% | % | World Bank |
| Alt. & Nuclear Energy | 2009 | 10.3% | % | World Bank |
| Alt. & Nuclear Energy | 2008 | 10.1% | % | World Bank |
| Alt. & Nuclear Energy | 2007 | 8.8% | % | World Bank |
| Alt. & Nuclear Energy | 2006 | 8.2% | % | World Bank |
| Alt. & Nuclear Energy | 2005 | 8.3% | % | World Bank |
| Alt. & Nuclear Energy | 2004 | 8.5% | % | World Bank |
| Alt. & Nuclear Energy | 2003 | 8.6% | % | World Bank |
| Alt. & Nuclear Energy | 2002 | 8.6% | % | World Bank |
| Alt. & Nuclear Energy | 2001 | 8.8% | % | World Bank |
| Alt. & Nuclear Energy | 2000 | 7.3% | % | World Bank |
| Alt. & Nuclear Energy | 1999 | 4.4% | % | World Bank |
| Alt. & Nuclear Energy | 1998 | 4.5% | % | World Bank |
| Alt. & Nuclear Energy | 1997 | 4.0% | % | World Bank |
| Alt. & Nuclear Energy | 1996 | 4.0% | % | World Bank |
| Alt. & Nuclear Energy | 1995 | 3.9% | % | World Bank |
| Alt. & Nuclear Energy | 1994 | 3.7% | % | World Bank |
| Alt. & Nuclear Energy | 1993 | 2.5% | % | World Bank |
| Alt. & Nuclear Energy | 1992 | 2.8% | % | World Bank |
| Alt. & Nuclear Energy | 1991 | 2.7% | % | World Bank |
| Alt. & Nuclear Energy | 1990 | 2.9% | % | World Bank |
| Biofuels Consumption | 2024 | 434.4 | PJ | Energy Institute |
| Biofuels Consumption | 2023 | 404.6 | PJ | Energy Institute |
| Biofuels Consumption | 2022 | 343.9 | PJ | Energy Institute |
| Biofuels Consumption | 2021 | 305.9 | PJ | Energy Institute |
| Biofuels Consumption | 2020 | 276.5 | PJ | Energy Institute |
| Biofuels Consumption | 2019 | 210.5 | PJ | Energy Institute |
| Biofuels Consumption | 2018 | 123.4 | PJ | Energy Institute |
| Biofuels Consumption | 2017 | 84.7 | PJ | Energy Institute |
| Biofuels Consumption | 2016 | 99.0 | PJ | Energy Institute |
| Biofuels Consumption | 2015 | 30.1 | PJ | Energy Institute |
| Biofuels Consumption | 2014 | 60.7 | PJ | Energy Institute |
| Biofuels Consumption | 2013 | 34.5 | PJ | Energy Institute |
| Biofuels Consumption | 2012 | 22.0 | PJ | Energy Institute |
| Biofuels Consumption | 2011 | 11.8 | PJ | Energy Institute |
| Biofuels Consumption | 2010 | 7.3 | PJ | Energy Institute |
| Biofuels Consumption | 2009 | 3.9 | PJ | Energy Institute |
| Biofuels Consumption | 2008 | 0.8 | PJ | Energy Institute |
| Biofuels Consumption | 2007 | 0.7 | PJ | Energy Institute |
| Biofuels Consumption | 2006 | 0.2 | PJ | Energy Institute |
| Biofuels Consumption | 2005 | 0.1 | PJ | Energy Institute |
| Biomass Capacity | 2024 | 3.4 | GW | EIA |
| Biomass Capacity | 2023 | 3.4 | GW | EIA |
| Biomass Capacity | 2022 | 3.0 | GW | EIA |
| Biomass Capacity | 2021 | 2.3 | GW | EIA |
| Biomass Capacity | 2020 | 1.9 | GW | EIA |
| Biomass Capacity | 2019 | 1.9 | GW | EIA |
| Biomass Capacity | 2018 | 1.9 | GW | EIA |
| Biomass Capacity | 2017 | 1.9 | GW | EIA |
| Biomass Capacity | 2016 | 1.8 | GW | EIA |
| Biomass Capacity | 2015 | 1.7 | GW | EIA |
| Biomass Capacity | 2014 | 1.7 | GW | EIA |
| Biomass Capacity | 2013 | 1.7 | GW | EIA |
| Biomass Capacity | 2012 | 2.0 | GW | EIA |
| Biomass Capacity | 2011 | 1.9 | GW | EIA |
| Biomass Capacity | 2010 | 1.9 | GW | EIA |
| Biomass Capacity | 2009 | 1.8 | GW | EIA |
| Biomass Capacity | 2008 | 1.1 | GW | EIA |
| Biomass Capacity | 2007 | 1.1 | GW | EIA |
| Biomass Capacity | 2006 | 1.1 | GW | EIA |
| Biomass Capacity | 2005 | 1.1 | GW | EIA |
| Biomass Capacity | 2004 | 0.8 | GW | EIA |
| Biomass Capacity | 2003 | 0.8 | GW | EIA |
| Biomass Capacity | 2002 | 0.8 | GW | EIA |
| Biomass Capacity | 2001 | 0.8 | GW | EIA |
| Biomass Capacity | 2000 | 0.8 | GW | EIA |
| Biomass Generation | 2024 | 25.0 | billion kWh | EIA |
| Biomass Generation | 2023 | 26.3 | billion kWh | EIA |
| Biomass Generation | 2022 | 23.0 | billion kWh | EIA |
| Biomass Generation | 2021 | 17.5 | billion kWh | EIA |
| Biomass Generation | 2020 | 14.5 | billion kWh | EIA |
| Biomass Generation | 2019 | 13.8 | billion kWh | EIA |
| Biomass Generation | 2018 | 13.5 | billion kWh | EIA |
| Biomass Generation | 2017 | 1.0 | billion kWh | EIA |
| Biomass Generation | 2016 | 3.0 | billion kWh | EIA |
| Biomass Generation | 2015 | 1.4 | billion kWh | EIA |
| Biomass Generation | 2014 | 1.4 | billion kWh | EIA |
| Biomass Generation | 2013 | 1.1 | billion kWh | EIA |
| Biomass Generation | 2012 | 0.5 | billion kWh | EIA |
| Biomass Generation | 2011 | 0.5 | billion kWh | EIA |
| Biomass Generation | 2010 | 0.3 | billion kWh | EIA |
| Biomass Generation | 2009 | 0.2 | billion kWh | EIA |
| Biomass Generation | 2008 | 0.1 | billion kWh | EIA |
| Biomass Generation | 2007 | 0.1 | billion kWh | EIA |
| Biomass Generation | 2006 | 0.1 | billion kWh | EIA |
| Biomass Generation | 2005 | 0.1 | billion kWh | EIA |
| Biomass Generation | 2004 | 0.1 | billion kWh | EIA |
| Biomass Generation | 2003 | 0.1 | billion kWh | EIA |
| Biomass Generation | 2002 | 0.1 | billion kWh | EIA |
| Biomass Generation | 2001 | 0.1 | billion kWh | EIA |
| Biomass Generation | 2000 | 0.1 | billion kWh | EIA |
| Biomass Generation | 1999 | 0.0 | billion kWh | EIA |
| Biomass Generation | 1998 | 0.0 | billion kWh | EIA |
| Biomass Generation | 1997 | 0.0 | billion kWh | EIA |
| Biomass Generation | 1996 | 0.0 | billion kWh | EIA |
| Biomass Generation | 1995 | 0.0 | billion kWh | EIA |
| Biomass Generation | 1994 | 0.0 | billion kWh | EIA |
| Biomass Generation | 1993 | 0.0 | billion kWh | EIA |
| Biomass Generation | 1992 | 0.0 | billion kWh | EIA |
| Biomass Generation | 1991 | 0.0 | billion kWh | EIA |
| Biomass Generation | 1990 | 0.0 | billion kWh | EIA |
| Carbon Intensity (MJ) | 2024 | 82.9 | tCO2eq/MJ | Energy Institute |
| Carbon Intensity (MJ) | 2017 | 83.9 | tCO2eq/MJ | Energy Institute |
| Carbon Intensity (MJ) | 2012 | 86.4 | tCO2eq/MJ | Energy Institute |
| Carbon Intensity (MJ) | 2008 | 82.5 | tCO2eq/MJ | Energy Institute |
| Carbon Intensity (MJ) | 1990 | 86.5 | tCO2eq/MJ | Energy Institute |
| Carbon Intensity | 2024 | 15.4 | tCO2/EJ | Energy Institute |
| Carbon Intensity | 2023 | 15.9 | tCO2/EJ | Energy Institute |
| Carbon Intensity | 2022 | 14.5 | tCO2/EJ | Energy Institute |
| Carbon Intensity | 2021 | 16.8 | tCO2/EJ | Energy Institute |
| Carbon Intensity | 2020 | 17.9 | tCO2/EJ | Energy Institute |
| Carbon Intensity | 2019 | 17.9 | tCO2/EJ | Energy Institute |
| Carbon Intensity | 2018 | 18.2 | tCO2/EJ | Energy Institute |
| Carbon Intensity | 2017 | 18.1 | tCO2/EJ | Energy Institute |
| Carbon Intensity | 2016 | 19.3 | tCO2/EJ | Energy Institute |
| Carbon Intensity | 2015 | 18.2 | tCO2/EJ | Energy Institute |
| Carbon Intensity | 2014 | 19.7 | tCO2/EJ | Energy Institute |
| Carbon Intensity | 2013 | 20.3 | tCO2/EJ | Energy Institute |
| Carbon Intensity | 2012 | 19.5 | tCO2/EJ | Energy Institute |
| Carbon Intensity | 2011 | 19.2 | tCO2/EJ | Energy Institute |
| Carbon Intensity | 2010 | 17.9 | tCO2/EJ | Energy Institute |
| Carbon Intensity | 2009 | 18.0 | tCO2/EJ | Energy Institute |
| Carbon Intensity | 2008 | 16.8 | tCO2/EJ | Energy Institute |
| Carbon Intensity | 2007 | 16.7 | tCO2/EJ | Energy Institute |
| Carbon Intensity | 2006 | 17.8 | tCO2/EJ | Energy Institute |
| Carbon Intensity | 2005 | 16.2 | tCO2/EJ | Energy Institute |
| Carbon Intensity | 2004 | 16.3 | tCO2/EJ | Energy Institute |
| Carbon Intensity | 2003 | 15.6 | tCO2/EJ | Energy Institute |
| Carbon Intensity | 2002 | 17.0 | tCO2/EJ | Energy Institute |
| Carbon Intensity | 2001 | 17.6 | tCO2/EJ | Energy Institute |
| Carbon Intensity | 2000 | 18.1 | tCO2/EJ | Energy Institute |
| Carbon Intensity | 1999 | 19.2 | tCO2/EJ | Energy Institute |
| Carbon Intensity | 1998 | 20.5 | tCO2/EJ | Energy Institute |
| Carbon Intensity | 1997 | 21.0 | tCO2/EJ | Energy Institute |
| Carbon Intensity | 1996 | 22.0 | tCO2/EJ | Energy Institute |
| Carbon Intensity | 1995 | 22.5 | tCO2/EJ | Energy Institute |
| Carbon Intensity | 1994 | 23.9 | tCO2/EJ | Energy Institute |
| Carbon Intensity | 1993 | 24.7 | tCO2/EJ | Energy Institute |
| Carbon Intensity | 1992 | 25.1 | tCO2/EJ | Energy Institute |
| Carbon Intensity | 1991 | 26.3 | tCO2/EJ | Energy Institute |
| Carbon Intensity | 1990 | 24.8 | tCO2/EJ | Energy Institute |
| CO2 Emissions (per capita) | 2023 | 2.7 | metric tons/capita | Global Carbon Project |
| CO2 Emissions (per capita) | 2022 | 2.7 | metric tons/capita | Global Carbon Project |
| CO2 Emissions (per capita) | 2021 | 2.3 | metric tons/capita | Global Carbon Project |
| CO2 Emissions (per capita) | 2020 | 2.3 | metric tons/capita | Global Carbon Project |
| CO2 Emissions (per capita) | 2019 | 2.4 | metric tons/capita | Global Carbon Project |
| CO2 Emissions (per capita) | 2018 | 2.3 | metric tons/capita | Global Carbon Project |
| CO2 Emissions (per capita) | 2017 | 2.1 | metric tons/capita | Global Carbon Project |
| CO2 Emissions (per capita) | 2016 | 2.1 | metric tons/capita | Global Carbon Project |
| CO2 Emissions (per capita) | 2015 | 2.1 | metric tons/capita | Global Carbon Project |
| CO2 Emissions (per capita) | 2014 | 1.9 | metric tons/capita | Global Carbon Project |
| CO2 Emissions (per capita) | 2013 | 1.9 | metric tons/capita | Global Carbon Project |
| CO2 Emissions (per capita) | 2012 | 2.0 | metric tons/capita | Global Carbon Project |
| CO2 Emissions (per capita) | 2011 | 2.0 | metric tons/capita | Global Carbon Project |
Showing 200 of 3502 records. Download for the full dataset.
Download Indonesia Data
Found a data error?
Our data is sourced from World Bank, Energy Institute, OWID, OECD, IAEA, GCP, and Eurostat. If you notice an incorrect value, missing data, or any discrepancy for Indonesia, please let us know so we can investigate and correct it. Include the indicator name, year, and a brief description of the issue.
Report a data error