🇮🇳
India
3692 records · 129 indicators · 1990–2025
3,692
Data Records
129
Indicators
1990–2025
Time Range
IND
ISO Code
Latest Indicator Values
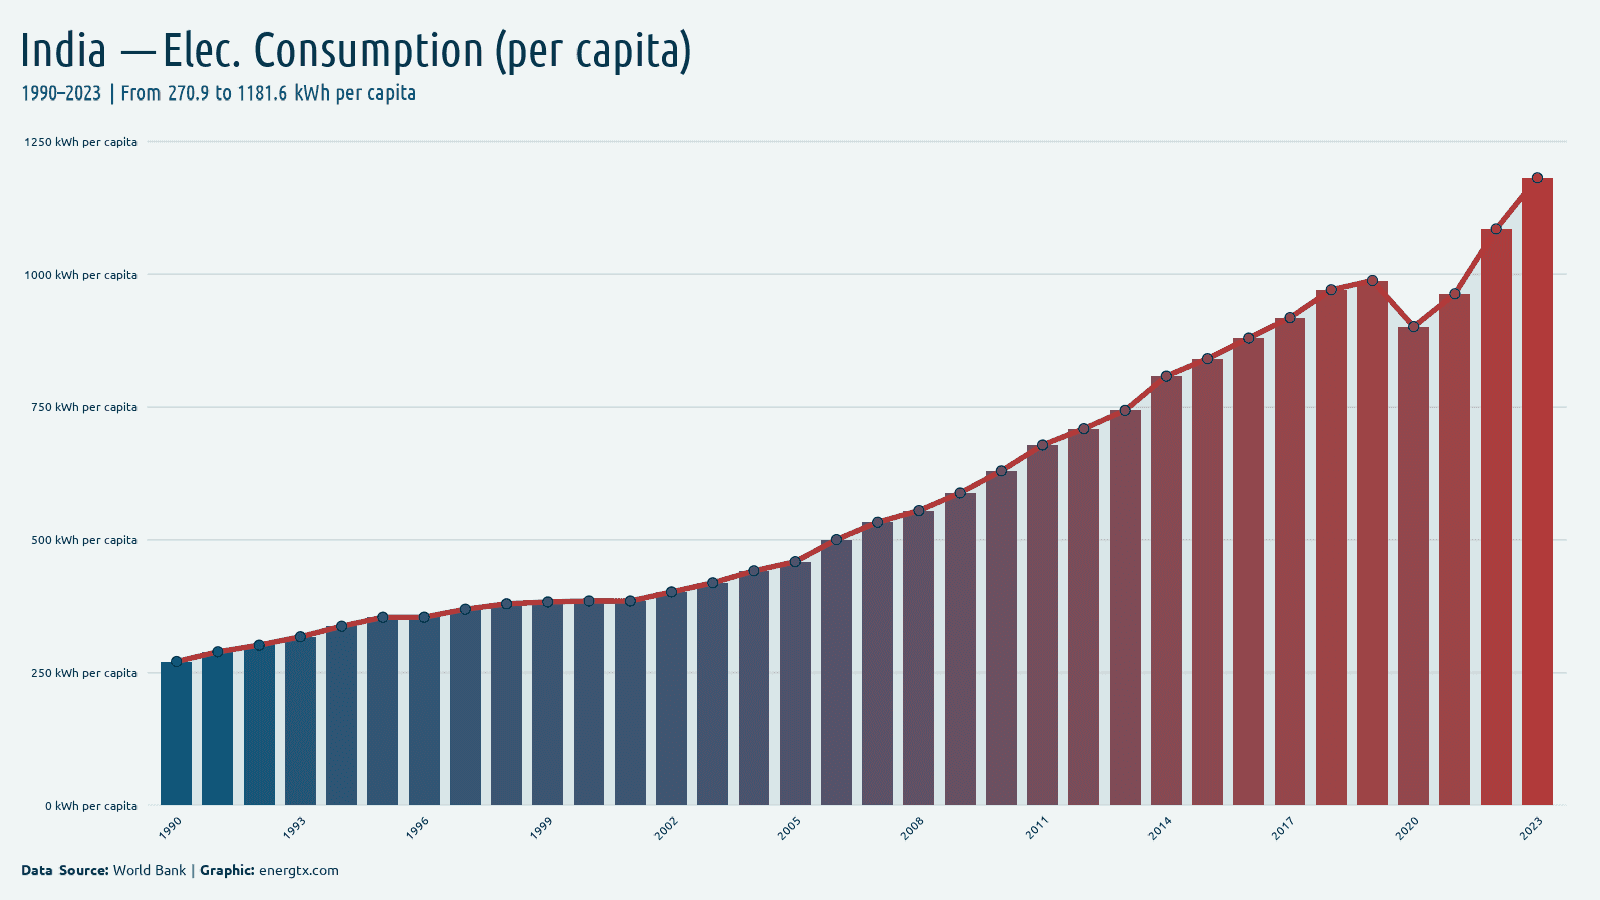
2023
Electricity Consumption (per capita)
1.2k
kWh/capita
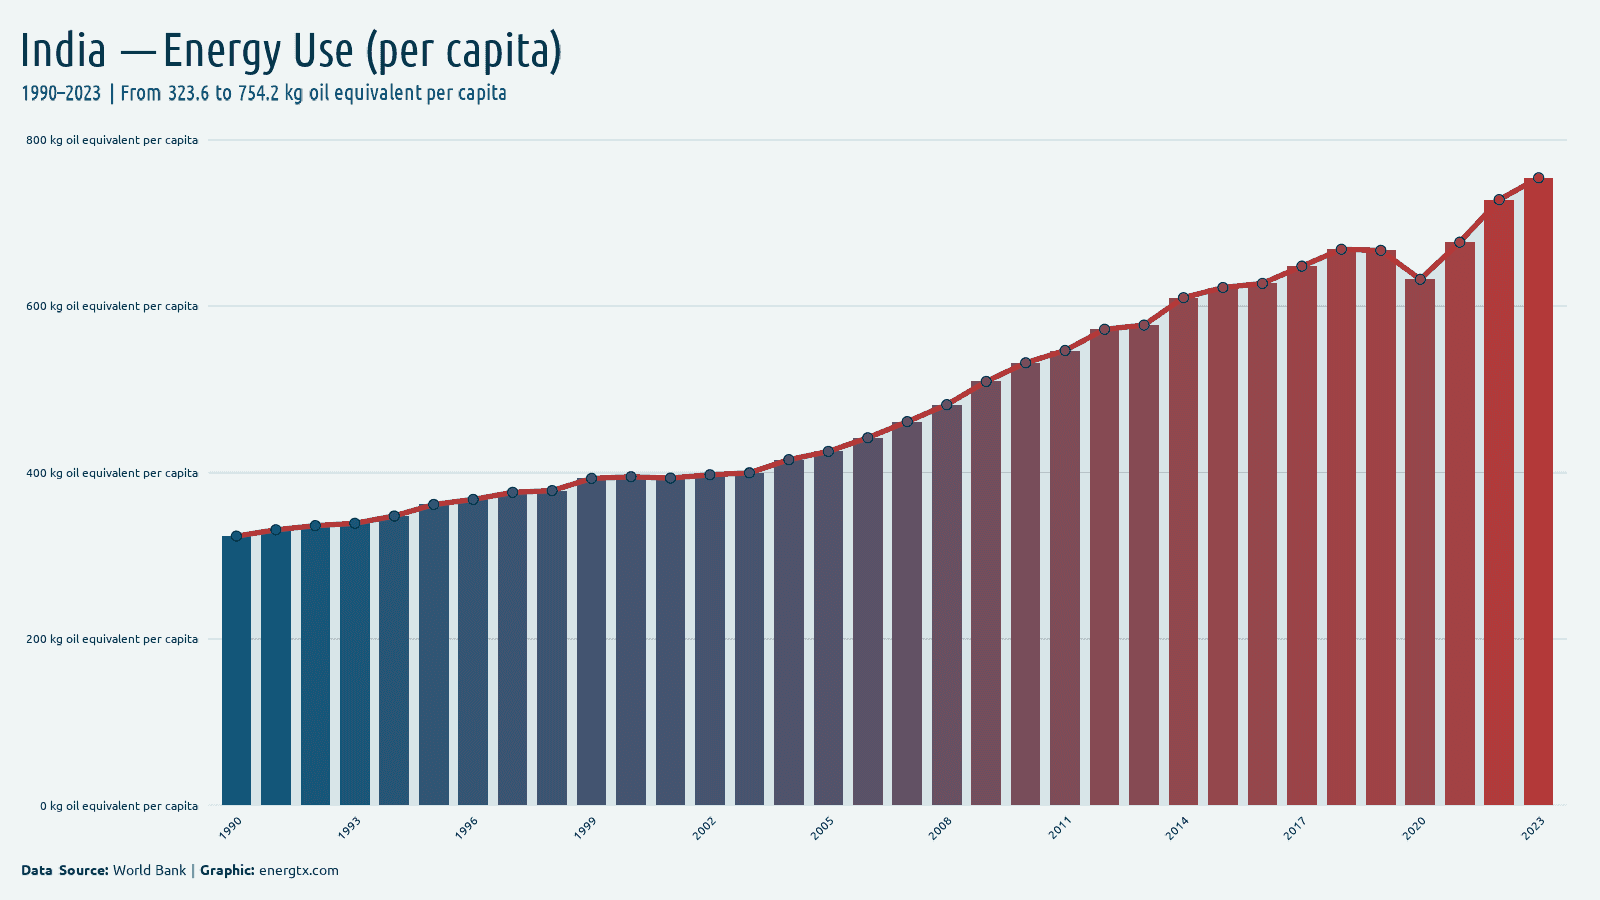
2023
Energy Use (per capita)
754.2
kg oil eq./capita
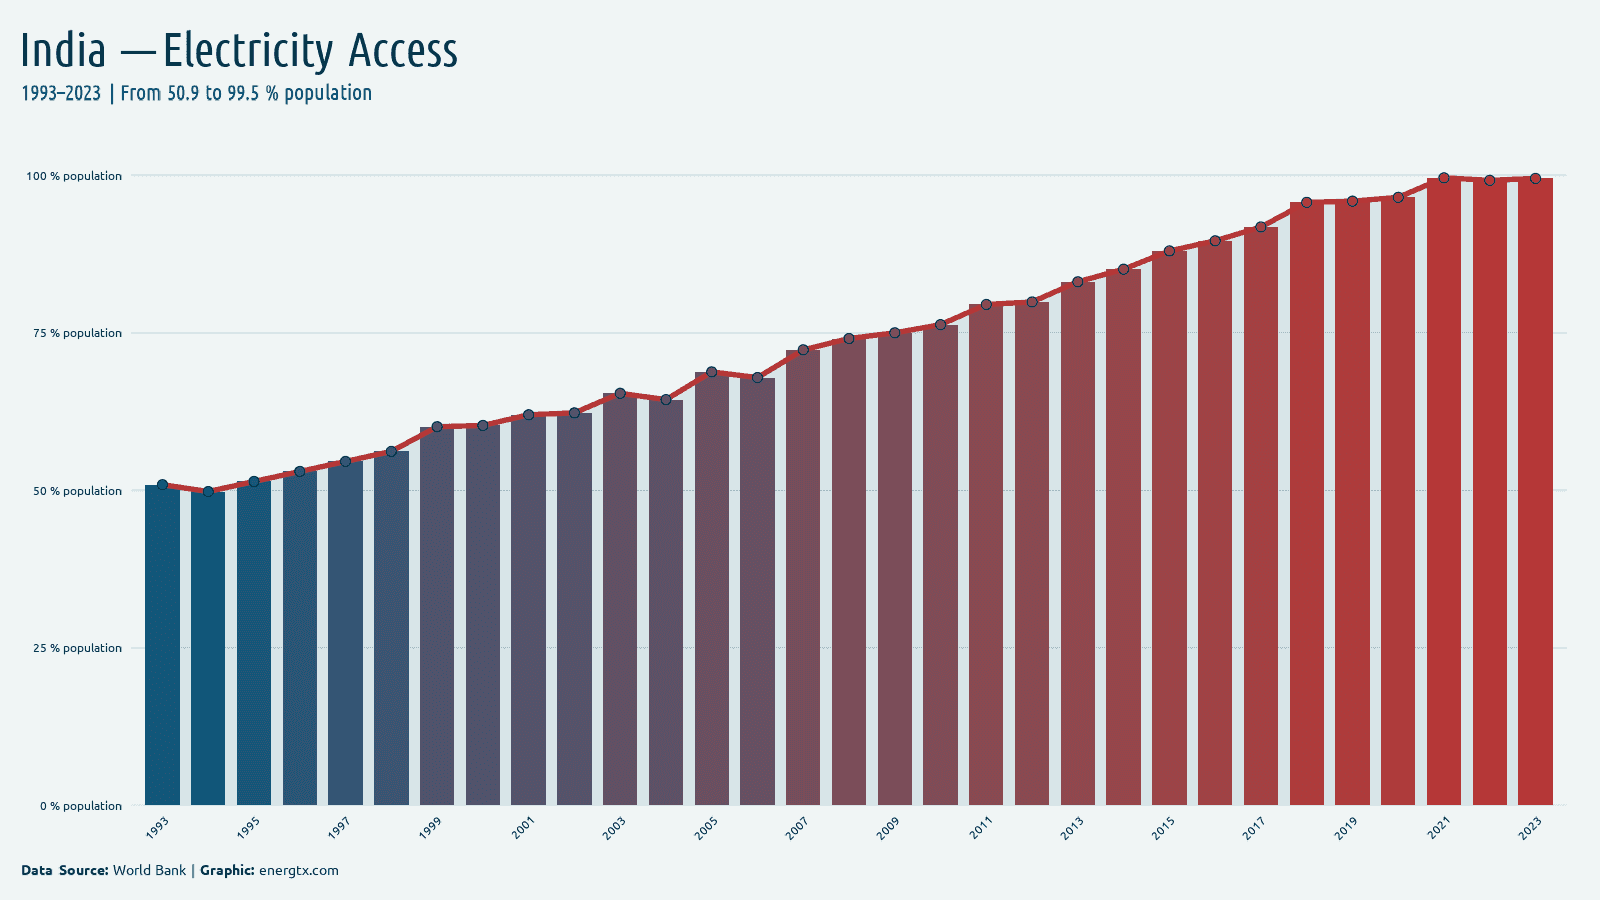
2023
Electricity Access
99.5%
%
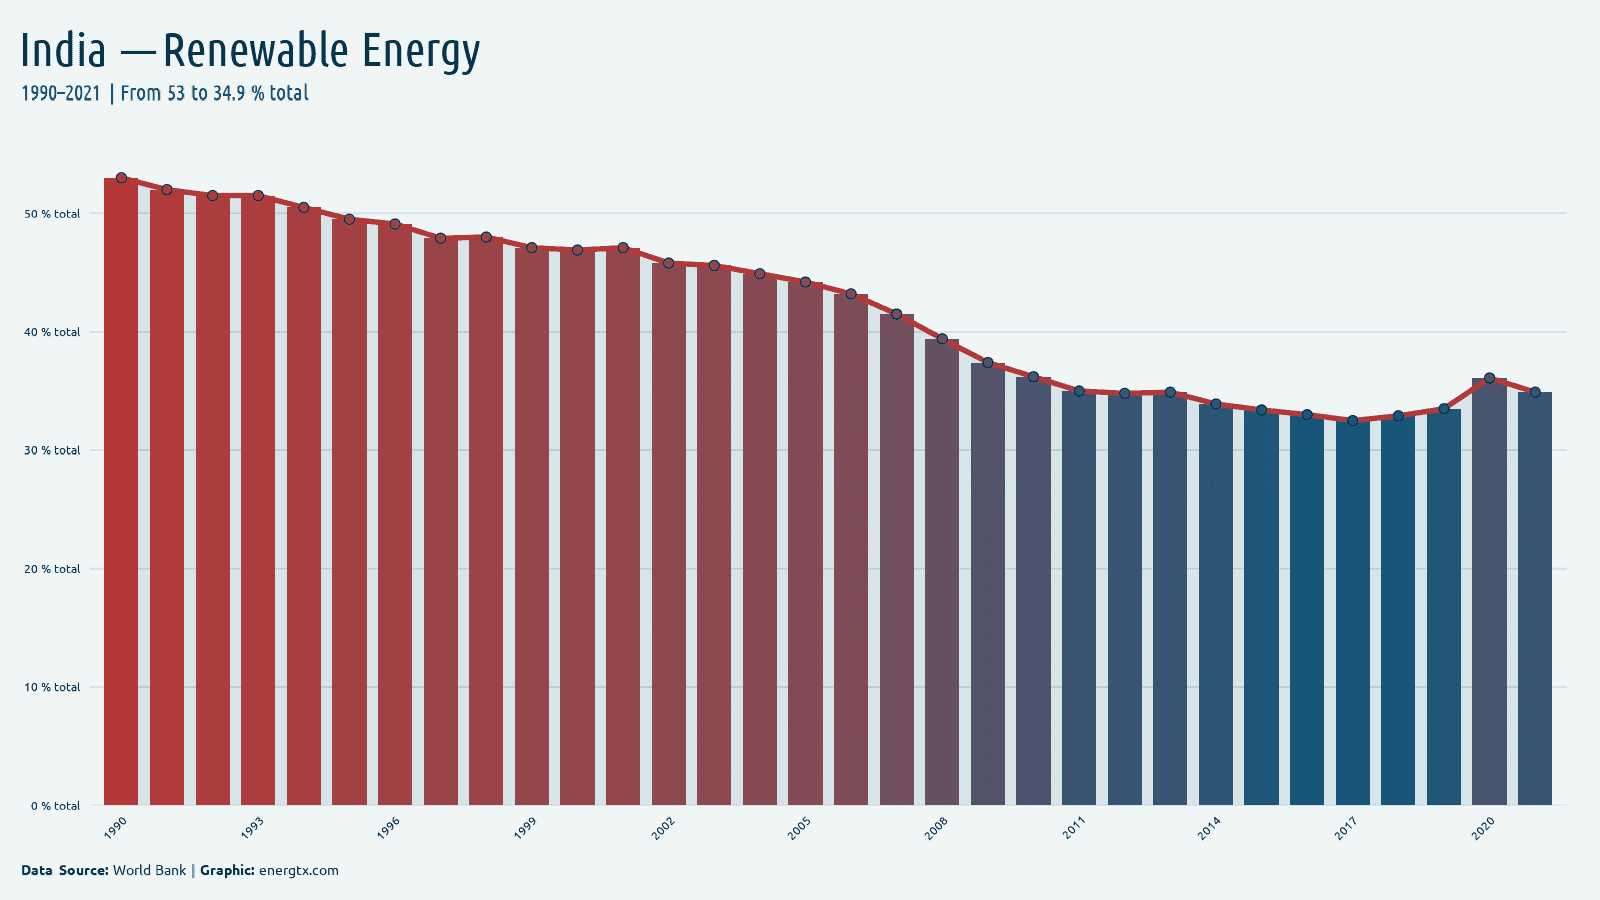
2021
Renewable Energy
34.9%
%
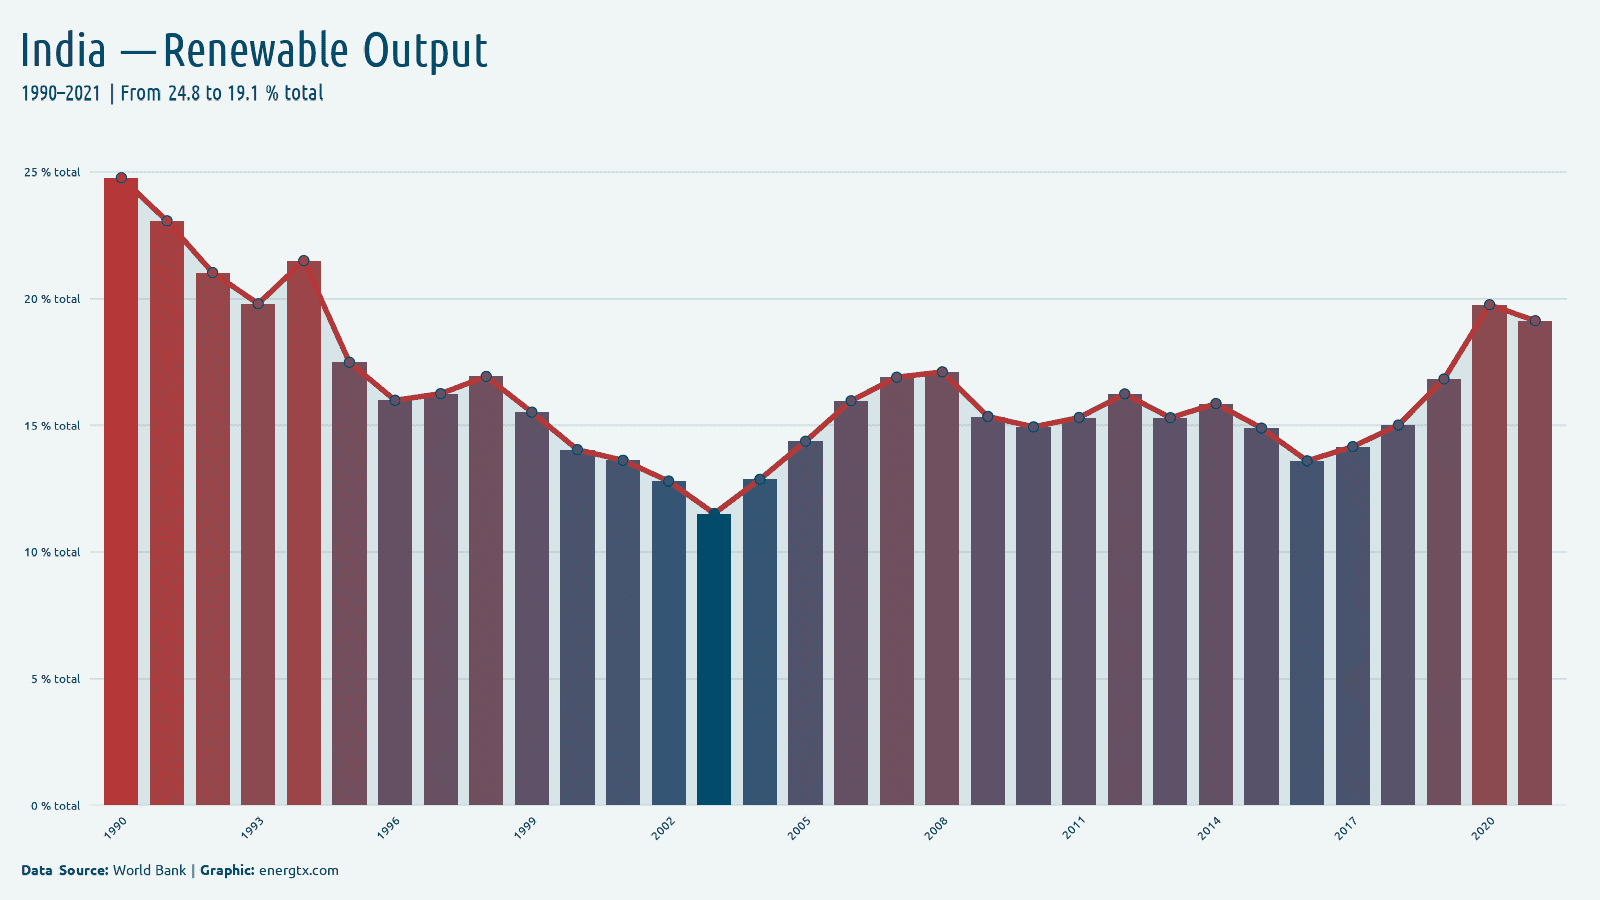
2021
Renewable Output
19.1%
%
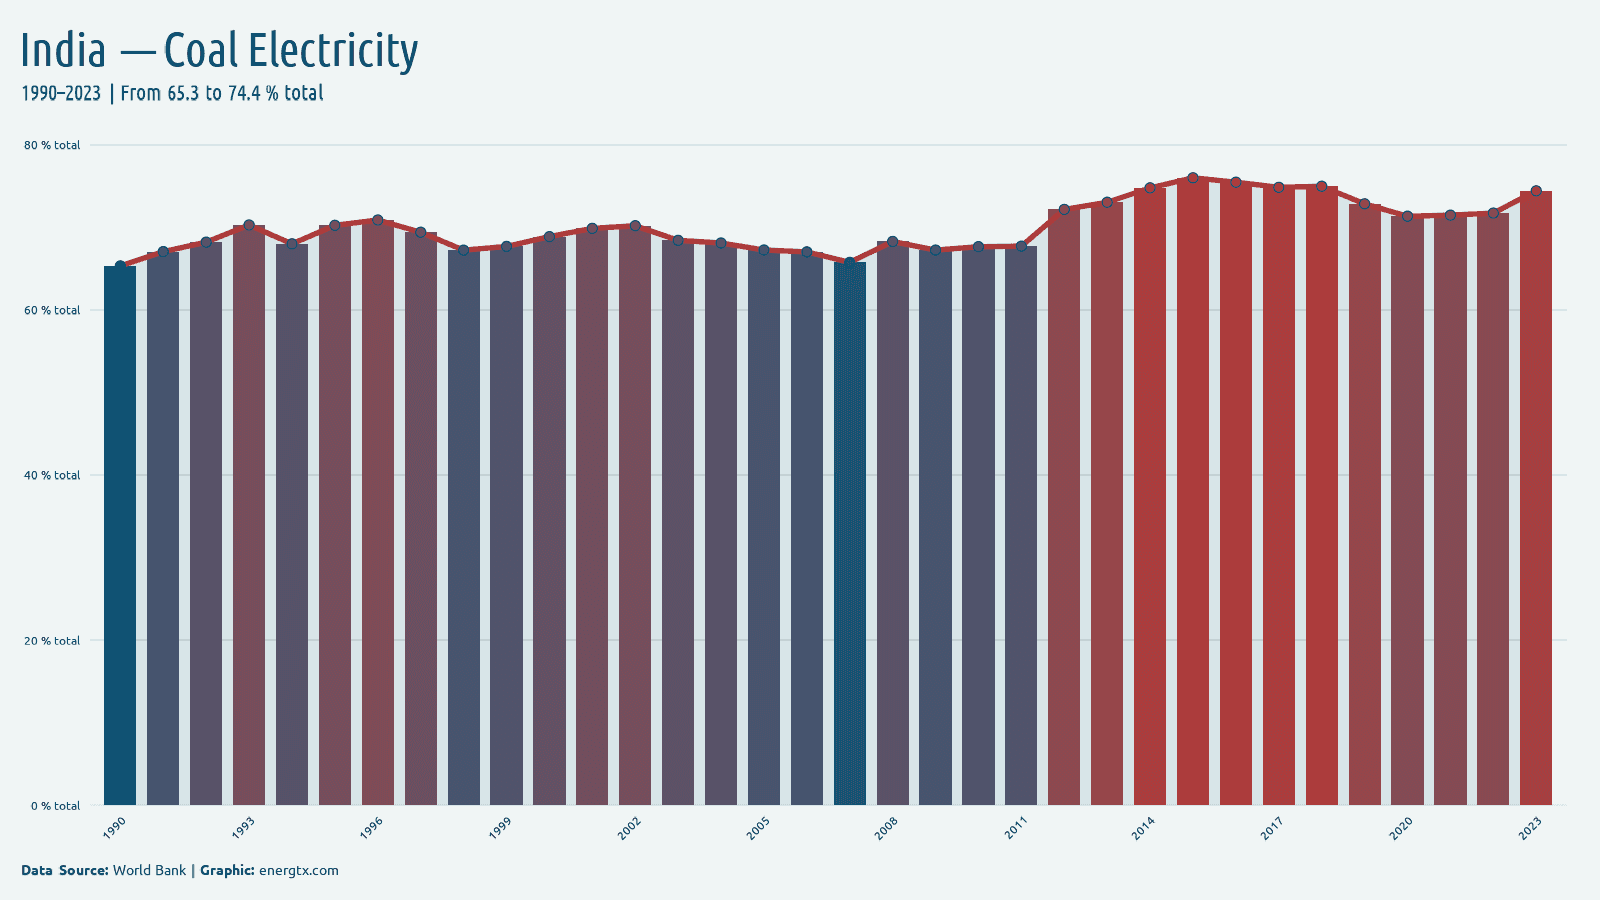
2023
Coal Electricity
74.4%
%
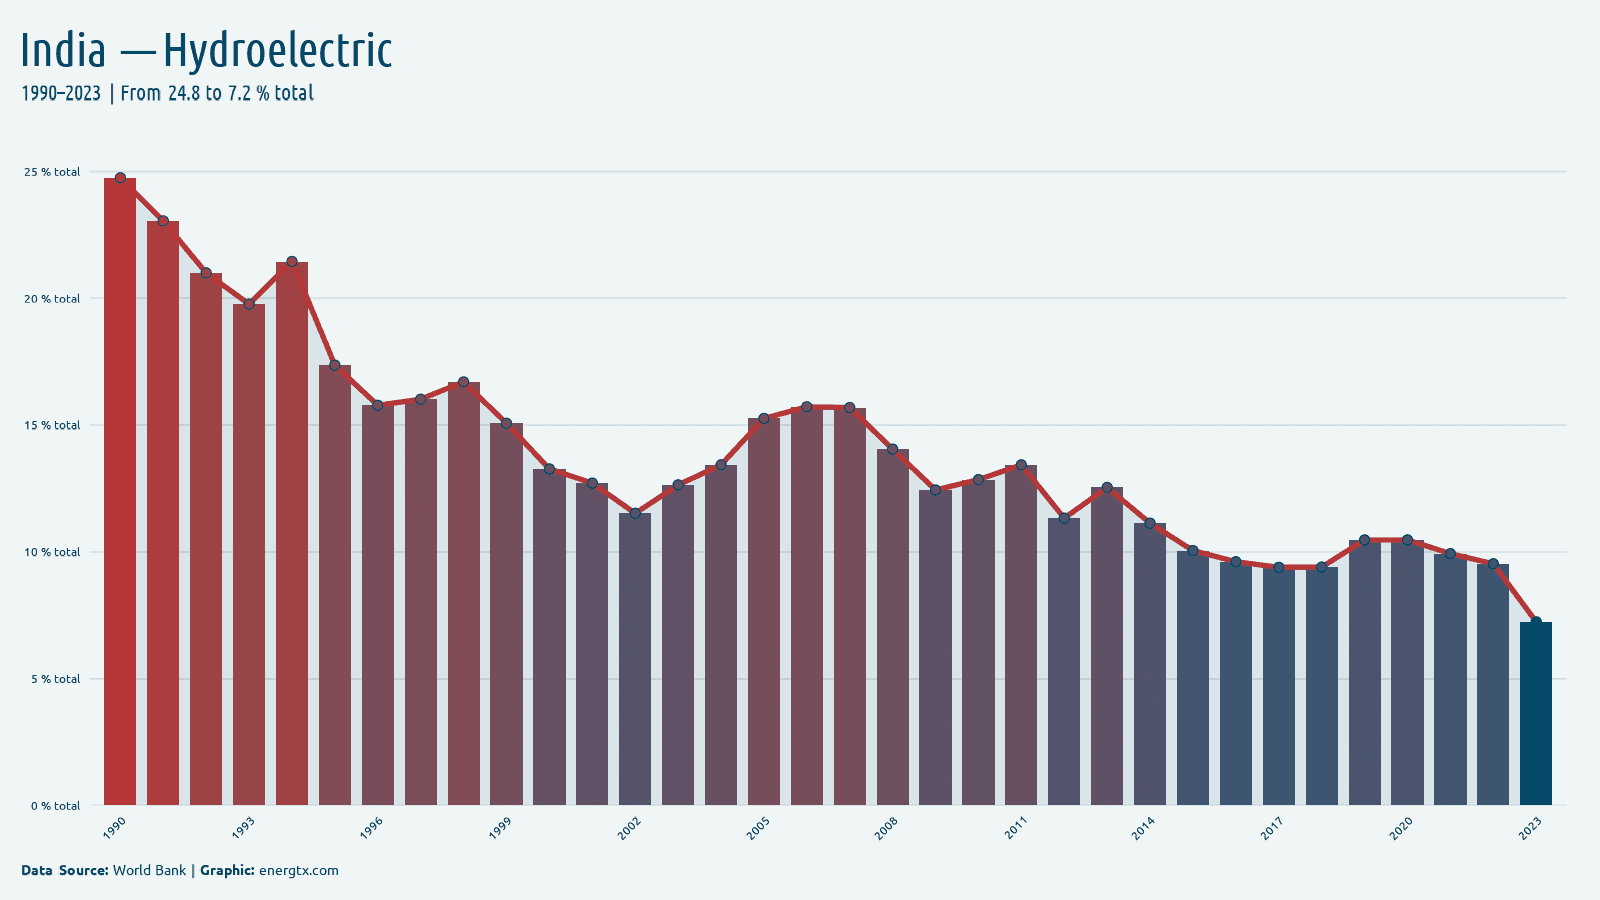
2023
Hydroelectric
7.2%
%
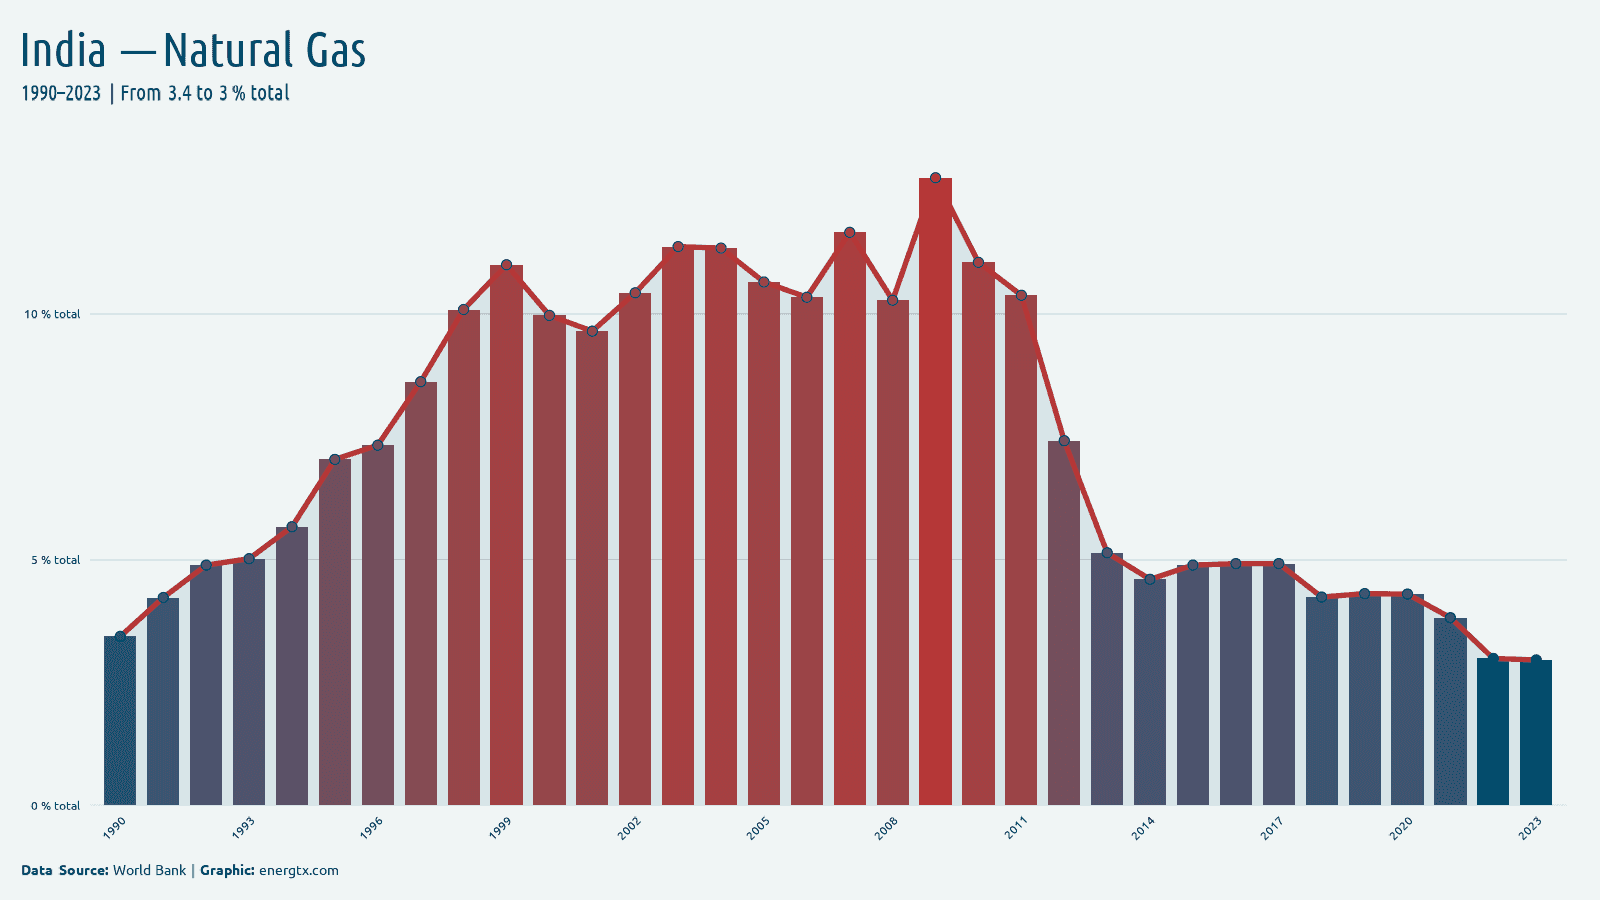
2023
Natural Gas
3.0%
%
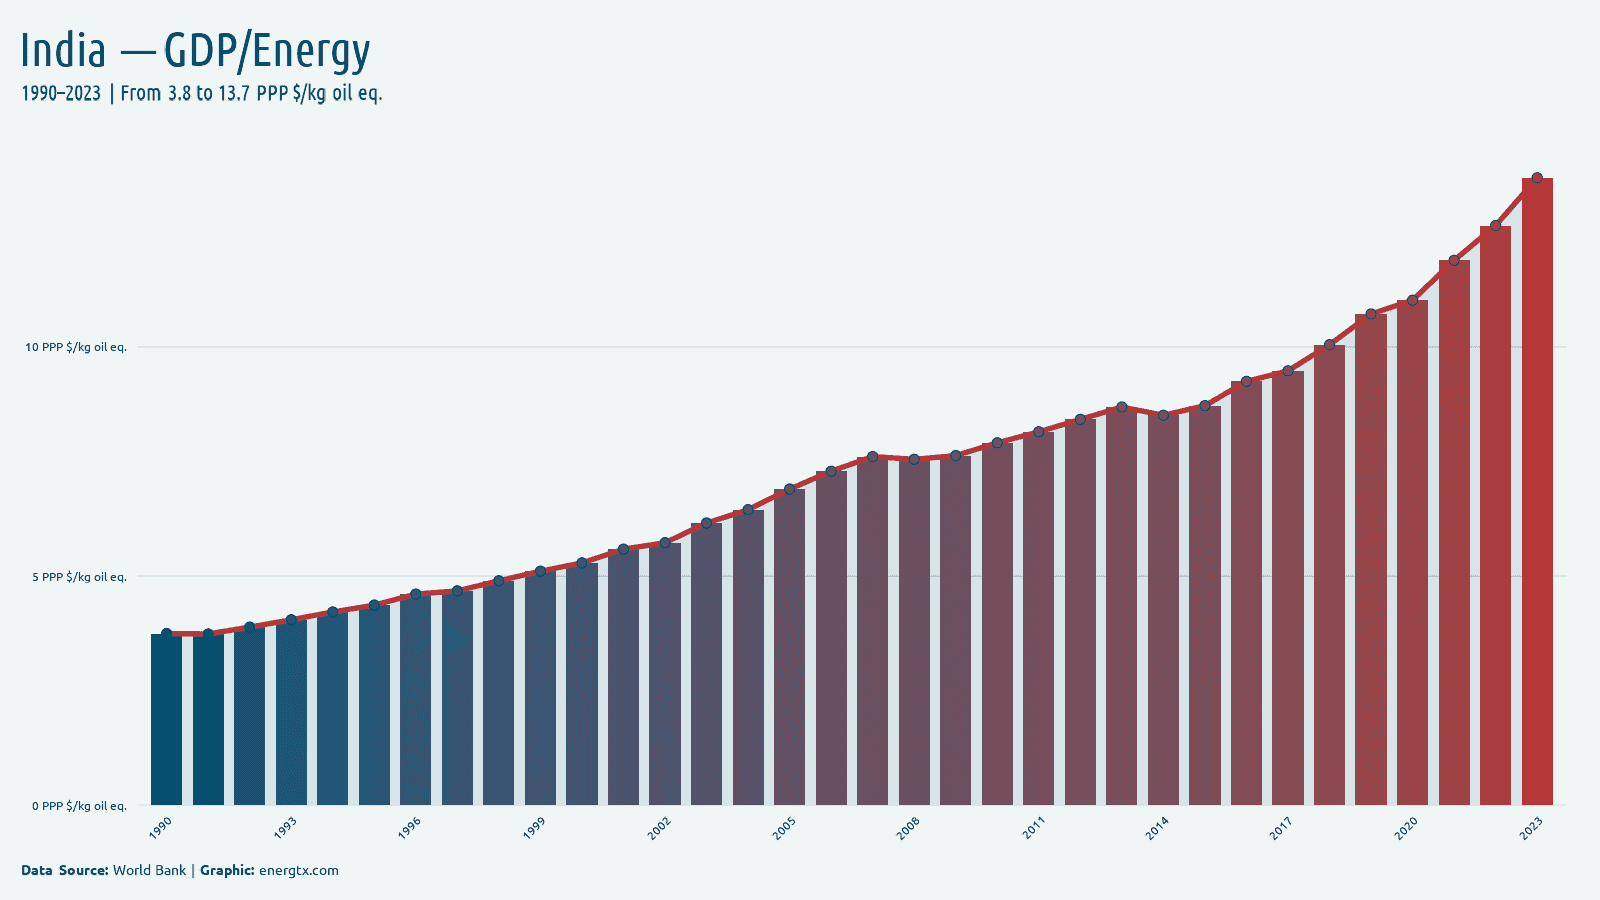
2023
GDP/Energy
13.7
PPP $/kg oil eq.
2023
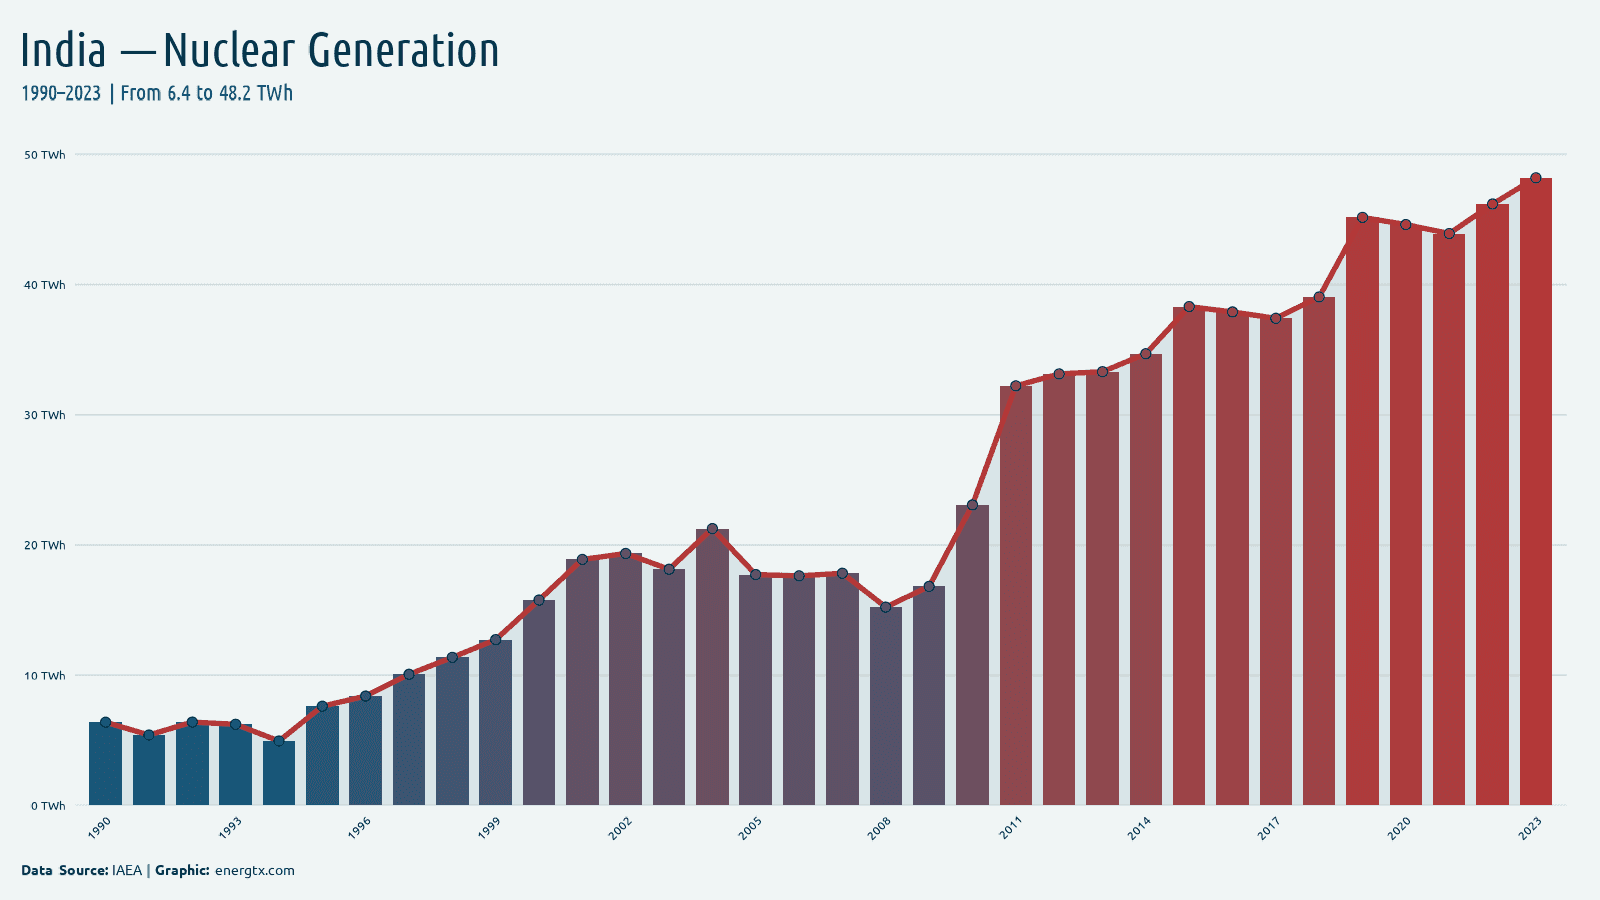
Nuclear Generation
48.2
TWh
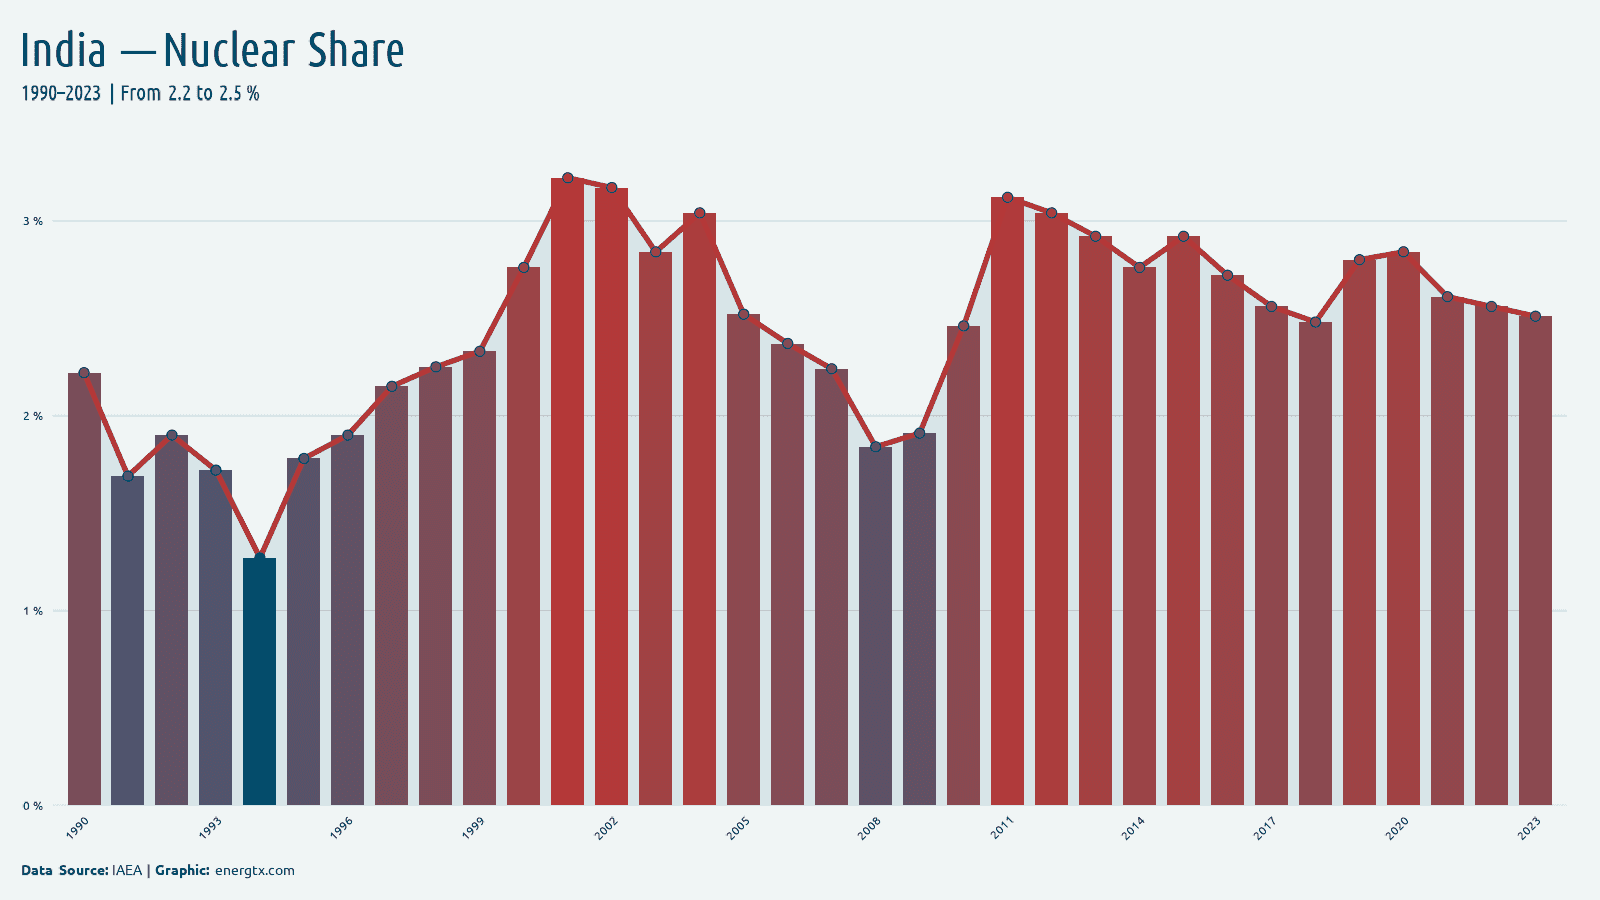
2023
Nuclear Share
2.5%
%
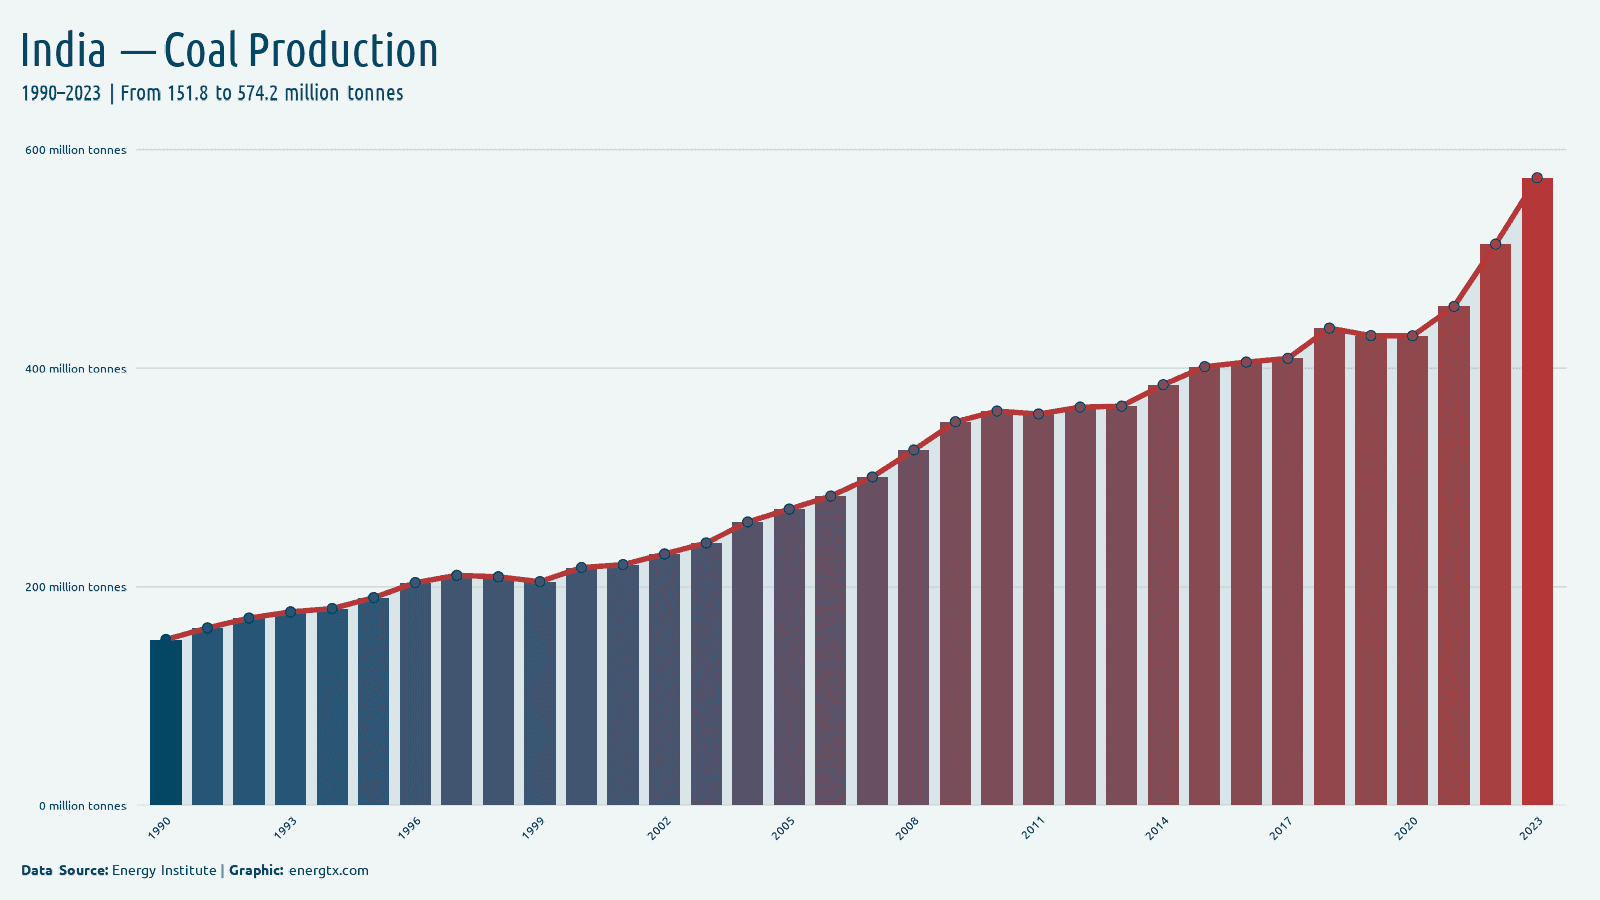
2023
Coal Production
574.2
Mt
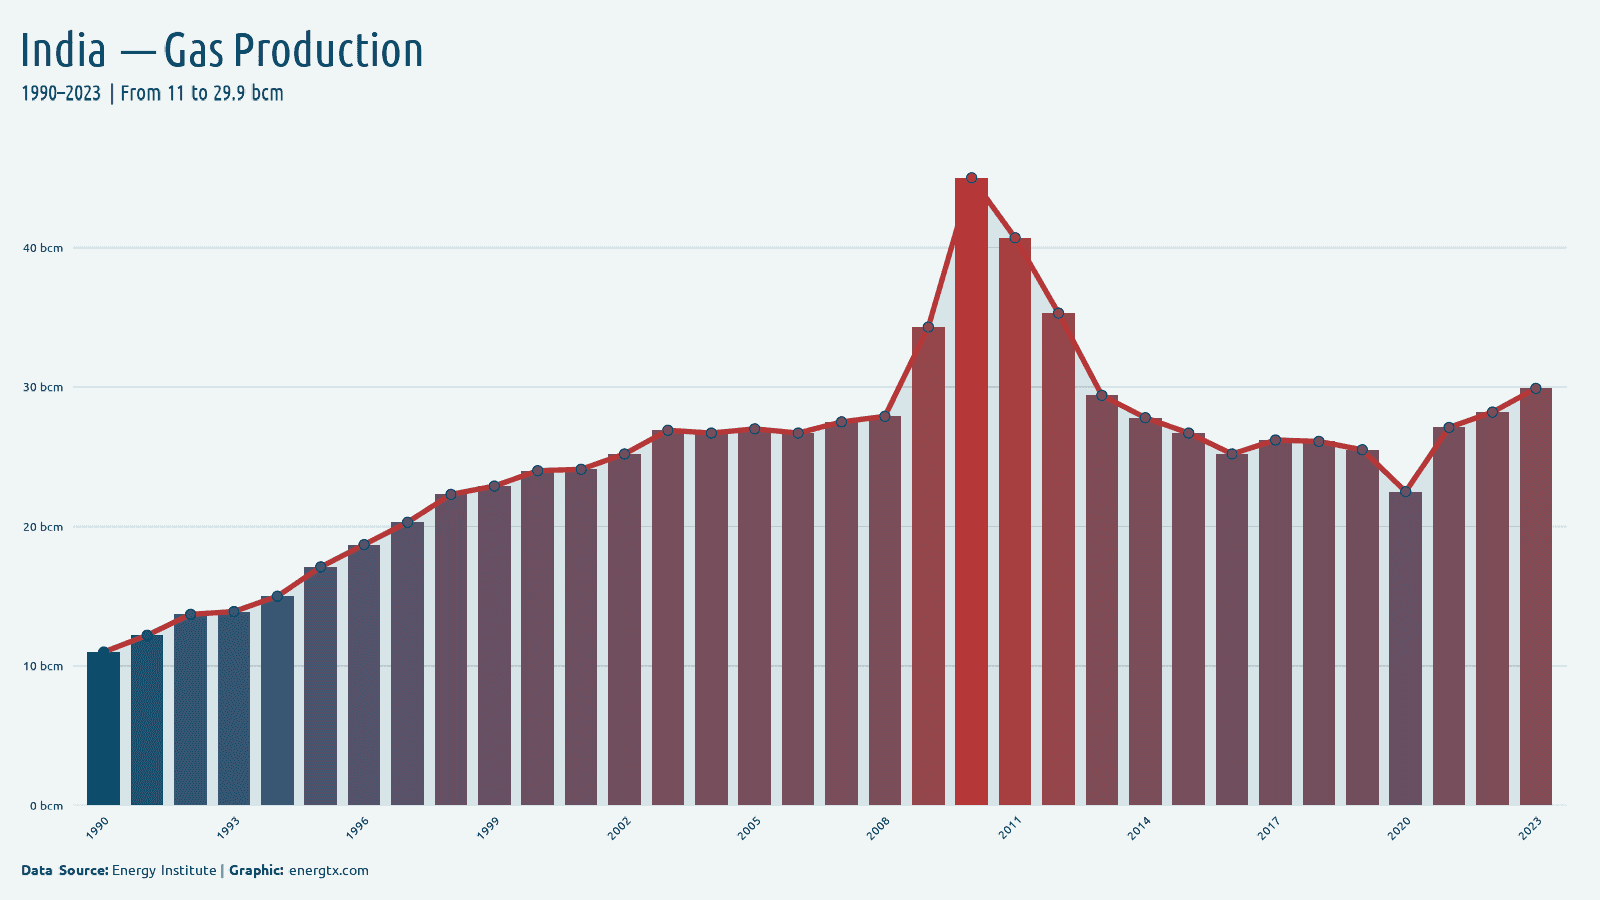
2023
Gas Production
29.9
bcm
2023
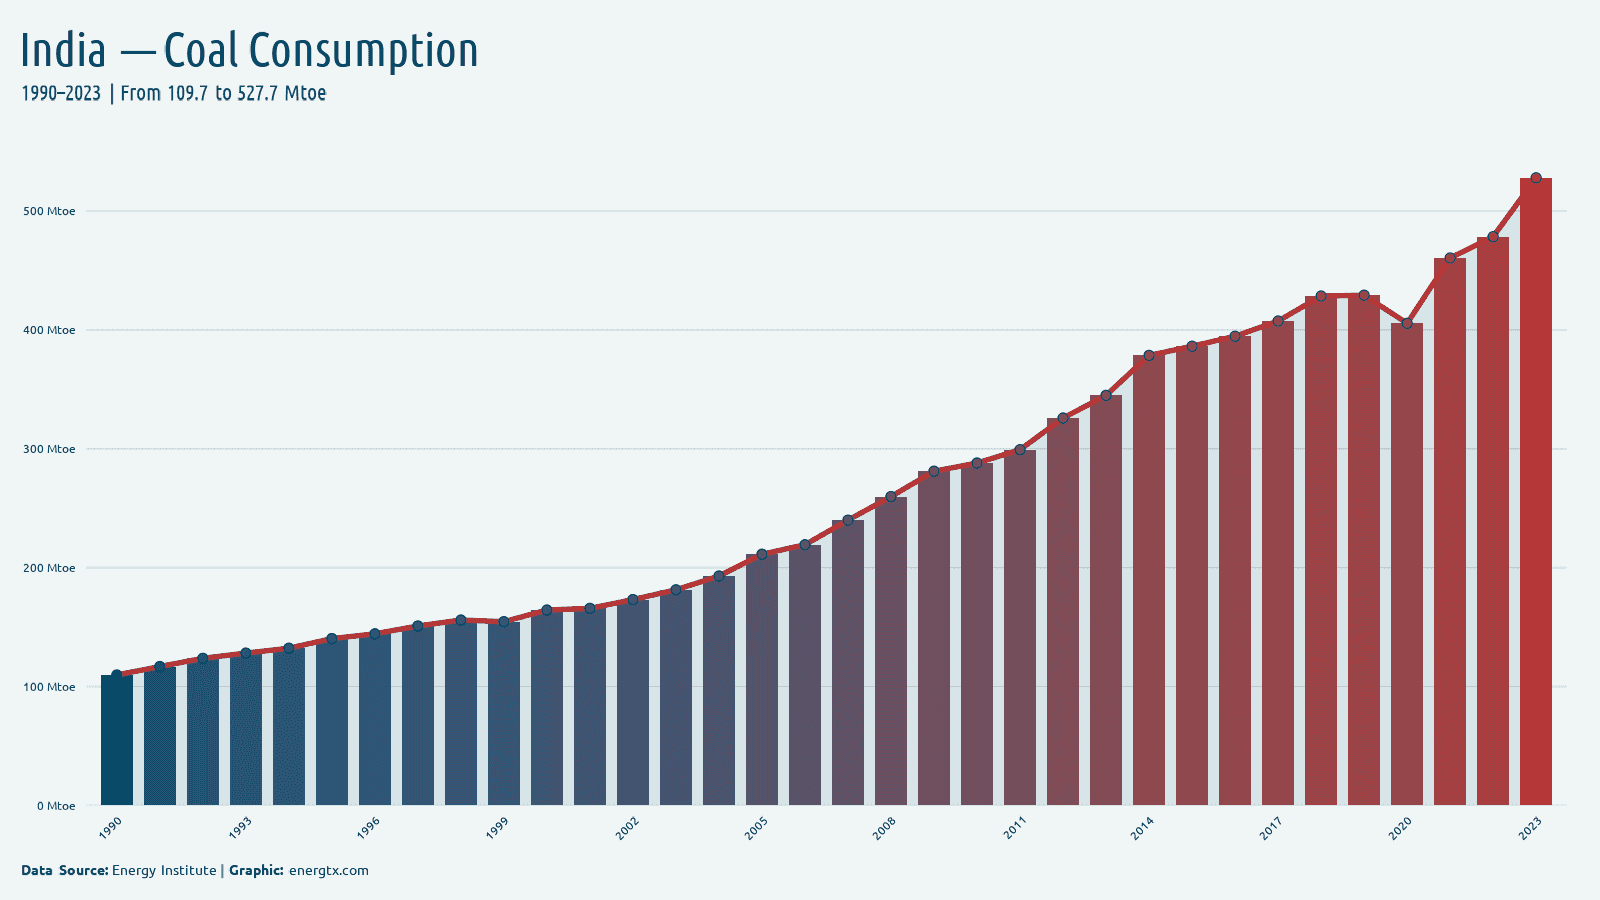
Coal Consumption
527.7
Mtoe
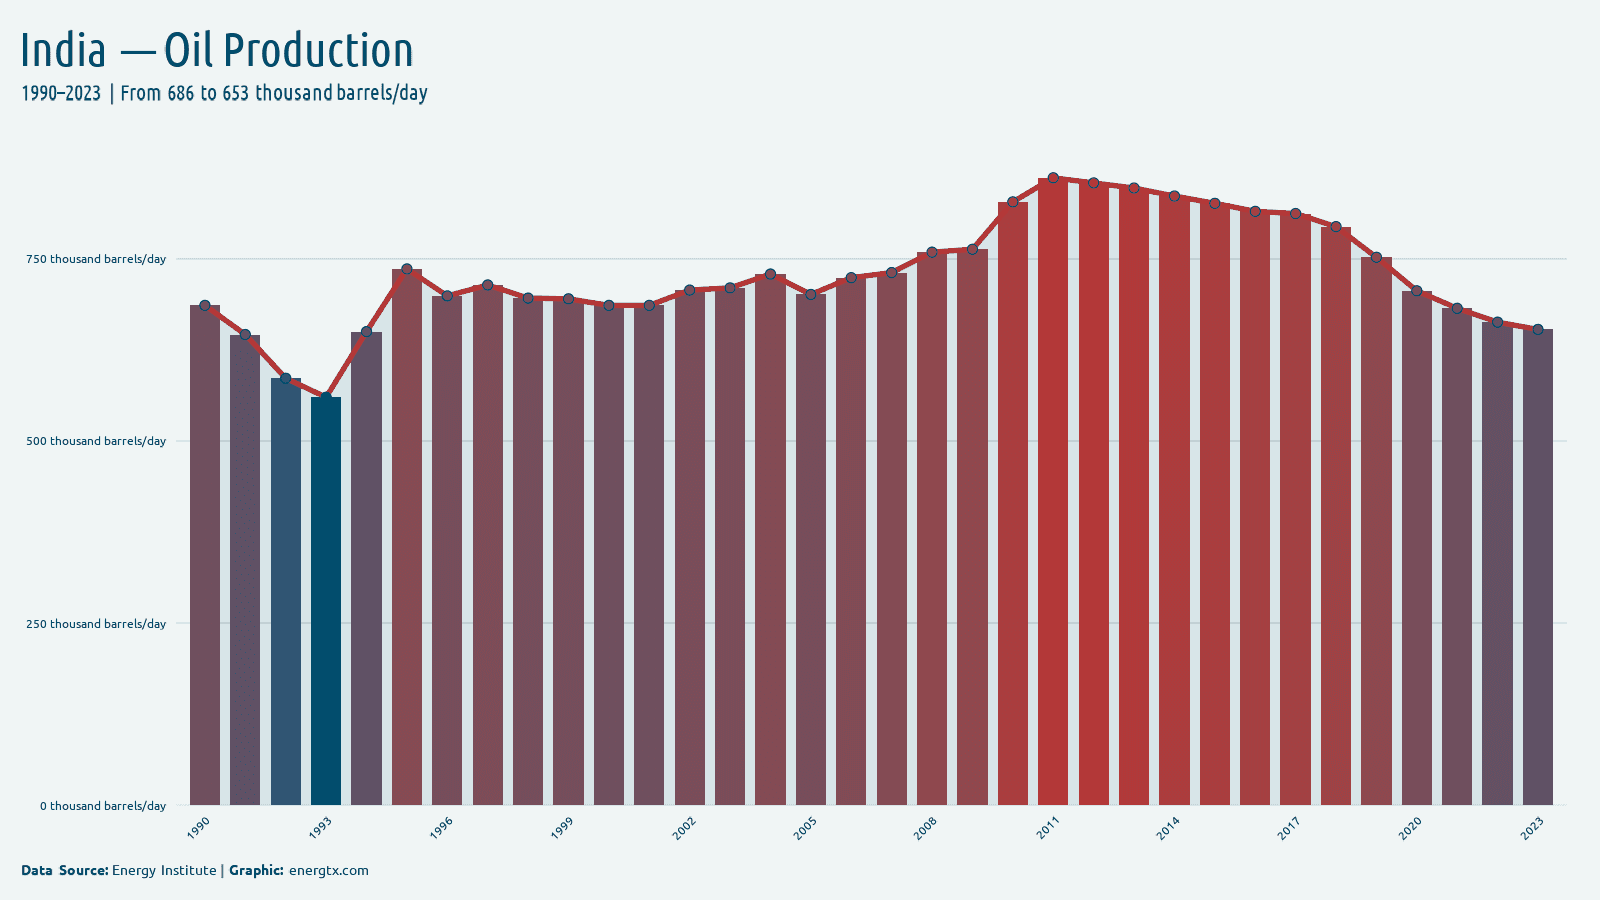
2023
Oil Production
653.0
k barrels/day
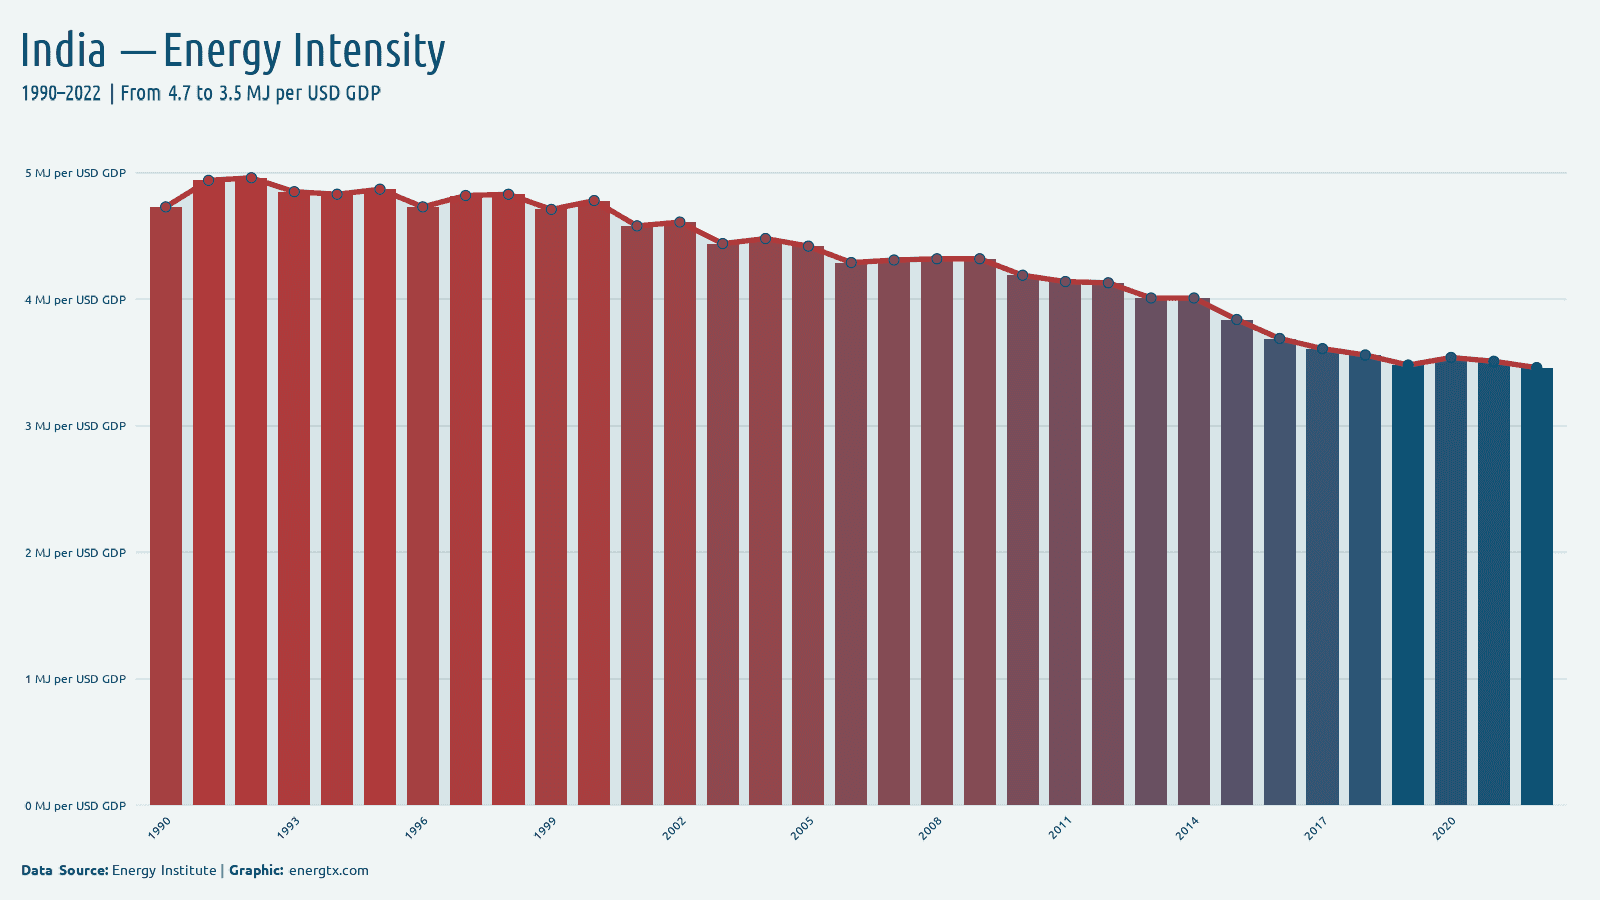
2022
Energy Intensity
3.5
MJ/$ GDP
2023
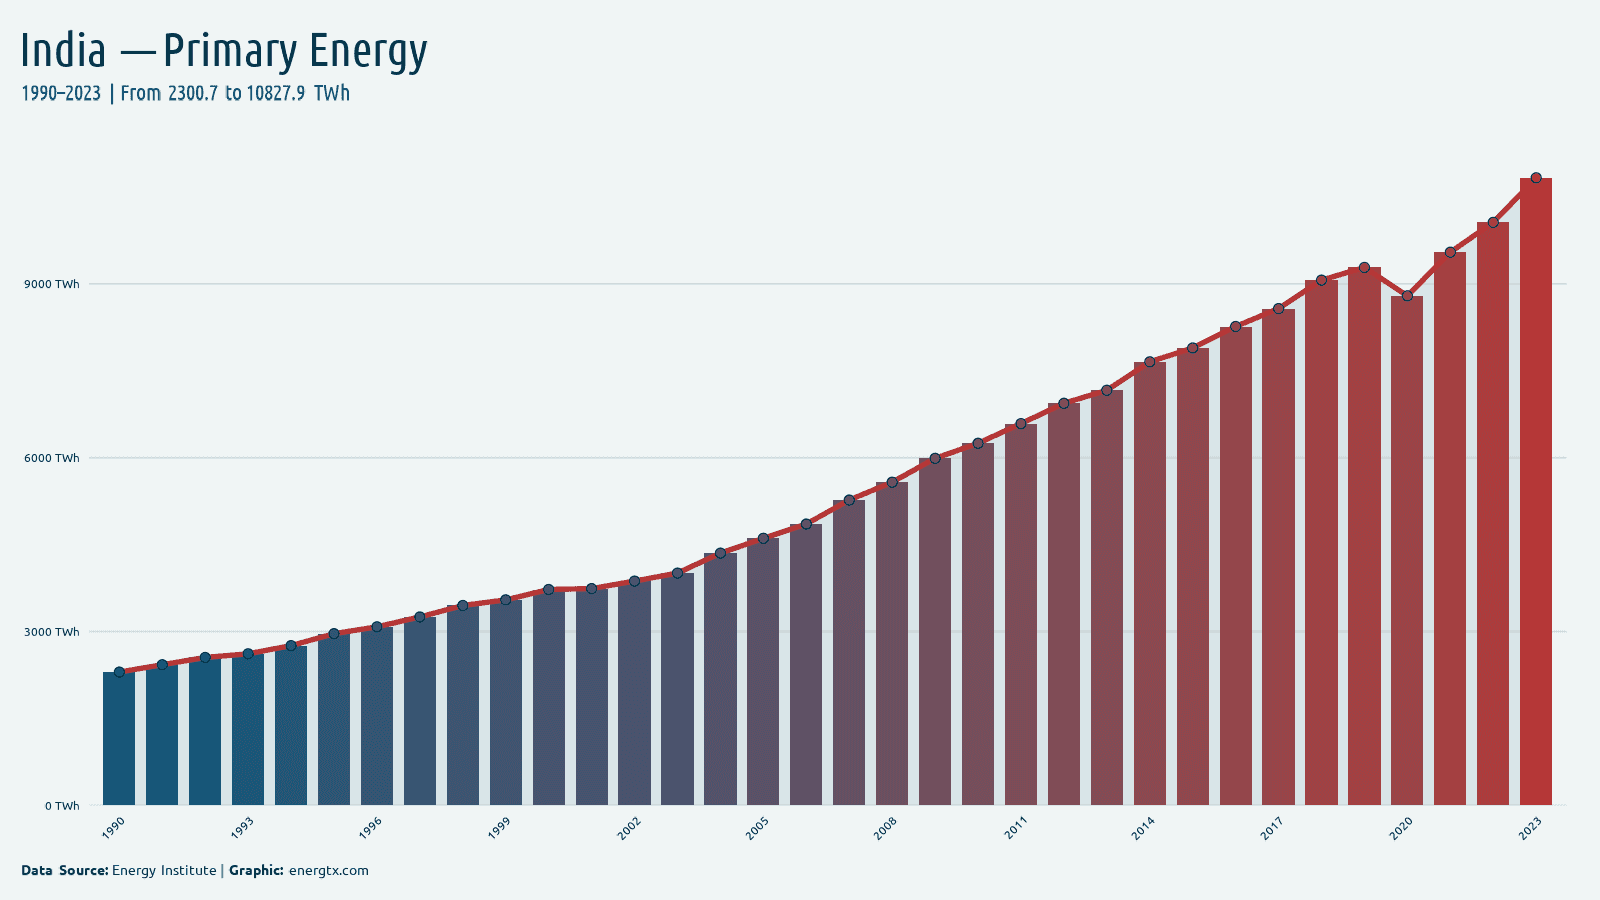
Primary Energy
10.8k
TWh
2023
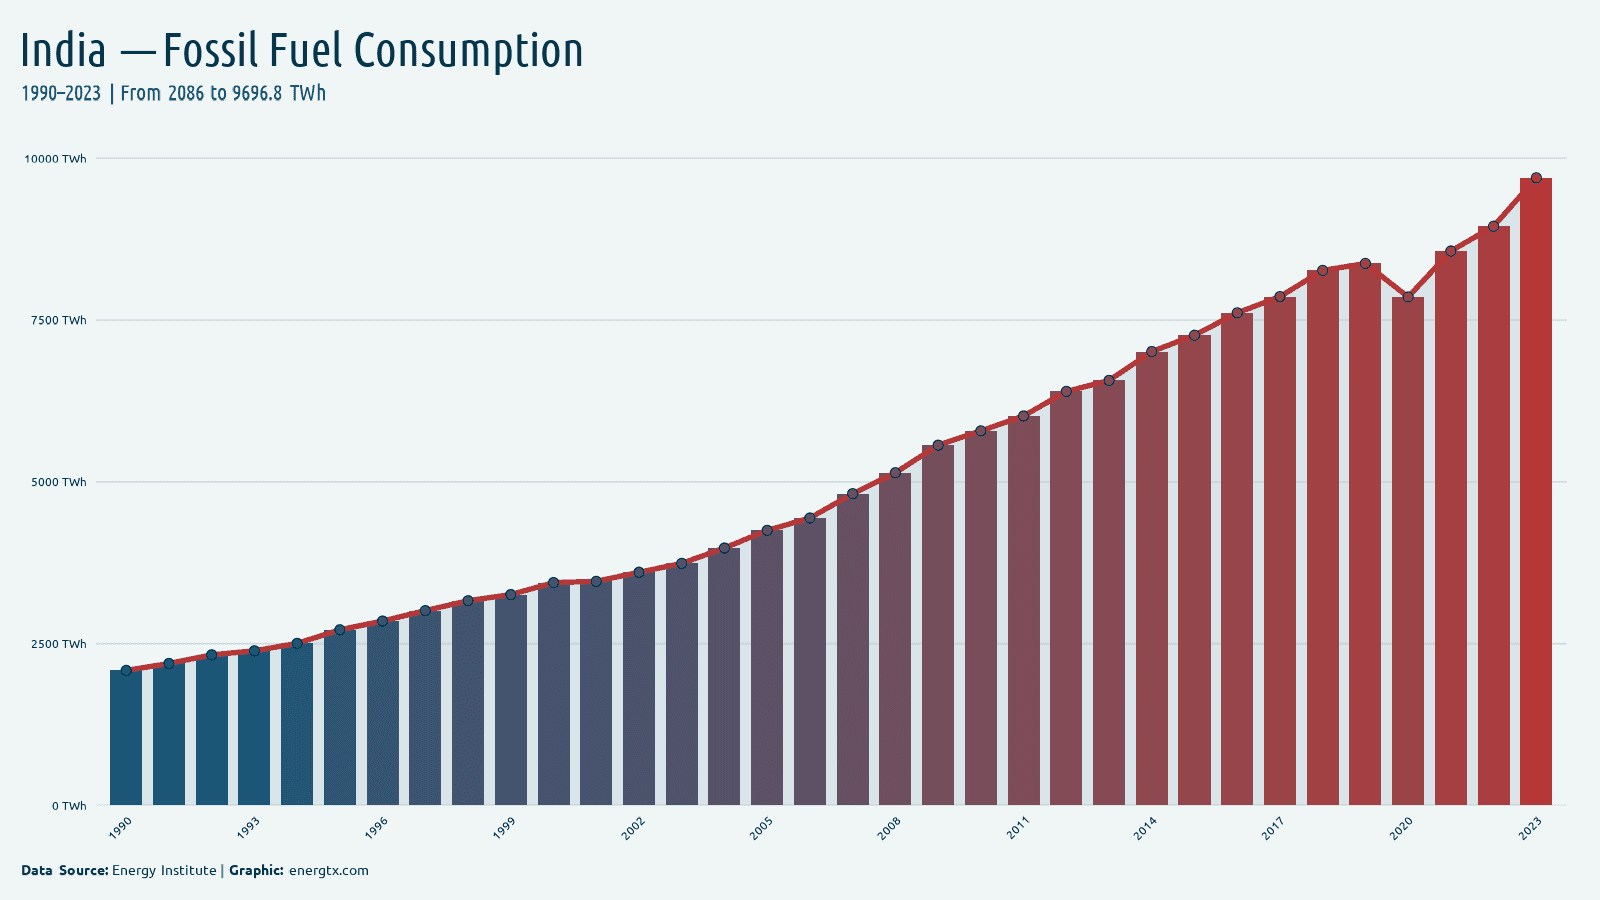
Fossil Fuel Consumption
9.7k
TWh
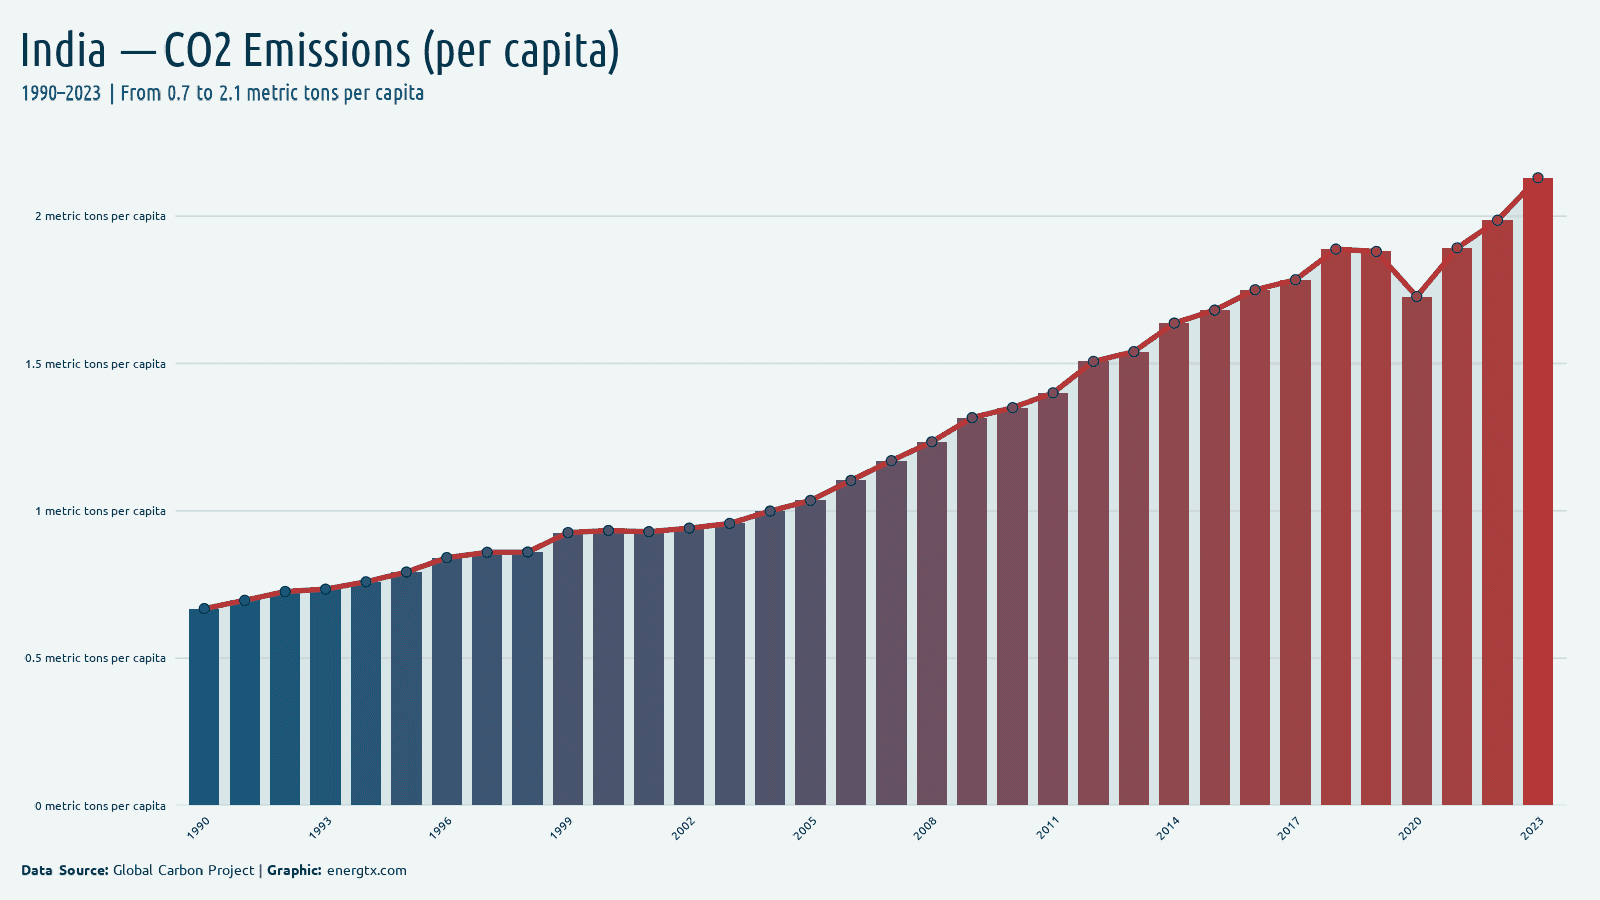
2023
CO2 Emissions (per capita)
2.1
metric tons/capita
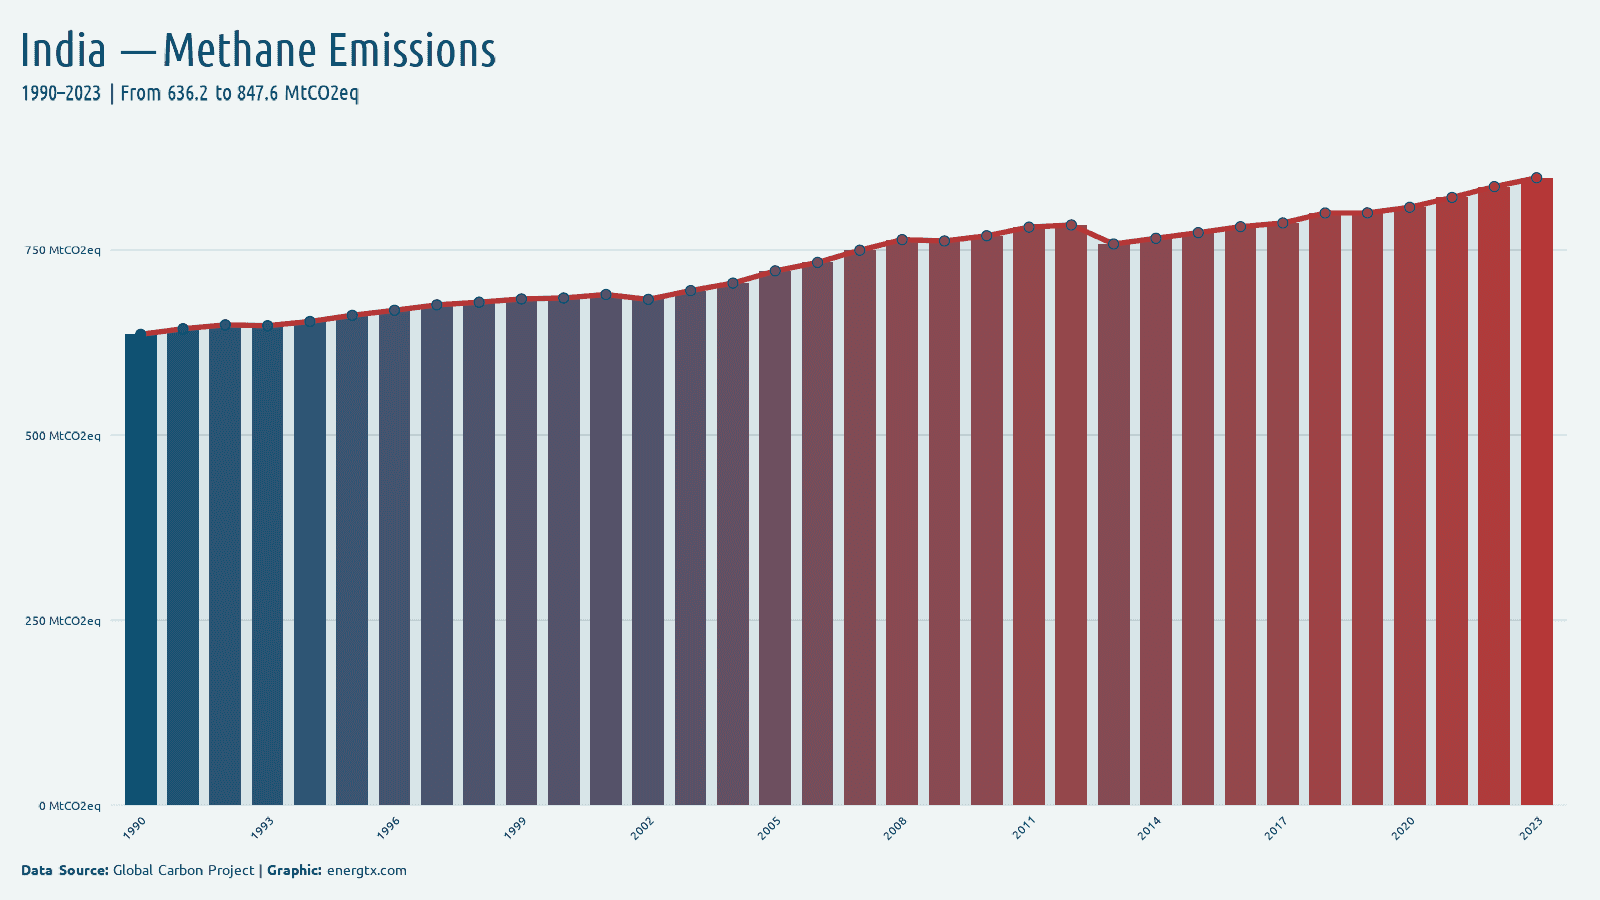
2023
Methane Emissions
847.6
MtCO2eq
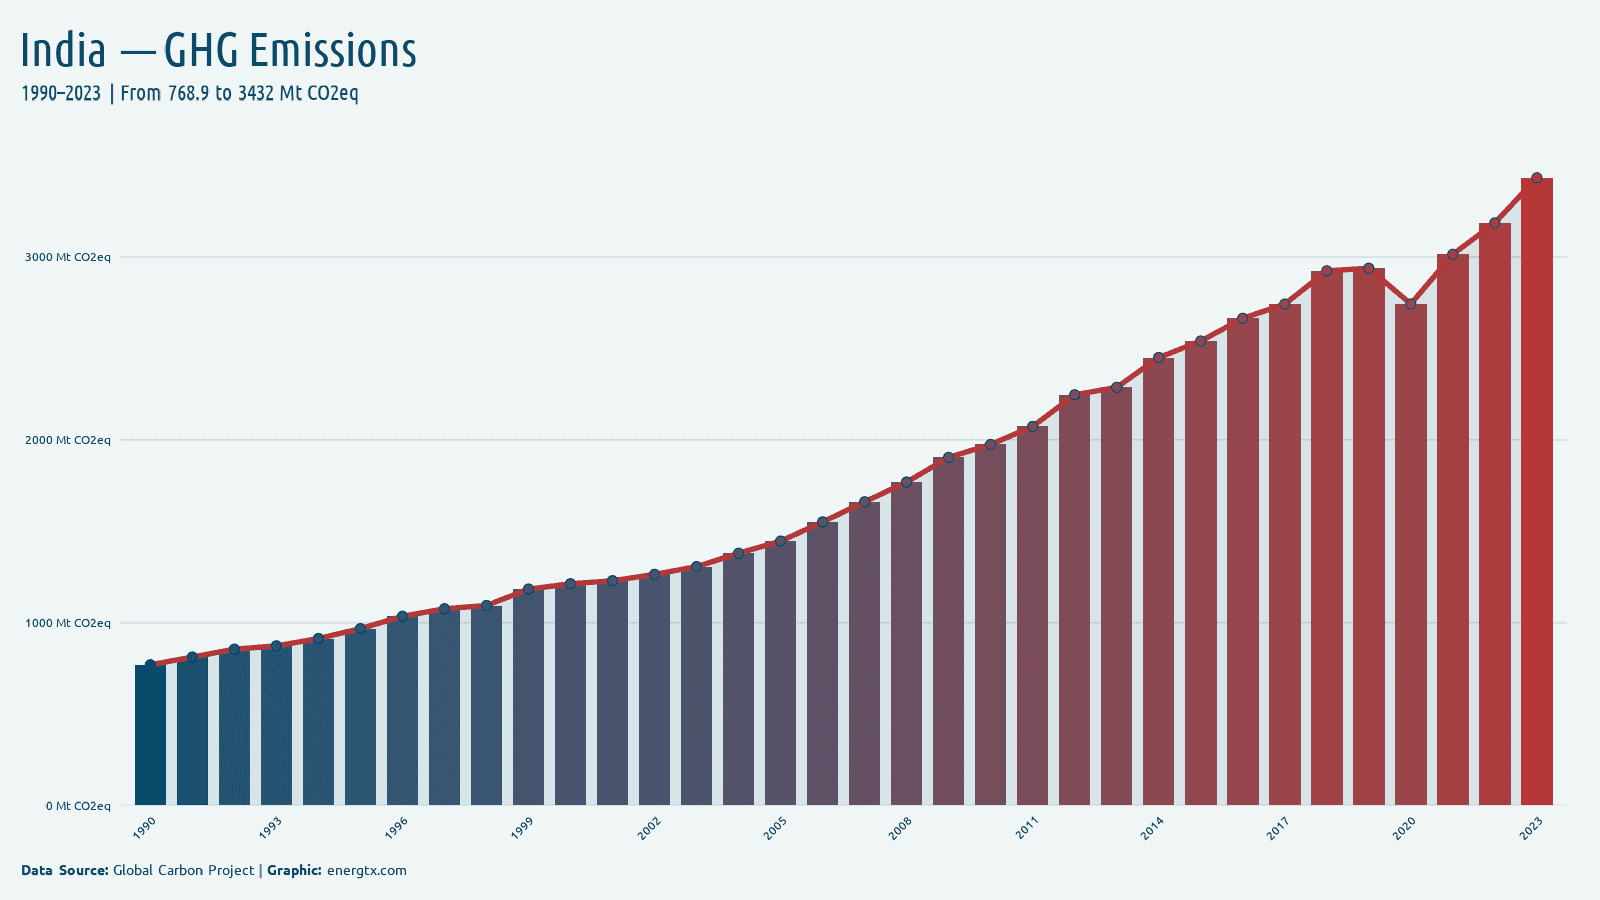
2023
GHG Emissions
3.4k
MtCO2eq
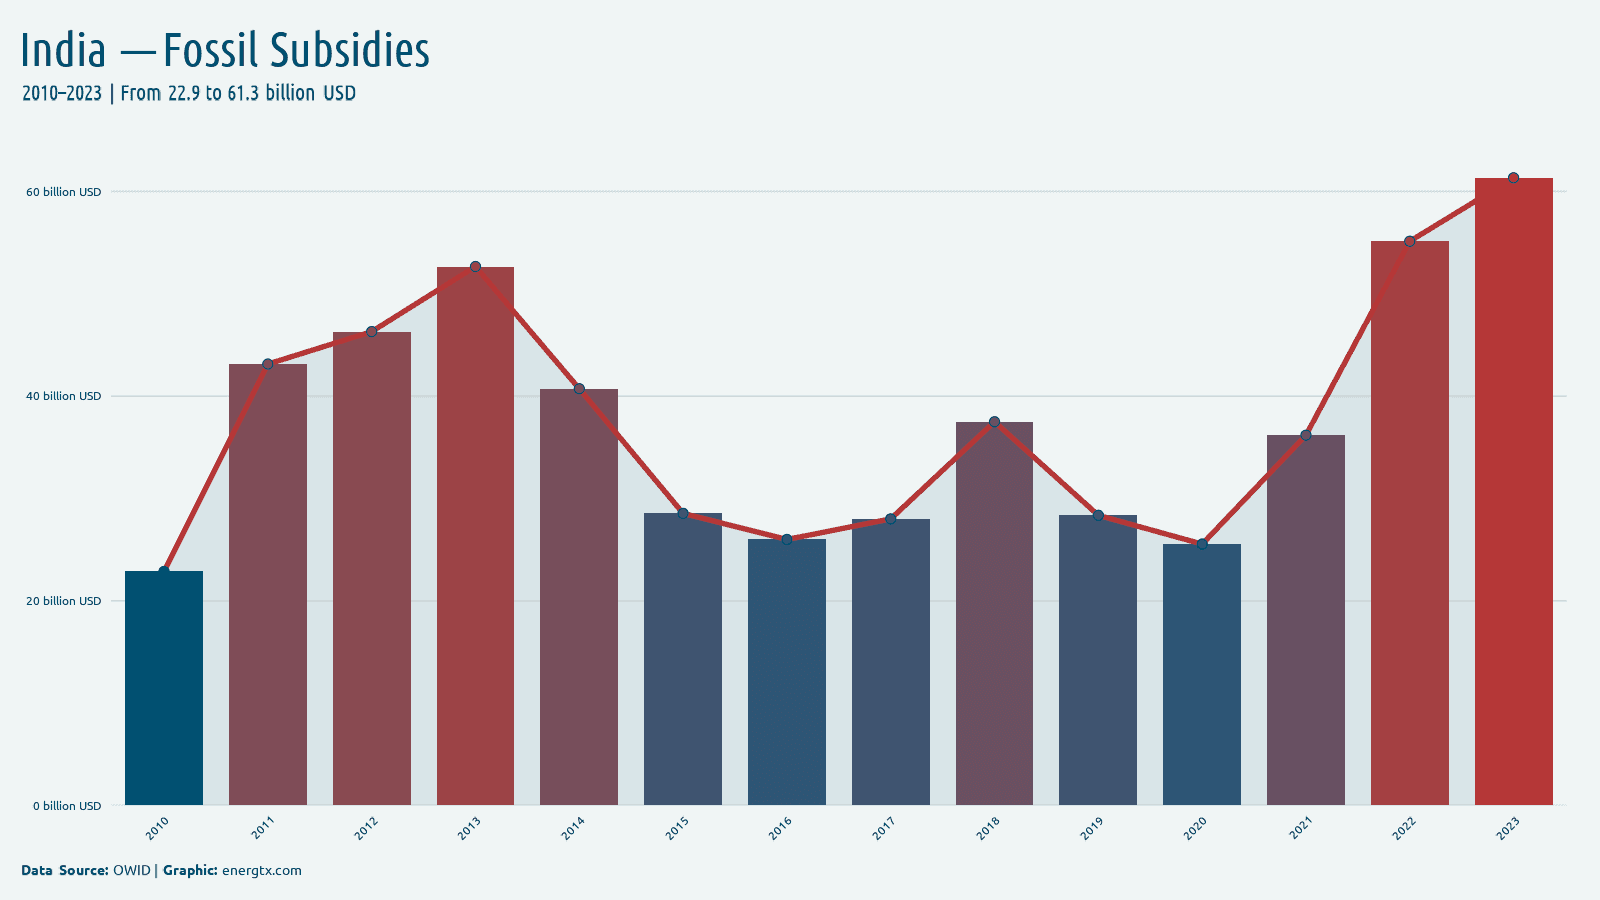
2023
Fossil Subsidies
61.3
billion $
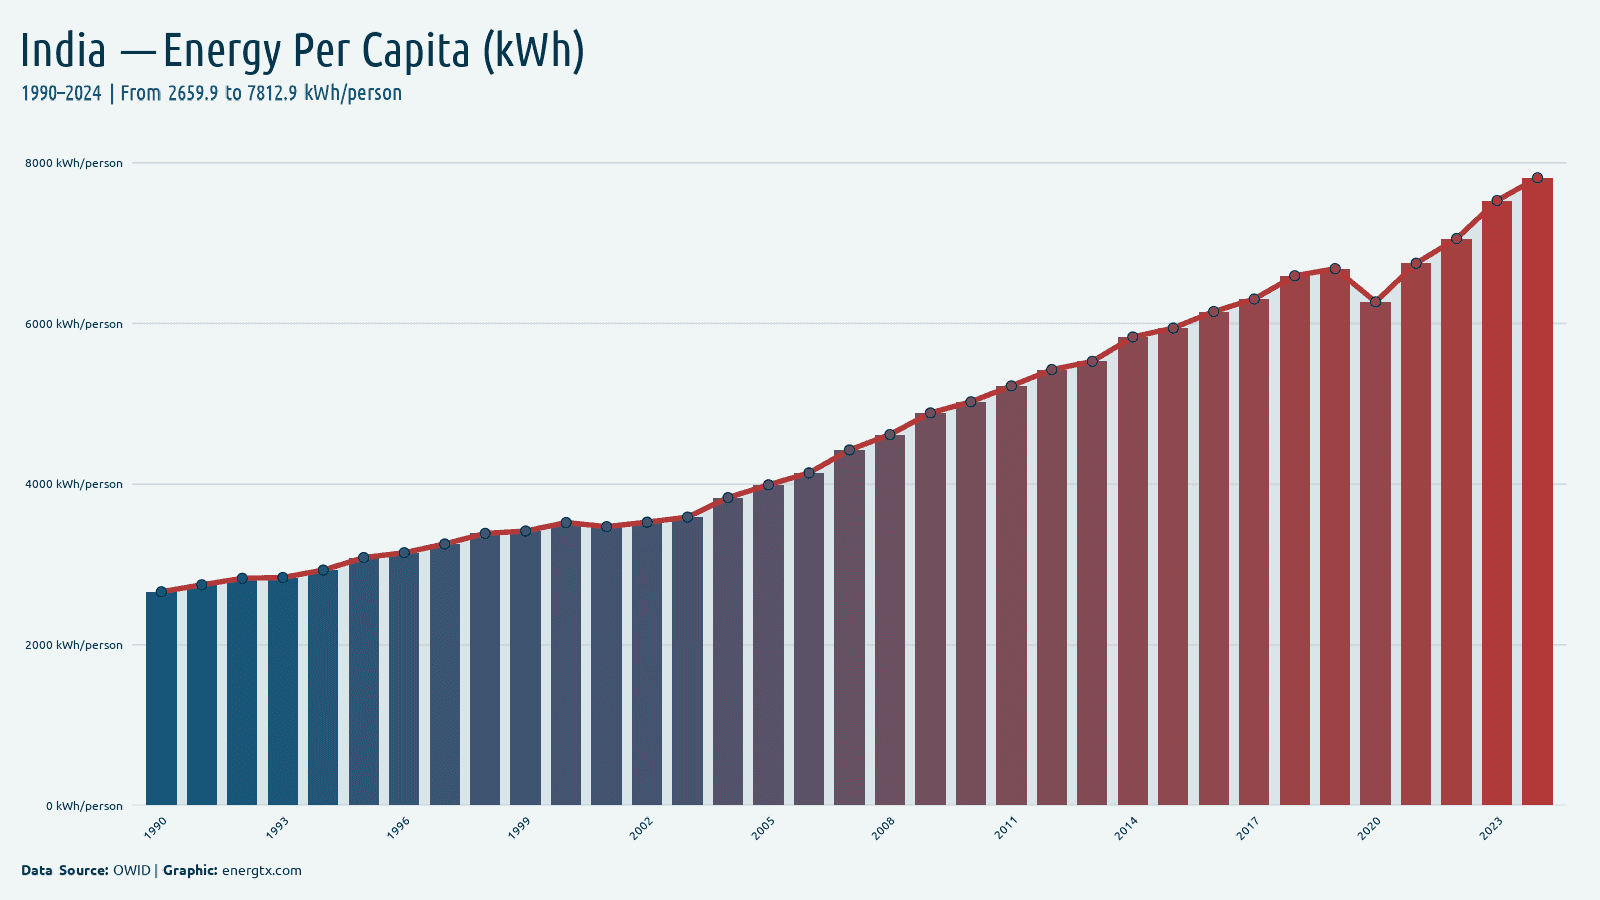
2024
Energy Use Per Capita (kWh)
7.8k
kWh/capita
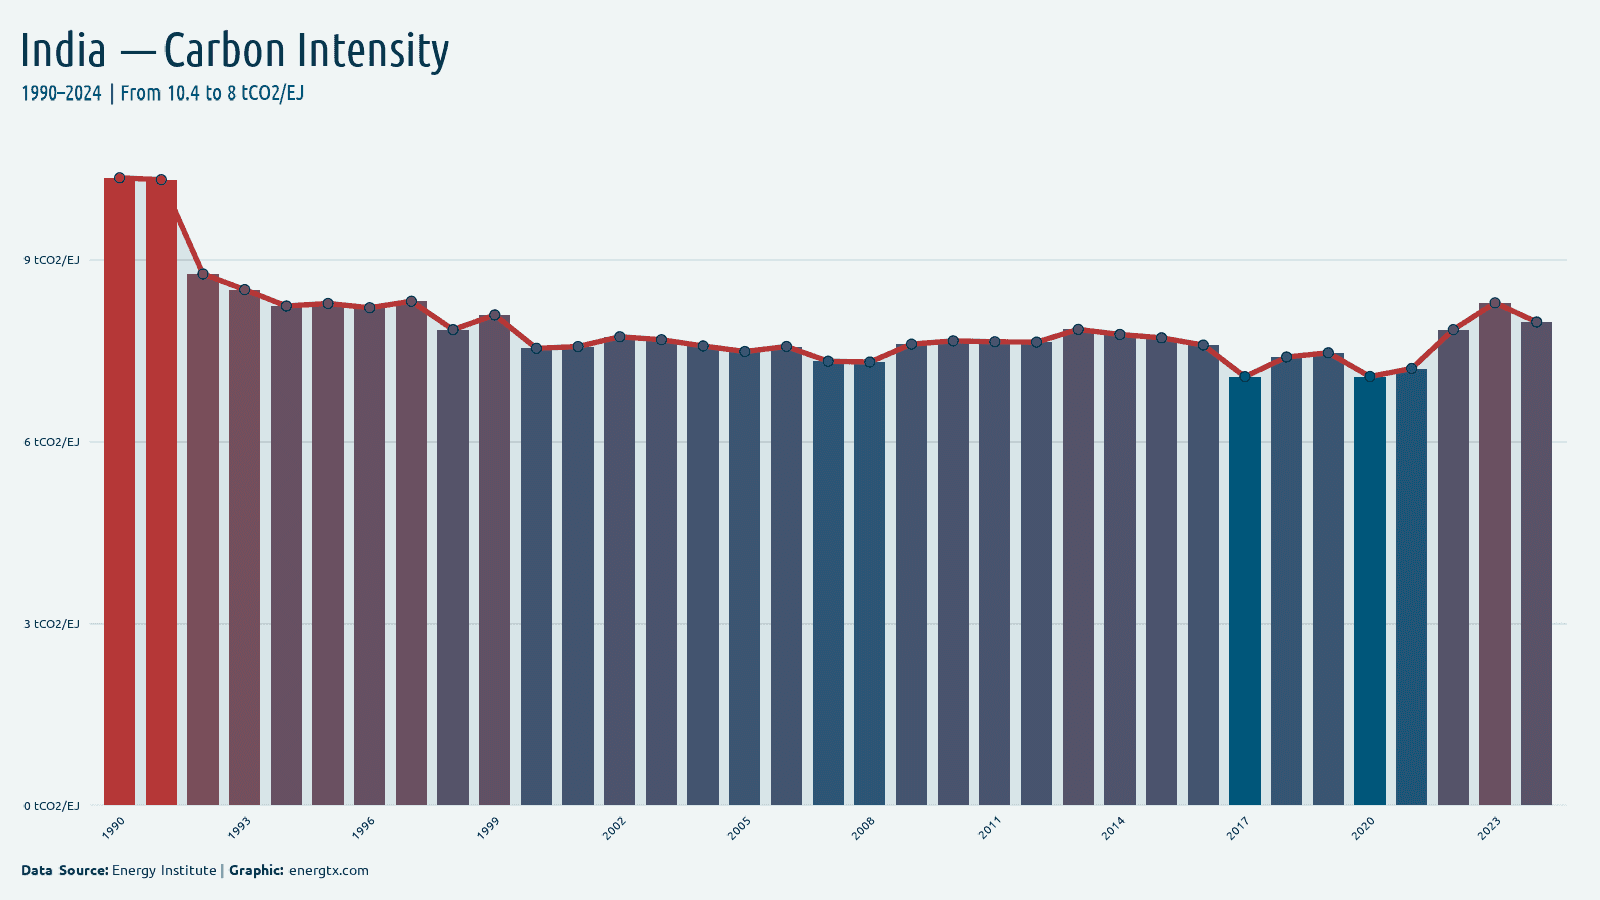
2024
Carbon Intensity
8.0
tCO2/EJ
2024
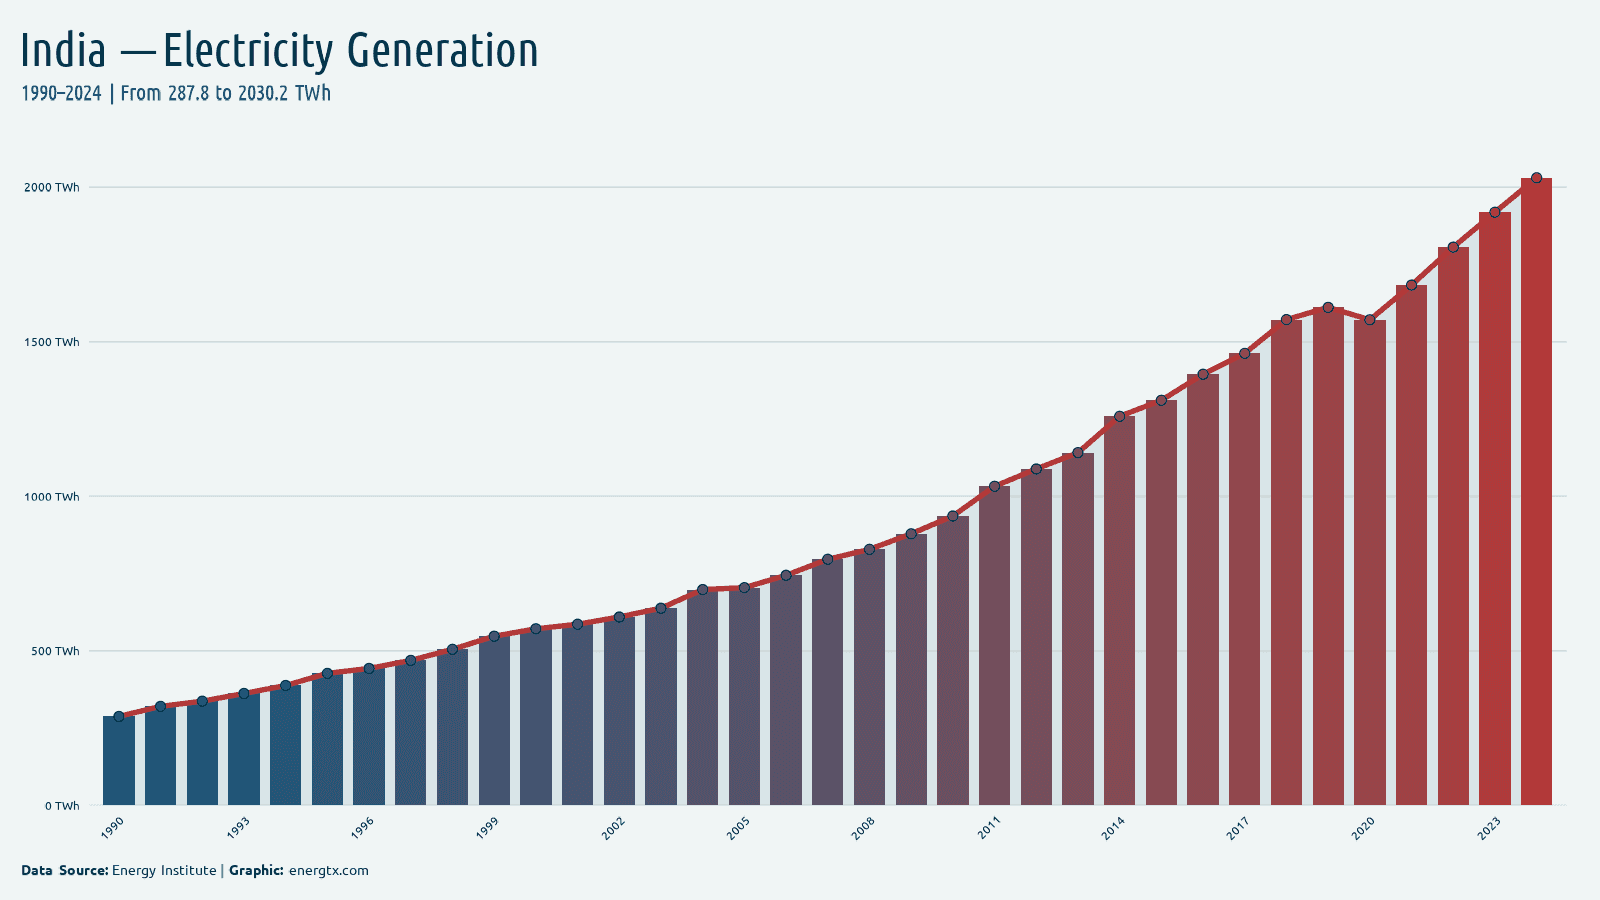
Electricity Generation
2.0k
TWh
2024
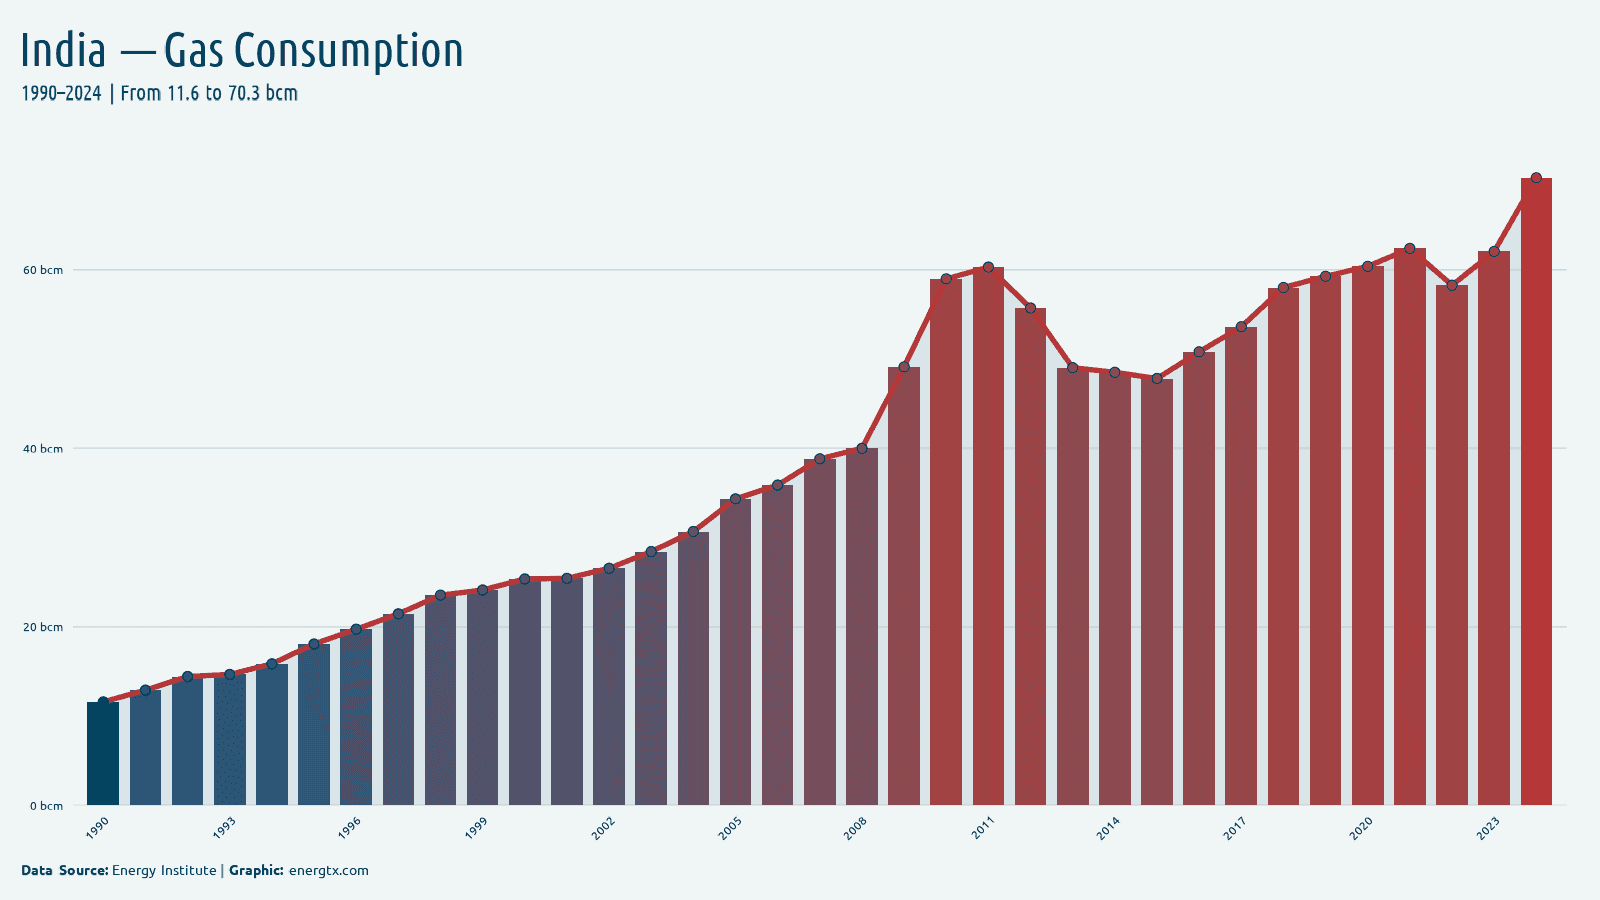
Gas Consumption
70.3
bcm
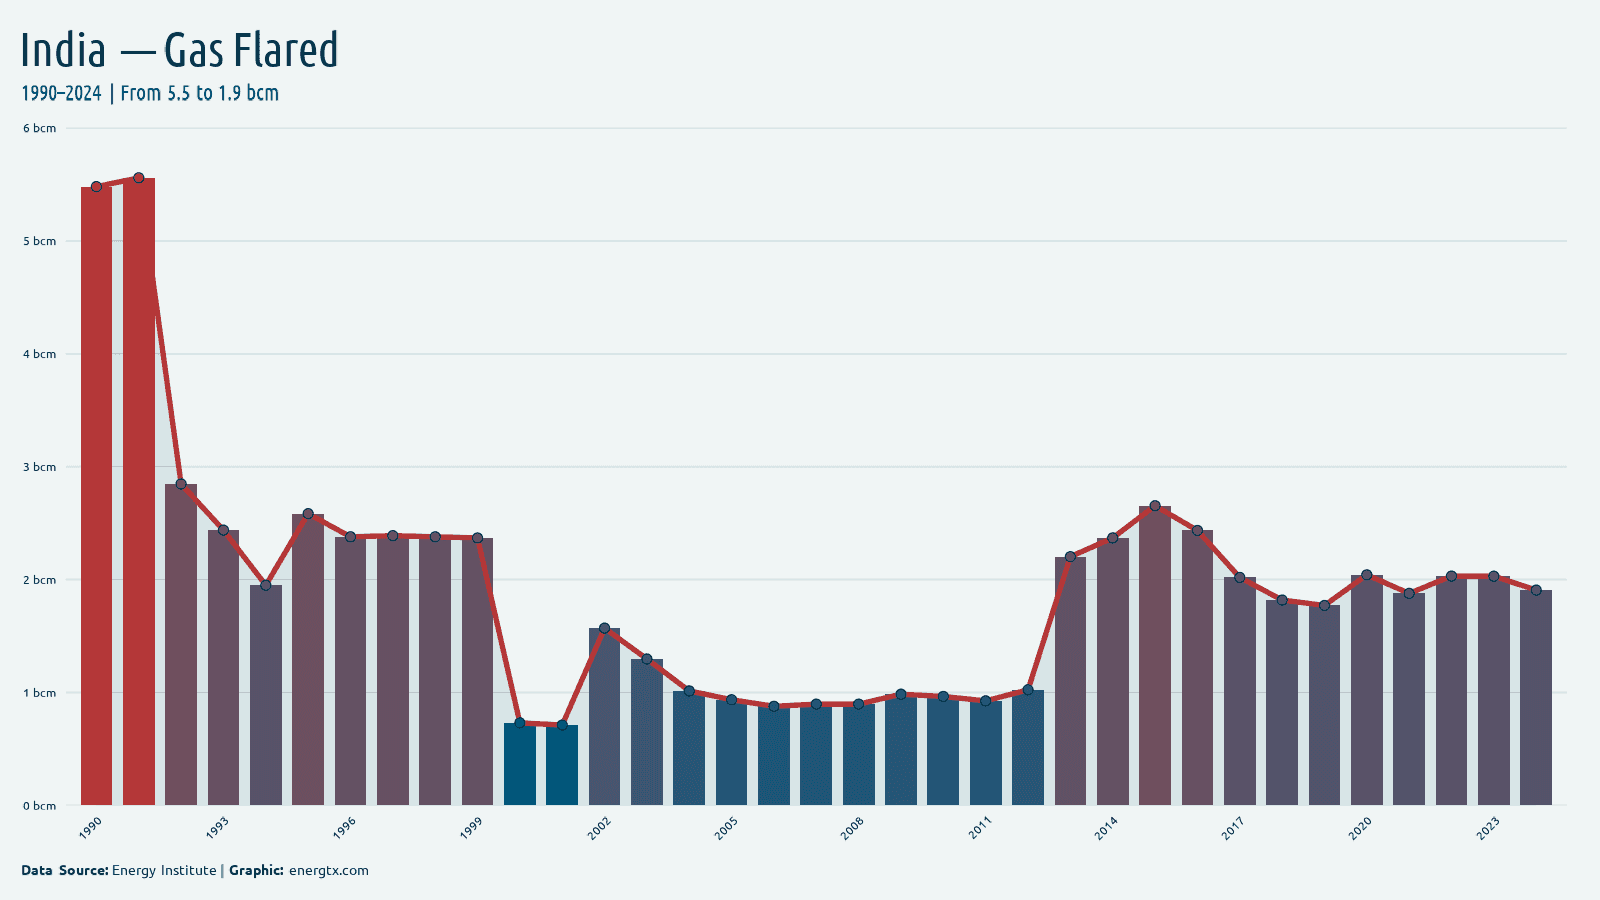
2024
Gas Flared
1.9
bcm
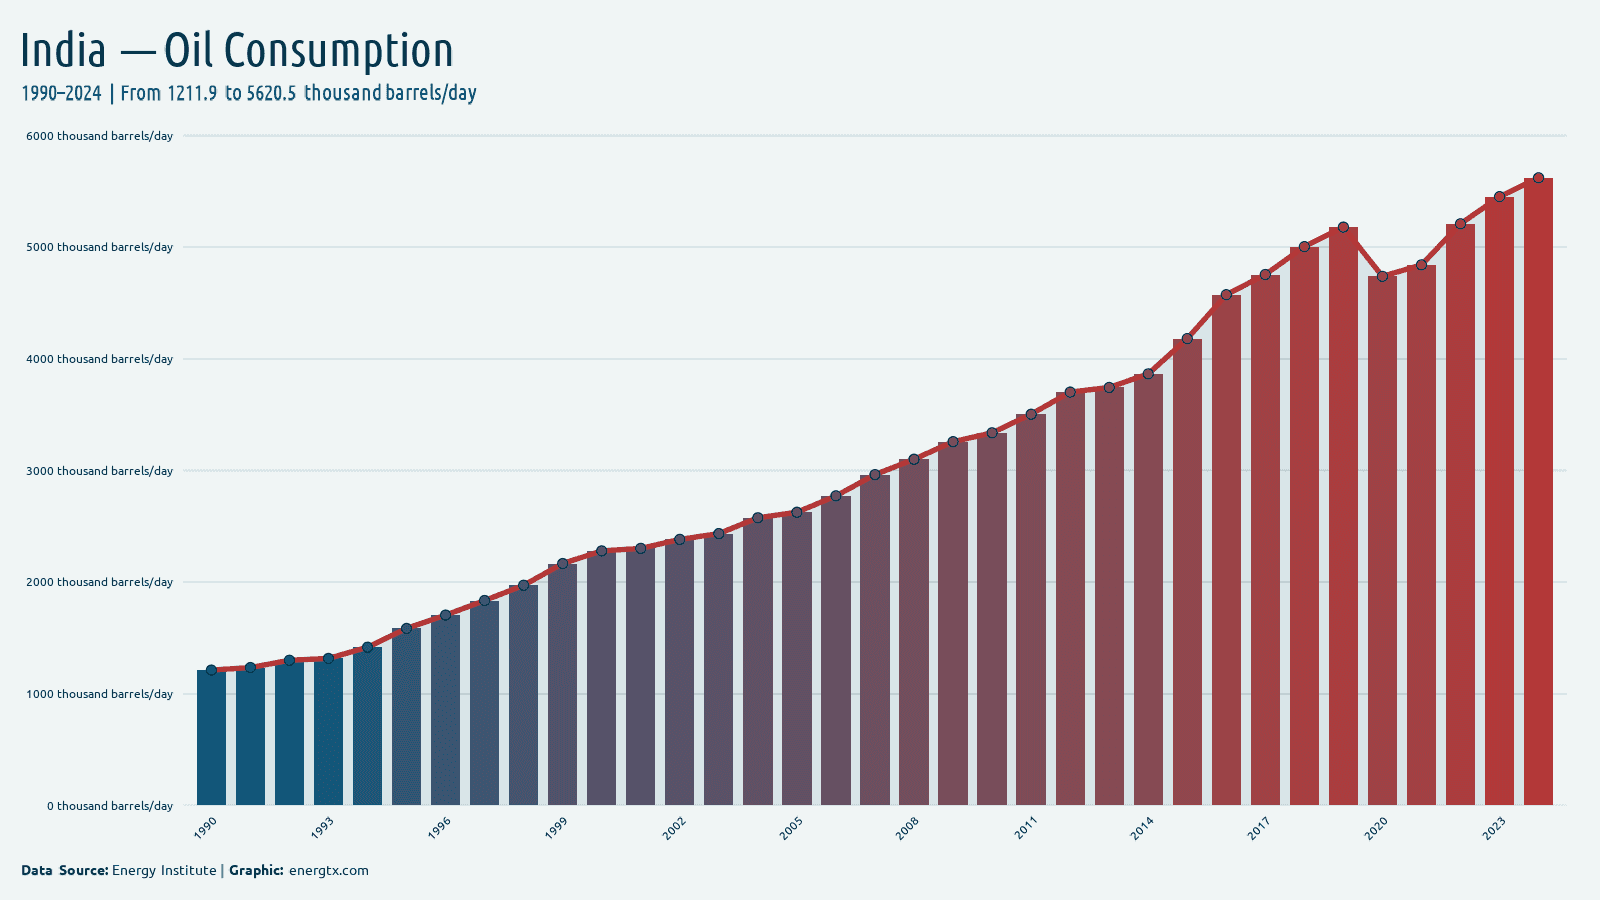
2024
Oil Consumption
5.6k
k barrels/day
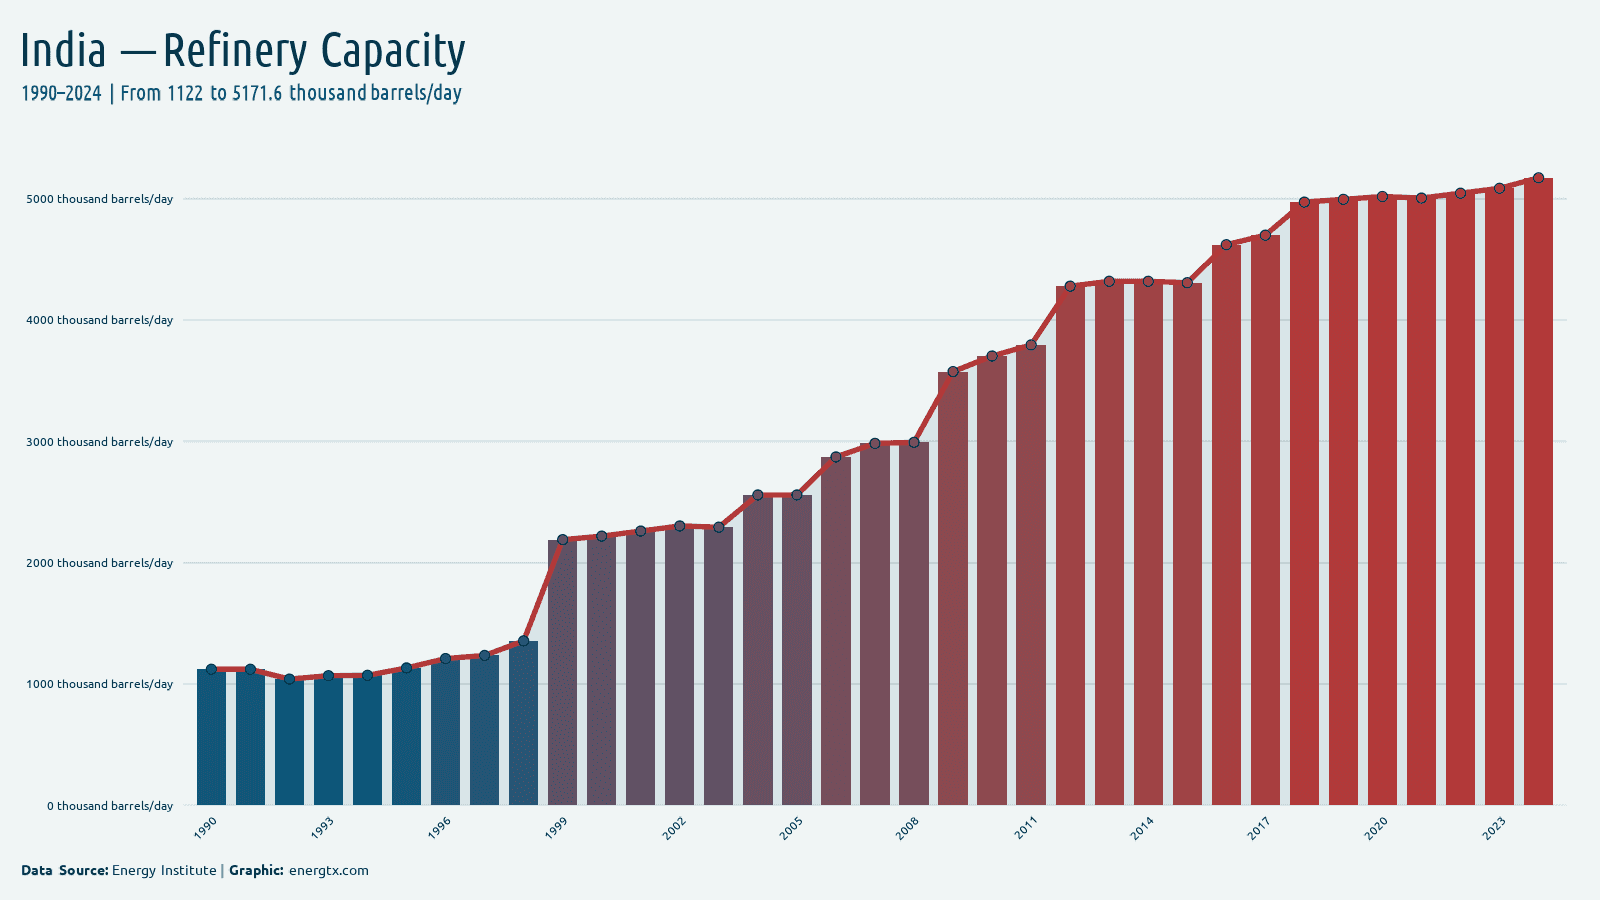
2024
Refinery Capacity
5.2k
k barrels/day
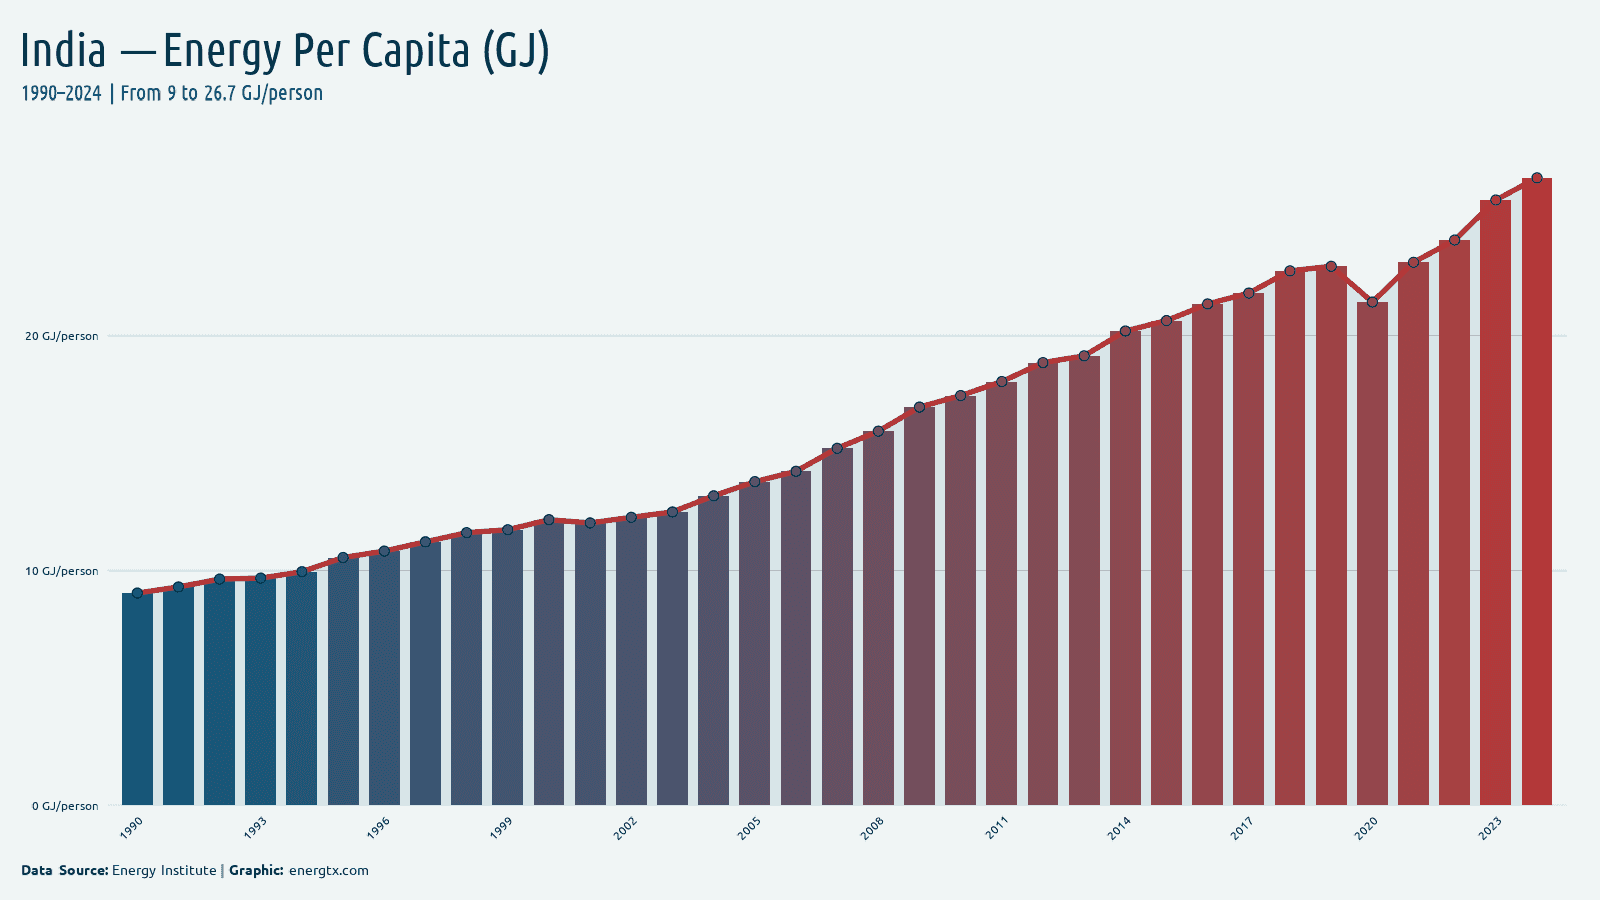
2024
Energy Per Capita (GJ)
26.7
GJ/person
2024
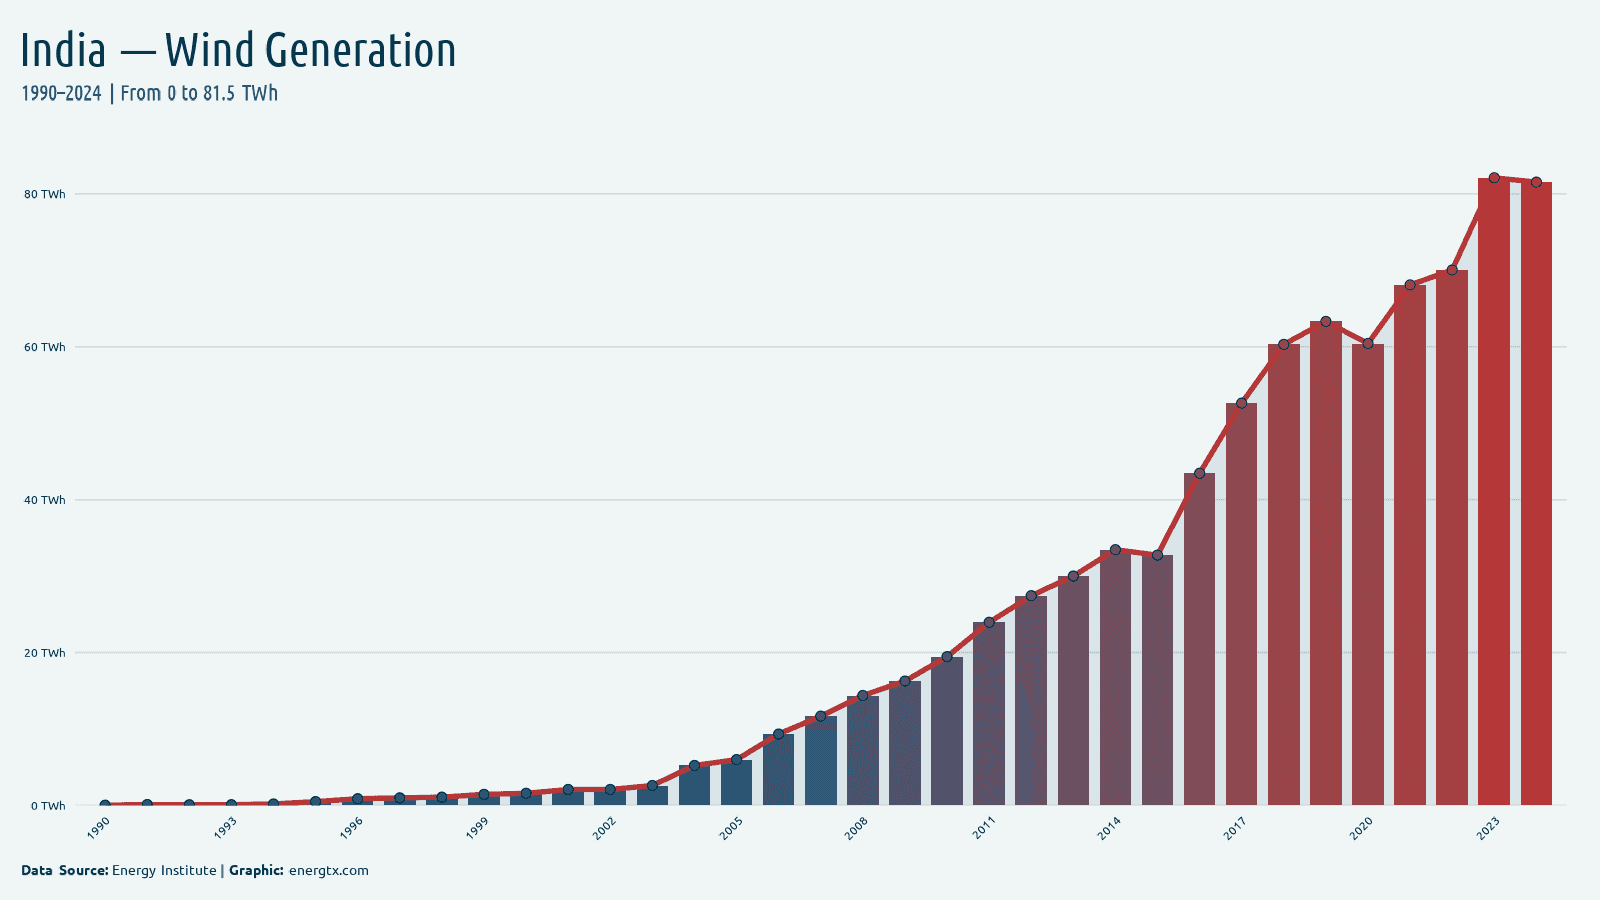
Wind Generation
81.5
TWh
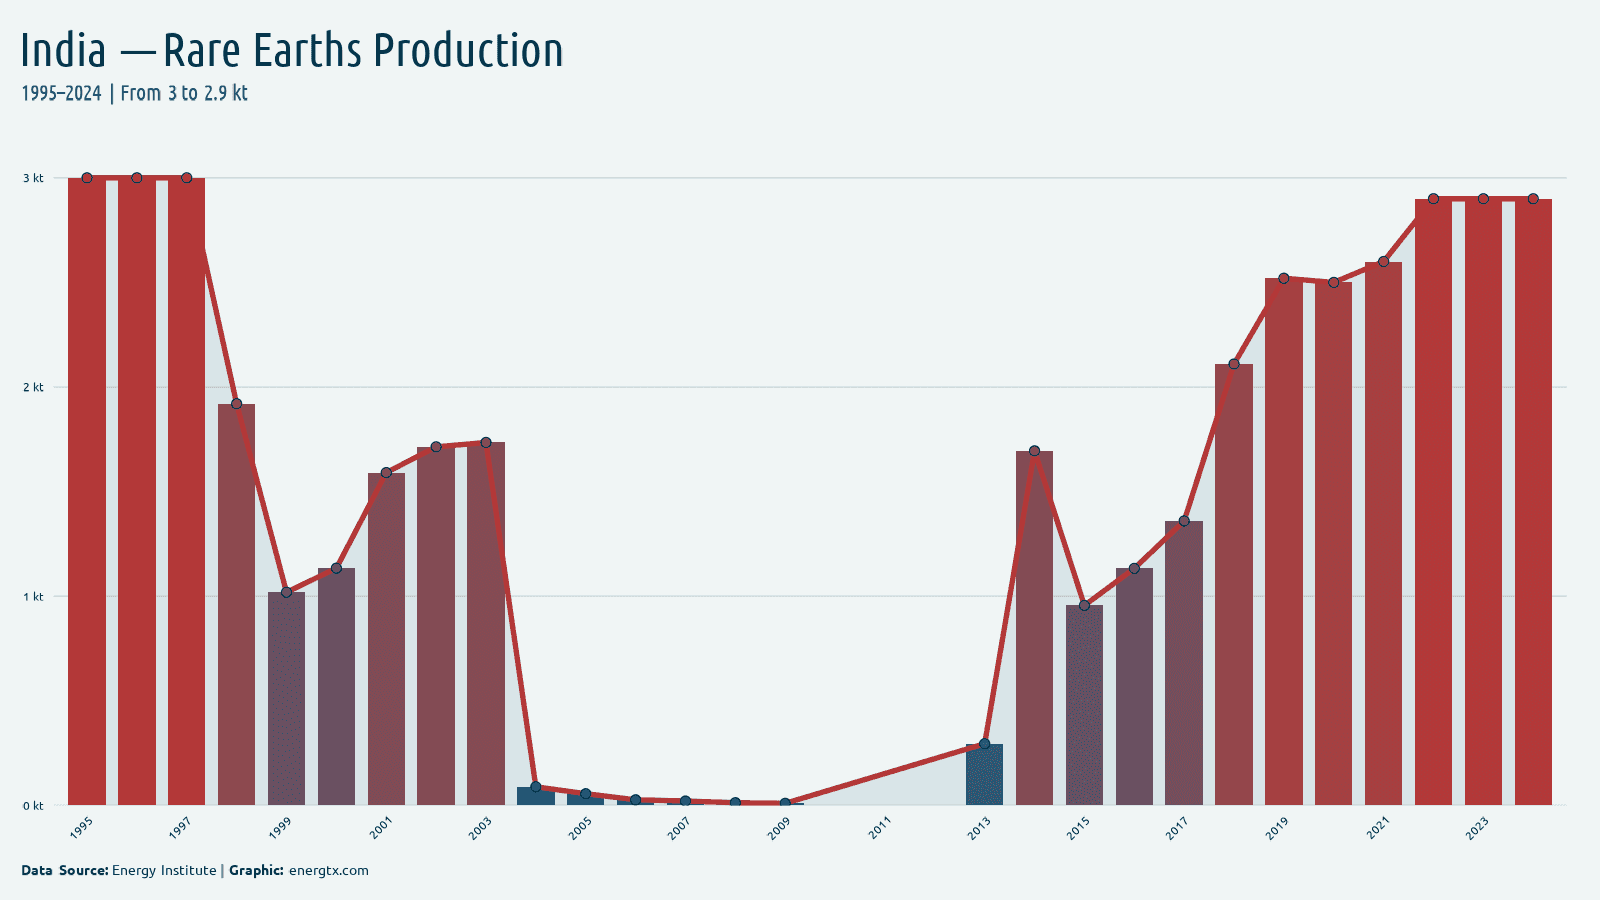
2024
Rare Earths Production
2.9
kt
2024
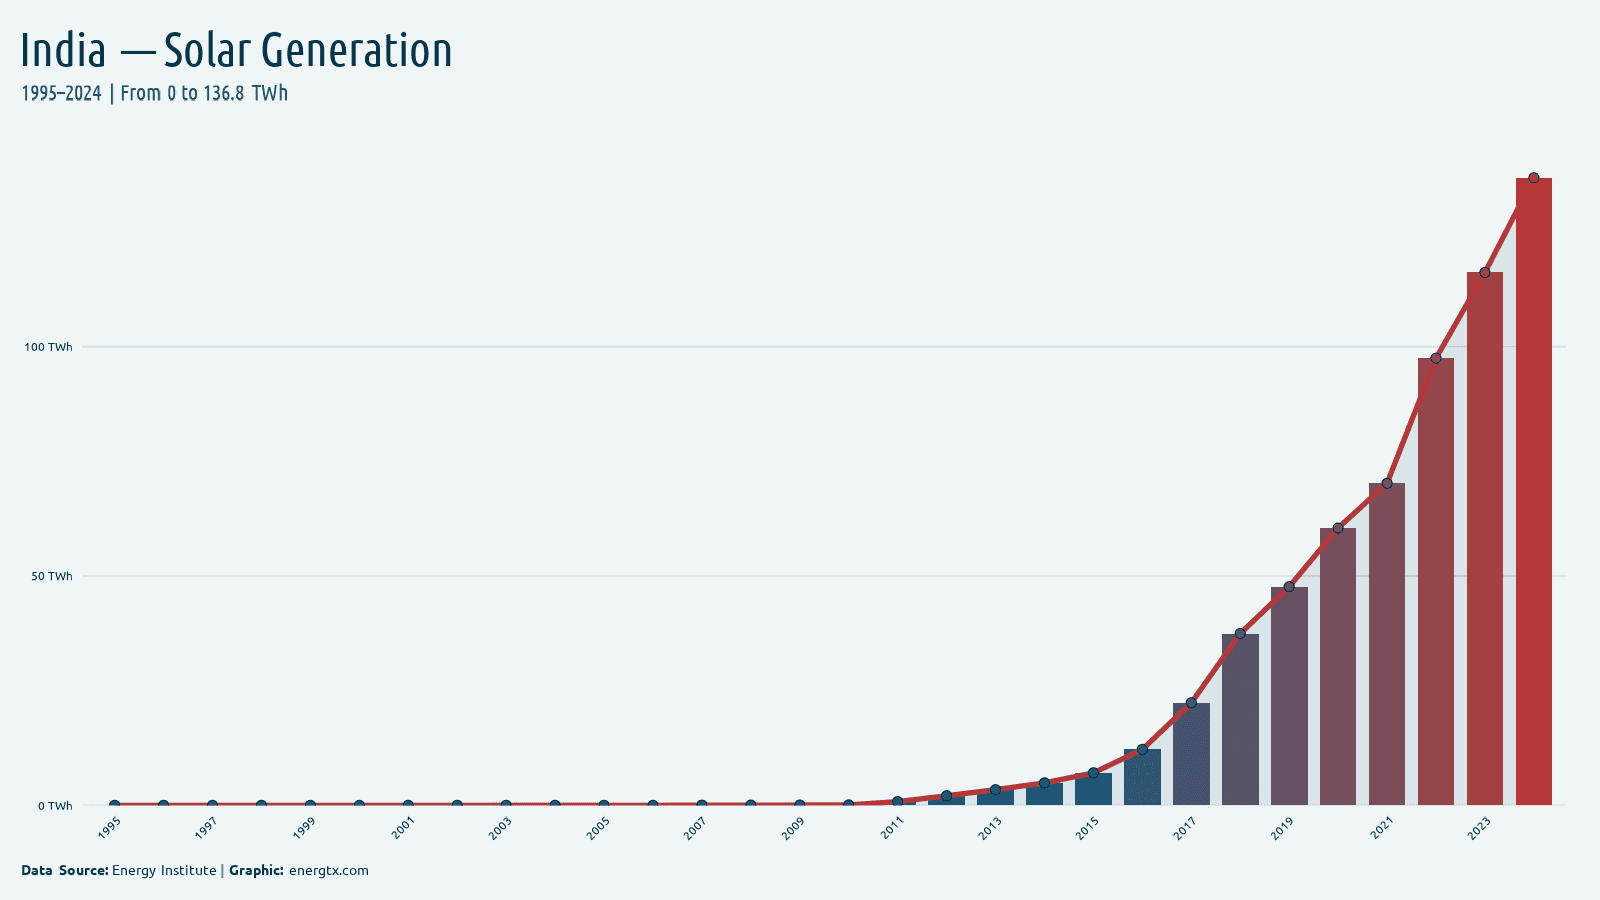
Solar Generation
136.8
TWh
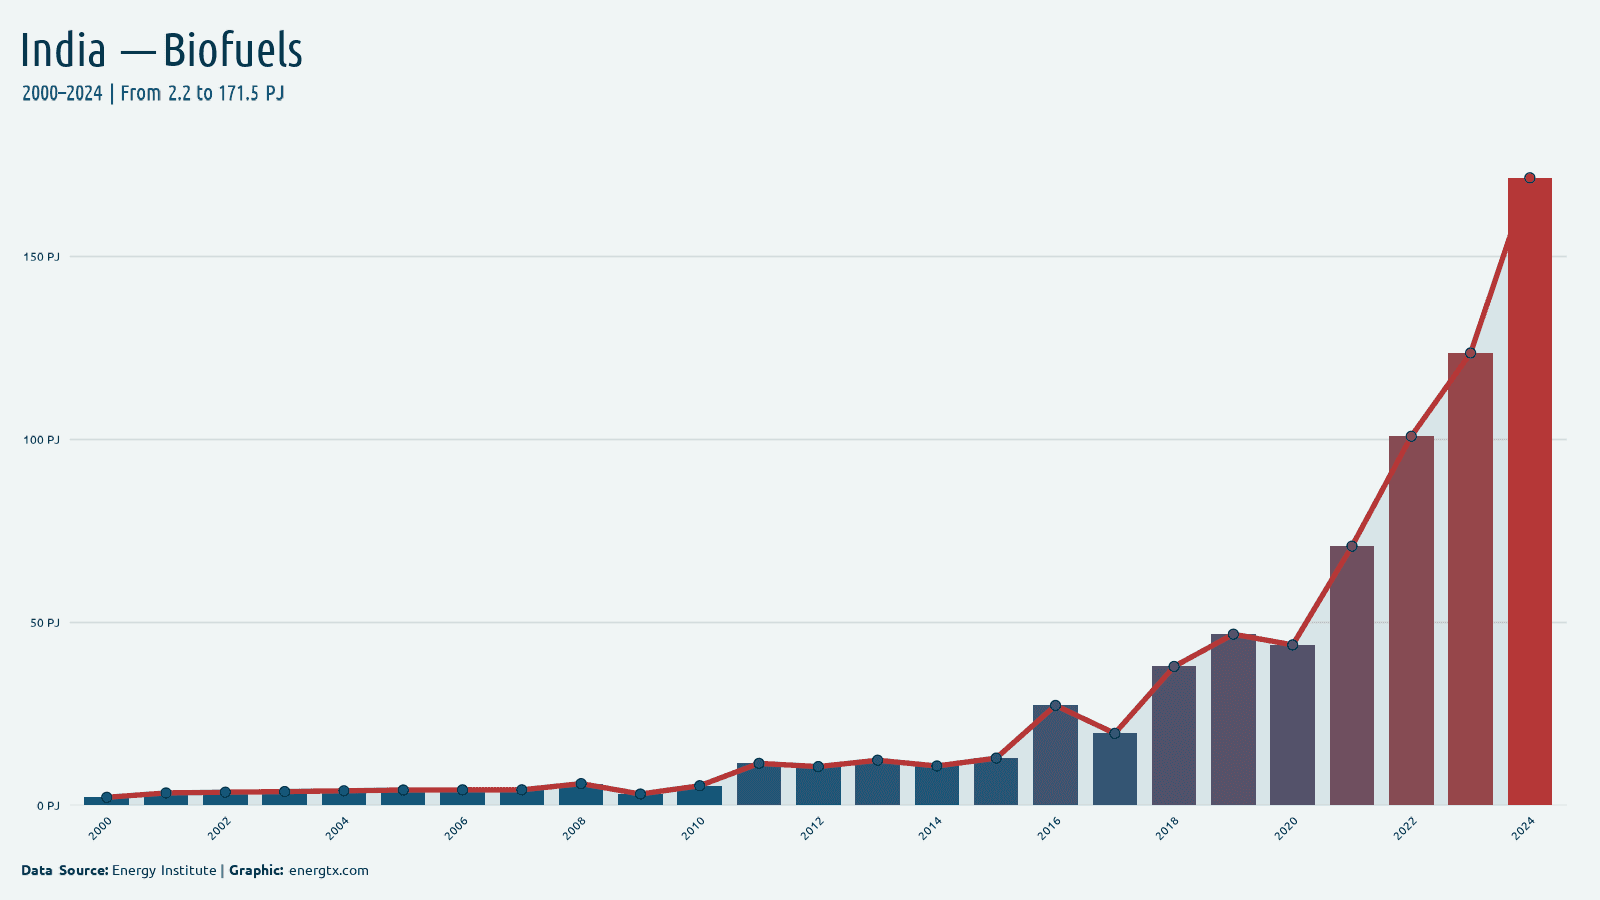
2024
Biofuels Consumption
171.5
PJ
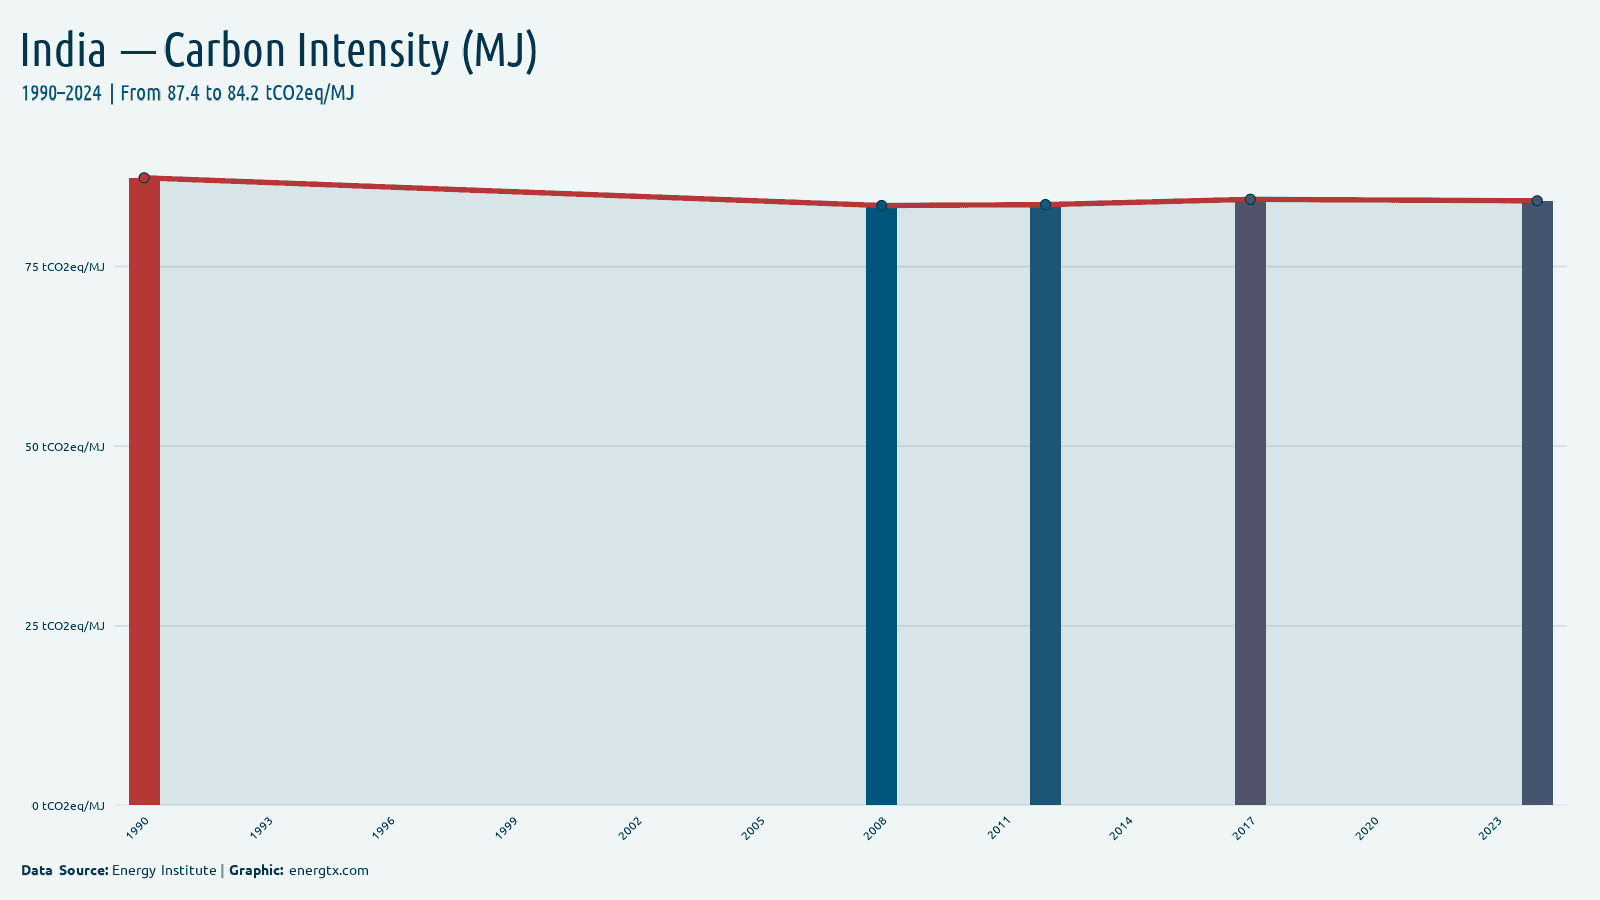
2024
Carbon Intensity (MJ)
84.2
tCO2eq/MJ
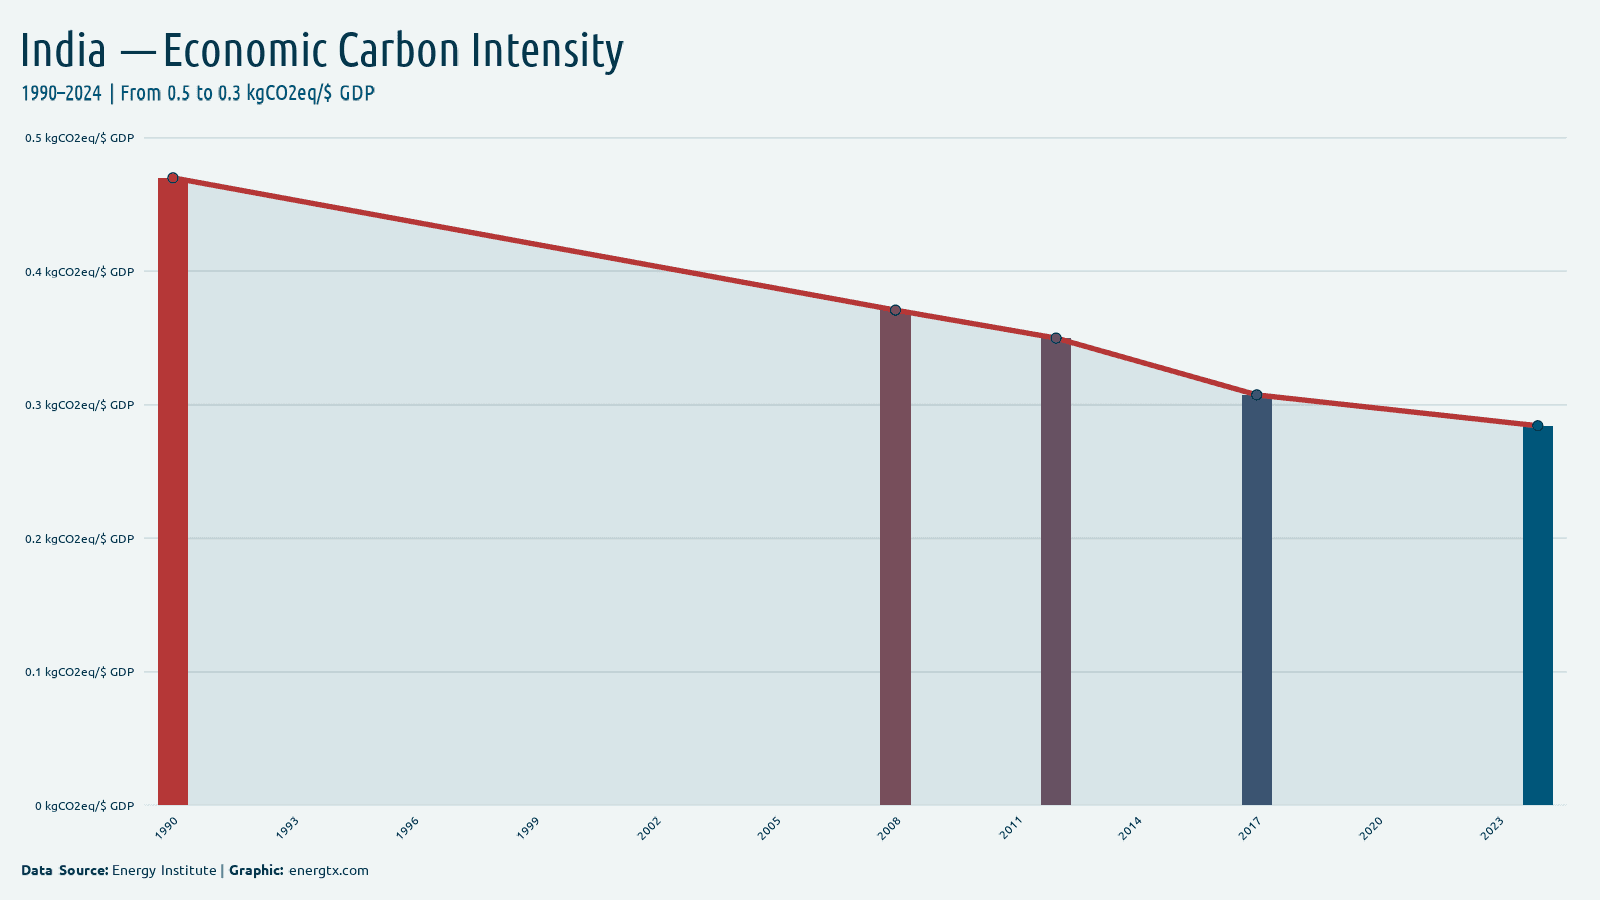
2024
Economic Carbon Intensity
0.3
kgCO2eq/$ GDP
2024
Petroleum Consumption
5.6k
k barrels/day
2024
Petroleum Production
952.5
k barrels/day
2024
Crude Oil Production
603.8
k barrels/day
2024
Motor Gasoline
922.1
k barrels/day
2024
Jet Fuel
192.2
k barrels/day
2024
Distillate Fuel
1.9k
k barrels/day
2024
LPG
988.4
k barrels/day
2024
Gas Production (BCF)
1.3k
billion cubic feet
2024
Gas Consumption (BCF)
2.5k
billion cubic feet
2024
Gas Imports
1.3k
billion cubic feet
2024
Gas Exports
0.0
billion cubic feet
2024
Coal Production (TST)
1116.6k
thousand short tons
2024
Coal Consumption (TST)
1371.1k
thousand short tons
2024
Coal Imports
256.6k
thousand short tons
2024
Coal Exports
2.1k
thousand short tons
2023
Coal Reserves
140.8k
million short tons
2024
Elec. Generation (EIA)
2.1k
billion kWh
2024
Elec. Consumption (EIA)
1.8k
billion kWh
2024
Elec. Capacity
531.5
GW
2024
Elec. Imports
7.7
billion kWh
2024
Elec. Exports
10.0
billion kWh
2024
Elec. Losses
291.9
billion kWh
2024
Nuclear Capacity
7.5
GW
2024
Nuclear Generation (EIA)
54.7
billion kWh
2024
Fossil Capacity
315.0
GW
2024
Fossil Generation
1.6k
billion kWh
2024
Renewable Capacity
204.1
GW
2024
Renewable Generation (EIA)
412.1
billion kWh
2024
Hydro Capacity
47.3
GW
2024
Hydro Generation
154.7
billion kWh
2024
Solar Capacity (EIA)
97.4
GW
2024
Solar Generation (EIA)
135.4
billion kWh
2024
Wind Capacity (EIA)
48.2
GW
2024
Wind Generation (EIA)
90.7
billion kWh
2024
Geothermal Capacity
0.0
GW
2024
Geothermal Generation
0.0
billion kWh
2024
Biomass Capacity
11.2
GW
2024
Biomass Generation
31.3
billion kWh
2023
Primary Energy Production
544.4
Mtoe
2023
Primary Energy Consumption (EIA)
912.3
Mtoe
2023
CO2 from Coal
2.1k
million metric tonnes CO2
2023
CO2 from Petroleum
642.9
million metric tonnes CO2
2023
Energy Per Capita (Btu)
25.2
million Btu/person
2023
Energy Intensity (Btu/USD)
3.3
thousand Btu/USD PPP
2023
Elec. from Oil
0.2%
%
2023
Elec. from Fossil
77.6%
%
2021
Elec. Renew. (excl. Hydro)
9.2%
%
2021
Renew. excl. Hydro (kWh)
150626270.0k
kWh/capita
2023
T&D Losses
14.2%
%
2023
Net Energy Imports
36.1%
%
2023
Fossil Fuel Share
0.0%
%
2023
Renewables & Waste
19.8%
%
2023
Alt. & Nuclear Energy
4.1%
%
2021
Energy Intensity (MJ/GDP)
4.2
MJ/$ GDP
2023
Elec. from Nuclear
2.4%
%
2021
Final Energy (PJ)
24.2k
PJ
2022
Renew. Capacity/Capita
115.0
watts/capita
2025
Crude oil production — JODI (thousand barrels/day)
575.5
k barrels/day
2025
Refinery crude intake — JODI (thousand barrels/day)
5.5k
k barrels/day
2019
Crude oil exports — JODI (thousand barrels/day)
0.0
k barrels/day
2025
Crude oil imports — JODI (thousand barrels/day)
5.0k
k barrels/day
2025
Crude oil closing stocks — JODI (thousand barrels)
56.9k
KBBL
2025
Diesel demand — JODI (thousand barrels/day)
1.9k
k barrels/day
2025
Gasoline demand — JODI (thousand barrels/day)
971.2
k barrels/day
2025
Kerosene demand — JODI (thousand barrels/day)
205.9
k barrels/day
2025
LPG demand — JODI (thousand barrels/day)
1.1k
k barrels/day
2025
Fuel oil demand — JODI (thousand barrels/day)
110.8
k barrels/day
2025
Refinery output — JODI (thousand barrels/day)
6.2k
k barrels/day
2025
Total oil products demand — JODI (thousand barrels/day)
5.5k
k barrels/day
2025
Oil products exports — JODI (thousand barrels/day)
1.4k
k barrels/day
2025
Oil products imports — JODI (thousand barrels/day)
1.3k
k barrels/day
2025
Oil products closing stocks — JODI (thousand barrels)
94.2k
KBBL
2025
Bioenergy Share
1.1%
%
2025
Coal Share
70.8%
%
2025
Gas Share
2.3%
%
2025
Hydro Share
8.6%
%
2025
Nuclear Share
2.6%
%
2025
Other Fossil Share
0.2%
%
2025
Solar Share
9.4%
%
2025
Wind Share
5.0%
%
2025
GHG Emissions (Total)
4.6k
Mt CO2e
2025
GHG Per Capita
3.3
t CO2e/person
2025
Global GHG Share
6.3%
%
2025
GHG from Power
1.5k
Mt CO2e
2025
GHG from Transport
279.4
Mt CO2e
2025
GHG from Manufacturing
818.8
Mt CO2e
2025
GHG from Buildings
315.3
Mt CO2e
2025
GHG from Agriculture
901.6
Mt CO2e
2025
GHG from Fossil Ops
251.1
Mt CO2e
2025
GHG from Waste
157.4
Mt CO2e
2025
GHG from Land Use
223.5
Mt CO2e
2023
Effective carbon rate (€/tCO2)
10.9
€/tCO2
2023
Net effective carbon rate (€/tCO2)
10.7
€/tCO2
Charts


Trends Over Time
Electricity Consumption (per capita)kWh/capita
Dataset
| Indicator | Year | Value | Unit | Source |
|---|---|---|---|---|
| Electricity Access | 2023 | 99.5% | % | World Bank |
| Electricity Access | 2022 | 99.2% | % | World Bank |
| Electricity Access | 2021 | 99.6% | % | World Bank |
| Electricity Access | 2020 | 96.5% | % | World Bank |
| Electricity Access | 2019 | 95.9% | % | World Bank |
| Electricity Access | 2018 | 95.7% | % | World Bank |
| Electricity Access | 2017 | 91.8% | % | World Bank |
| Electricity Access | 2016 | 89.6% | % | World Bank |
| Electricity Access | 2015 | 88.0% | % | World Bank |
| Electricity Access | 2014 | 85.1% | % | World Bank |
| Electricity Access | 2013 | 83.1% | % | World Bank |
| Electricity Access | 2012 | 79.9% | % | World Bank |
| Electricity Access | 2011 | 79.5% | % | World Bank |
| Electricity Access | 2010 | 76.3% | % | World Bank |
| Electricity Access | 2009 | 75.0% | % | World Bank |
| Electricity Access | 2008 | 74.1% | % | World Bank |
| Electricity Access | 2007 | 72.3% | % | World Bank |
| Electricity Access | 2006 | 67.9% | % | World Bank |
| Electricity Access | 2005 | 68.8% | % | World Bank |
| Electricity Access | 2004 | 64.4% | % | World Bank |
| Electricity Access | 2003 | 65.4% | % | World Bank |
| Electricity Access | 2002 | 62.3% | % | World Bank |
| Electricity Access | 2001 | 62.0% | % | World Bank |
| Electricity Access | 2000 | 60.3% | % | World Bank |
| Electricity Access | 1999 | 60.1% | % | World Bank |
| Electricity Access | 1998 | 56.2% | % | World Bank |
| Electricity Access | 1997 | 54.6% | % | World Bank |
| Electricity Access | 1996 | 53.0% | % | World Bank |
| Electricity Access | 1995 | 51.4% | % | World Bank |
| Electricity Access | 1994 | 49.8% | % | World Bank |
| Electricity Access | 1993 | 50.9% | % | World Bank |
| Alt. & Nuclear Energy | 2023 | 4.1% | % | World Bank |
| Alt. & Nuclear Energy | 2022 | 4.3% | % | World Bank |
| Alt. & Nuclear Energy | 2021 | 4.2% | % | World Bank |
| Alt. & Nuclear Energy | 2020 | 4.2% | % | World Bank |
| Alt. & Nuclear Energy | 2019 | 4.2% | % | World Bank |
| Alt. & Nuclear Energy | 2018 | 3.6% | % | World Bank |
| Alt. & Nuclear Energy | 2017 | 3.4% | % | World Bank |
| Alt. & Nuclear Energy | 2016 | 3.4% | % | World Bank |
| Alt. & Nuclear Energy | 2015 | 3.1% | % | World Bank |
| Alt. & Nuclear Energy | 2014 | 3.2% | % | World Bank |
| Alt. & Nuclear Energy | 2013 | 3.4% | % | World Bank |
| Alt. & Nuclear Energy | 2012 | 3.1% | % | World Bank |
| Alt. & Nuclear Energy | 2011 | 3.4% | % | World Bank |
| Alt. & Nuclear Energy | 2010 | 3.0% | % | World Bank |
| Alt. & Nuclear Energy | 2009 | 2.6% | % | World Bank |
| Alt. & Nuclear Energy | 2008 | 2.7% | % | World Bank |
| Alt. & Nuclear Energy | 2007 | 3.0% | % | World Bank |
| Alt. & Nuclear Energy | 2006 | 3.1% | % | World Bank |
| Alt. & Nuclear Energy | 2005 | 2.9% | % | World Bank |
| Alt. & Nuclear Energy | 2004 | 2.7% | % | World Bank |
| Alt. & Nuclear Energy | 2003 | 2.7% | % | World Bank |
| Alt. & Nuclear Energy | 2002 | 2.6% | % | World Bank |
| Alt. & Nuclear Energy | 2001 | 2.8% | % | World Bank |
| Alt. & Nuclear Energy | 2000 | 2.6% | % | World Bank |
| Alt. & Nuclear Energy | 1999 | 2.6% | % | World Bank |
| Alt. & Nuclear Energy | 1998 | 2.7% | % | World Bank |
| Alt. & Nuclear Energy | 1997 | 2.4% | % | World Bank |
| Alt. & Nuclear Energy | 1996 | 2.3% | % | World Bank |
| Alt. & Nuclear Energy | 1995 | 2.4% | % | World Bank |
| Alt. & Nuclear Energy | 1994 | 2.6% | % | World Bank |
| Alt. & Nuclear Energy | 1993 | 2.4% | % | World Bank |
| Alt. & Nuclear Energy | 1992 | 2.6% | % | World Bank |
| Alt. & Nuclear Energy | 1991 | 2.6% | % | World Bank |
| Alt. & Nuclear Energy | 1990 | 2.8% | % | World Bank |
| Biofuels Consumption | 2024 | 171.5 | PJ | Energy Institute |
| Biofuels Consumption | 2023 | 123.6 | PJ | Energy Institute |
| Biofuels Consumption | 2022 | 100.9 | PJ | Energy Institute |
| Biofuels Consumption | 2021 | 70.8 | PJ | Energy Institute |
| Biofuels Consumption | 2020 | 43.9 | PJ | Energy Institute |
| Biofuels Consumption | 2019 | 46.8 | PJ | Energy Institute |
| Biofuels Consumption | 2018 | 38.0 | PJ | Energy Institute |
| Biofuels Consumption | 2017 | 19.7 | PJ | Energy Institute |
| Biofuels Consumption | 2016 | 27.3 | PJ | Energy Institute |
| Biofuels Consumption | 2015 | 12.9 | PJ | Energy Institute |
| Biofuels Consumption | 2014 | 10.8 | PJ | Energy Institute |
| Biofuels Consumption | 2013 | 12.3 | PJ | Energy Institute |
| Biofuels Consumption | 2012 | 10.6 | PJ | Energy Institute |
| Biofuels Consumption | 2011 | 11.5 | PJ | Energy Institute |
| Biofuels Consumption | 2010 | 5.4 | PJ | Energy Institute |
| Biofuels Consumption | 2009 | 3.1 | PJ | Energy Institute |
| Biofuels Consumption | 2008 | 6.0 | PJ | Energy Institute |
| Biofuels Consumption | 2007 | 4.3 | PJ | Energy Institute |
| Biofuels Consumption | 2006 | 4.3 | PJ | Energy Institute |
| Biofuels Consumption | 2005 | 4.2 | PJ | Energy Institute |
| Biofuels Consumption | 2004 | 4.0 | PJ | Energy Institute |
| Biofuels Consumption | 2003 | 3.8 | PJ | Energy Institute |
| Biofuels Consumption | 2002 | 3.6 | PJ | Energy Institute |
| Biofuels Consumption | 2001 | 3.4 | PJ | Energy Institute |
| Biofuels Consumption | 2000 | 2.2 | PJ | Energy Institute |
| Biomass Capacity | 2024 | 11.2 | GW | EIA |
| Biomass Capacity | 2023 | 10.8 | GW | EIA |
| Biomass Capacity | 2022 | 10.7 | GW | EIA |
| Biomass Capacity | 2021 | 10.6 | GW | EIA |
| Biomass Capacity | 2020 | 10.5 | GW | EIA |
| Biomass Capacity | 2019 | 10.2 | GW | EIA |
| Biomass Capacity | 2018 | 10.1 | GW | EIA |
| Biomass Capacity | 2017 | 9.4 | GW | EIA |
| Biomass Capacity | 2016 | 8.9 | GW | EIA |
| Biomass Capacity | 2015 | 5.5 | GW | EIA |
| Biomass Capacity | 2014 | 5.0 | GW | EIA |
| Biomass Capacity | 2013 | 4.2 | GW | EIA |
| Biomass Capacity | 2012 | 3.9 | GW | EIA |
| Biomass Capacity | 2011 | 3.7 | GW | EIA |
| Biomass Capacity | 2010 | 3.1 | GW | EIA |
| Biomass Capacity | 2009 | 2.5 | GW | EIA |
| Biomass Capacity | 2008 | 2.2 | GW | EIA |
| Biomass Capacity | 2007 | 1.6 | GW | EIA |
| Biomass Capacity | 2006 | 1.3 | GW | EIA |
| Biomass Capacity | 2005 | 1.0 | GW | EIA |
| Biomass Capacity | 2004 | 0.8 | GW | EIA |
| Biomass Capacity | 2003 | 0.6 | GW | EIA |
| Biomass Capacity | 2002 | 0.5 | GW | EIA |
| Biomass Capacity | 2001 | 0.4 | GW | EIA |
| Biomass Capacity | 2000 | 0.3 | GW | EIA |
| Biomass Generation | 2024 | 31.3 | billion kWh | EIA |
| Biomass Generation | 2023 | 33.7 | billion kWh | EIA |
| Biomass Generation | 2022 | 33.1 | billion kWh | EIA |
| Biomass Generation | 2021 | 29.9 | billion kWh | EIA |
| Biomass Generation | 2020 | 32.9 | billion kWh | EIA |
| Biomass Generation | 2019 | 32.6 | billion kWh | EIA |
| Biomass Generation | 2018 | 32.0 | billion kWh | EIA |
| Biomass Generation | 2017 | 33.5 | billion kWh | EIA |
| Biomass Generation | 2016 | 26.2 | billion kWh | EIA |
| Biomass Generation | 2015 | 26.5 | billion kWh | EIA |
| Biomass Generation | 2014 | 27.6 | billion kWh | EIA |
| Biomass Generation | 2013 | 23.4 | billion kWh | EIA |
| Biomass Generation | 2012 | 18.5 | billion kWh | EIA |
| Biomass Generation | 2011 | 15.8 | billion kWh | EIA |
| Biomass Generation | 2010 | 13.2 | billion kWh | EIA |
| Biomass Generation | 2009 | 10.6 | billion kWh | EIA |
| Biomass Generation | 2008 | 8.4 | billion kWh | EIA |
| Biomass Generation | 2007 | 8.2 | billion kWh | EIA |
| Biomass Generation | 2006 | 6.8 | billion kWh | EIA |
| Biomass Generation | 2005 | 6.0 | billion kWh | EIA |
| Biomass Generation | 2004 | 5.3 | billion kWh | EIA |
| Biomass Generation | 2003 | 4.0 | billion kWh | EIA |
| Biomass Generation | 2002 | 3.2 | billion kWh | EIA |
| Biomass Generation | 2001 | 1.7 | billion kWh | EIA |
| Biomass Generation | 2000 | 1.3 | billion kWh | EIA |
| Biomass Generation | 1999 | 1.0 | billion kWh | EIA |
| Biomass Generation | 1998 | 0.0 | billion kWh | EIA |
| Biomass Generation | 1997 | 0.0 | billion kWh | EIA |
| Biomass Generation | 1996 | 0.0 | billion kWh | EIA |
| Biomass Generation | 1995 | 0.0 | billion kWh | EIA |
| Biomass Generation | 1994 | 0.0 | billion kWh | EIA |
| Biomass Generation | 1993 | 0.0 | billion kWh | EIA |
| Biomass Generation | 1992 | 0.0 | billion kWh | EIA |
| Biomass Generation | 1991 | 0.0 | billion kWh | EIA |
| Biomass Generation | 1990 | 0.0 | billion kWh | EIA |
| Carbon Intensity (MJ) | 2024 | 84.2 | tCO2eq/MJ | Energy Institute |
| Carbon Intensity (MJ) | 2017 | 84.4 | tCO2eq/MJ | Energy Institute |
| Carbon Intensity (MJ) | 2012 | 83.6 | tCO2eq/MJ | Energy Institute |
| Carbon Intensity (MJ) | 2008 | 83.5 | tCO2eq/MJ | Energy Institute |
| Carbon Intensity (MJ) | 1990 | 87.4 | tCO2eq/MJ | Energy Institute |
| Carbon Intensity | 2024 | 8.0 | tCO2/EJ | Energy Institute |
| Carbon Intensity | 2023 | 8.3 | tCO2/EJ | Energy Institute |
| Carbon Intensity | 2022 | 7.9 | tCO2/EJ | Energy Institute |
| Carbon Intensity | 2021 | 7.2 | tCO2/EJ | Energy Institute |
| Carbon Intensity | 2020 | 7.1 | tCO2/EJ | Energy Institute |
| Carbon Intensity | 2019 | 7.5 | tCO2/EJ | Energy Institute |
| Carbon Intensity | 2018 | 7.4 | tCO2/EJ | Energy Institute |
| Carbon Intensity | 2017 | 7.1 | tCO2/EJ | Energy Institute |
| Carbon Intensity | 2016 | 7.6 | tCO2/EJ | Energy Institute |
| Carbon Intensity | 2015 | 7.7 | tCO2/EJ | Energy Institute |
| Carbon Intensity | 2014 | 7.8 | tCO2/EJ | Energy Institute |
| Carbon Intensity | 2013 | 7.9 | tCO2/EJ | Energy Institute |
| Carbon Intensity | 2012 | 7.6 | tCO2/EJ | Energy Institute |
| Carbon Intensity | 2011 | 7.7 | tCO2/EJ | Energy Institute |
| Carbon Intensity | 2010 | 7.7 | tCO2/EJ | Energy Institute |
| Carbon Intensity | 2009 | 7.6 | tCO2/EJ | Energy Institute |
| Carbon Intensity | 2008 | 7.3 | tCO2/EJ | Energy Institute |
| Carbon Intensity | 2007 | 7.3 | tCO2/EJ | Energy Institute |
| Carbon Intensity | 2006 | 7.6 | tCO2/EJ | Energy Institute |
| Carbon Intensity | 2005 | 7.5 | tCO2/EJ | Energy Institute |
| Carbon Intensity | 2004 | 7.6 | tCO2/EJ | Energy Institute |
| Carbon Intensity | 2003 | 7.7 | tCO2/EJ | Energy Institute |
| Carbon Intensity | 2002 | 7.7 | tCO2/EJ | Energy Institute |
| Carbon Intensity | 2001 | 7.6 | tCO2/EJ | Energy Institute |
| Carbon Intensity | 2000 | 7.5 | tCO2/EJ | Energy Institute |
| Carbon Intensity | 1999 | 8.1 | tCO2/EJ | Energy Institute |
| Carbon Intensity | 1998 | 7.9 | tCO2/EJ | Energy Institute |
| Carbon Intensity | 1997 | 8.3 | tCO2/EJ | Energy Institute |
| Carbon Intensity | 1996 | 8.2 | tCO2/EJ | Energy Institute |
| Carbon Intensity | 1995 | 8.3 | tCO2/EJ | Energy Institute |
| Carbon Intensity | 1994 | 8.2 | tCO2/EJ | Energy Institute |
| Carbon Intensity | 1993 | 8.5 | tCO2/EJ | Energy Institute |
| Carbon Intensity | 1992 | 8.8 | tCO2/EJ | Energy Institute |
| Carbon Intensity | 1991 | 10.3 | tCO2/EJ | Energy Institute |
| Carbon Intensity | 1990 | 10.4 | tCO2/EJ | Energy Institute |
| CO2 Emissions (per capita) | 2023 | 2.1 | metric tons/capita | Global Carbon Project |
| CO2 Emissions (per capita) | 2022 | 2.0 | metric tons/capita | Global Carbon Project |
| CO2 Emissions (per capita) | 2021 | 1.9 | metric tons/capita | Global Carbon Project |
| CO2 Emissions (per capita) | 2020 | 1.7 | metric tons/capita | Global Carbon Project |
| CO2 Emissions (per capita) | 2019 | 1.9 | metric tons/capita | Global Carbon Project |
| CO2 Emissions (per capita) | 2018 | 1.9 | metric tons/capita | Global Carbon Project |
| CO2 Emissions (per capita) | 2017 | 1.8 | metric tons/capita | Global Carbon Project |
| CO2 Emissions (per capita) | 2016 | 1.8 | metric tons/capita | Global Carbon Project |
| CO2 Emissions (per capita) | 2015 | 1.7 | metric tons/capita | Global Carbon Project |
| CO2 Emissions (per capita) | 2014 | 1.6 | metric tons/capita | Global Carbon Project |
Showing 200 of 3692 records. Download for the full dataset.
Download India Data
Found a data error?
Our data is sourced from World Bank, Energy Institute, OWID, OECD, IAEA, GCP, and Eurostat. If you notice an incorrect value, missing data, or any discrepancy for India, please let us know so we can investigate and correct it. Include the indicator name, year, and a brief description of the issue.
Report a data error