🇻🇳
Vietnam
3246 records · 121 indicators · 1990–2025
3,246
Data Records
121
Indicators
1990–2025
Time Range
VNM
ISO Code
Latest Indicator Values
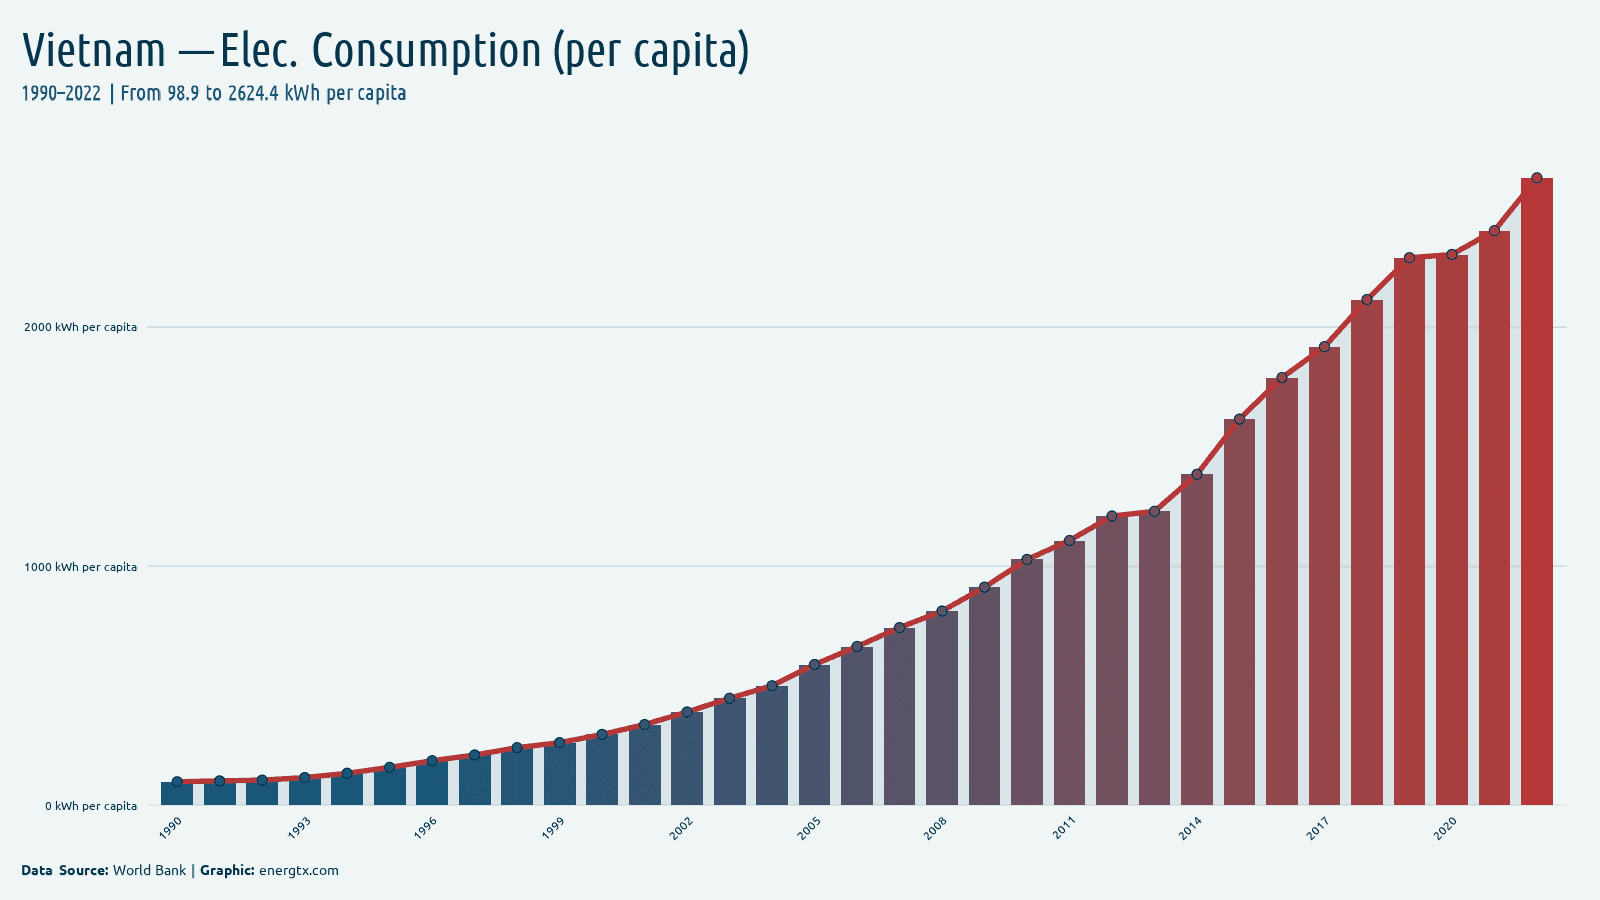
2022
Electricity Consumption (per capita)
2.6k
kWh/capita
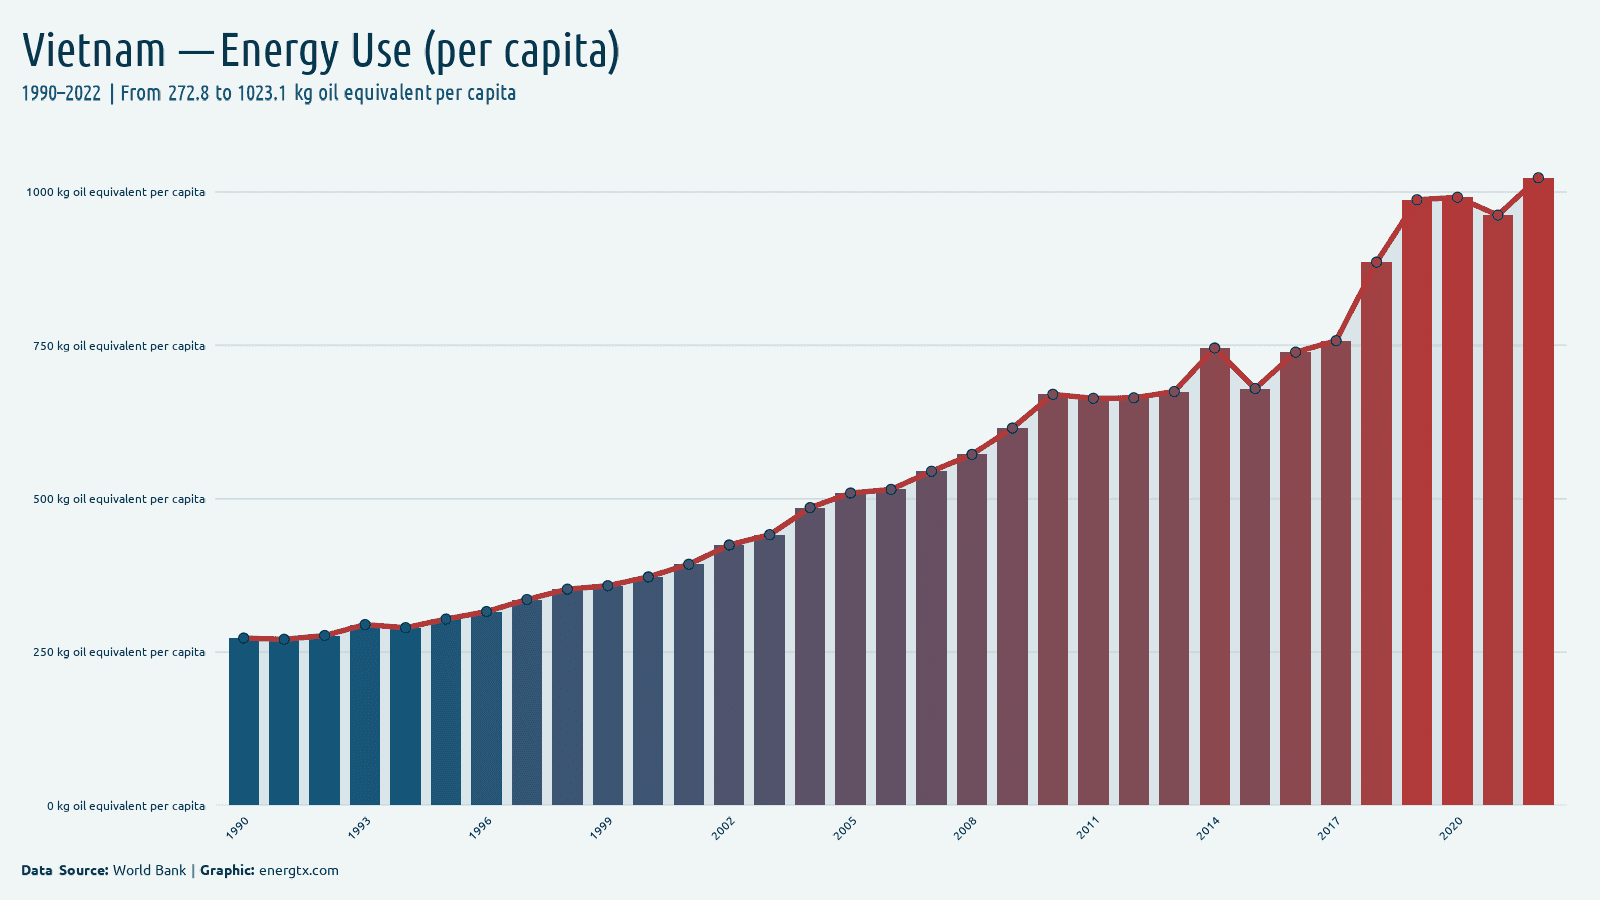
2022
Energy Use (per capita)
1.0k
kg oil eq./capita
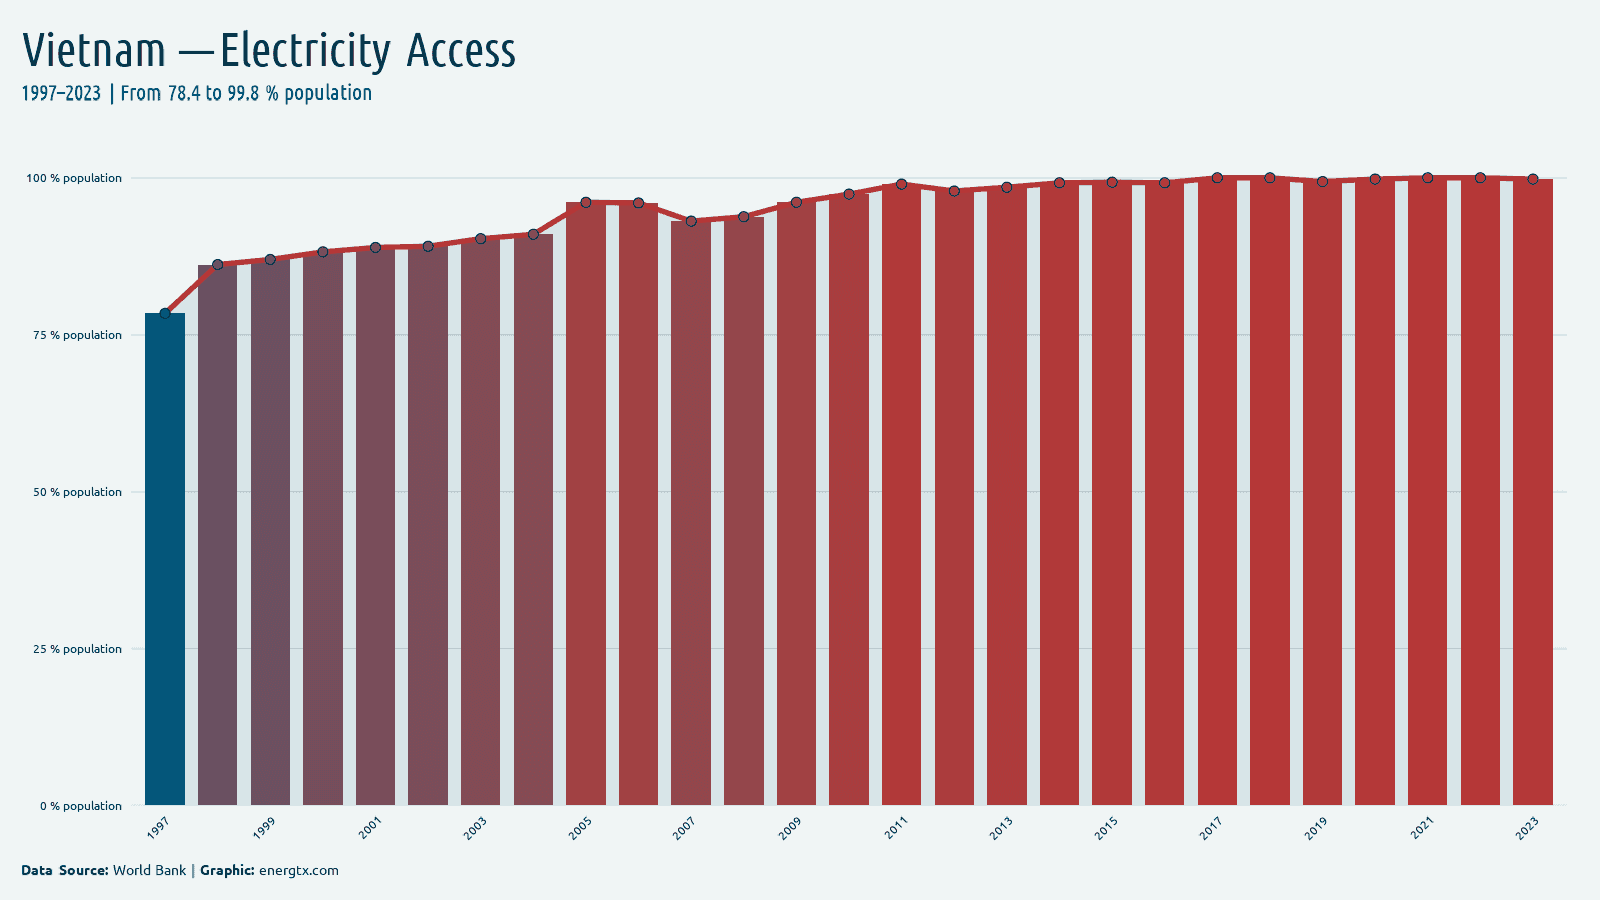
2023
Electricity Access
99.8%
%
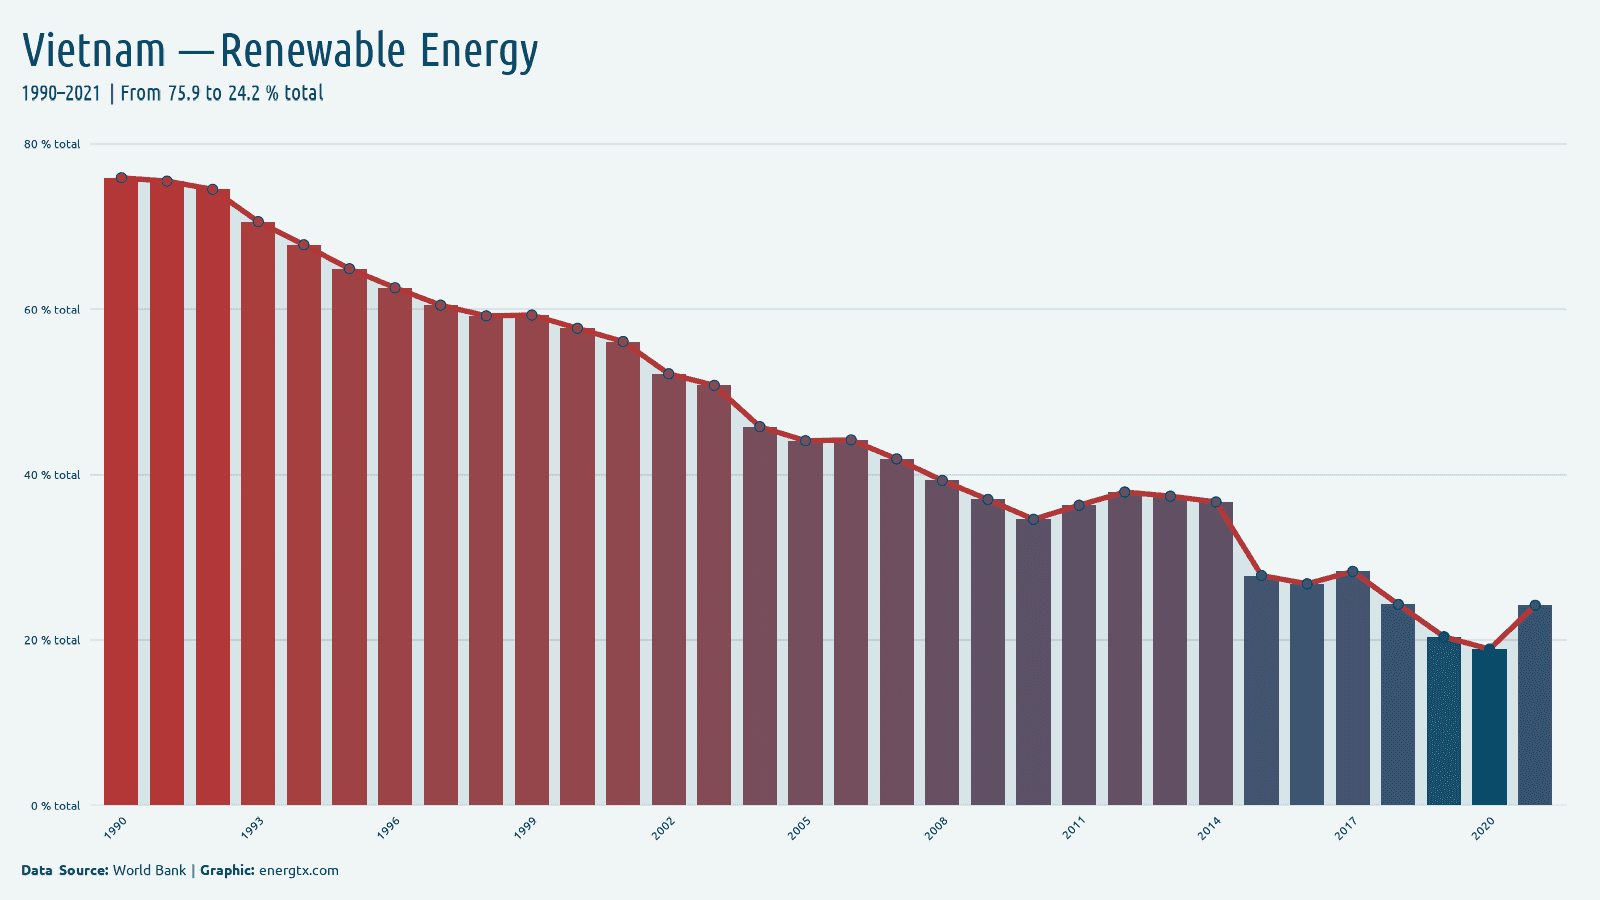
2021
Renewable Energy
24.2%
%
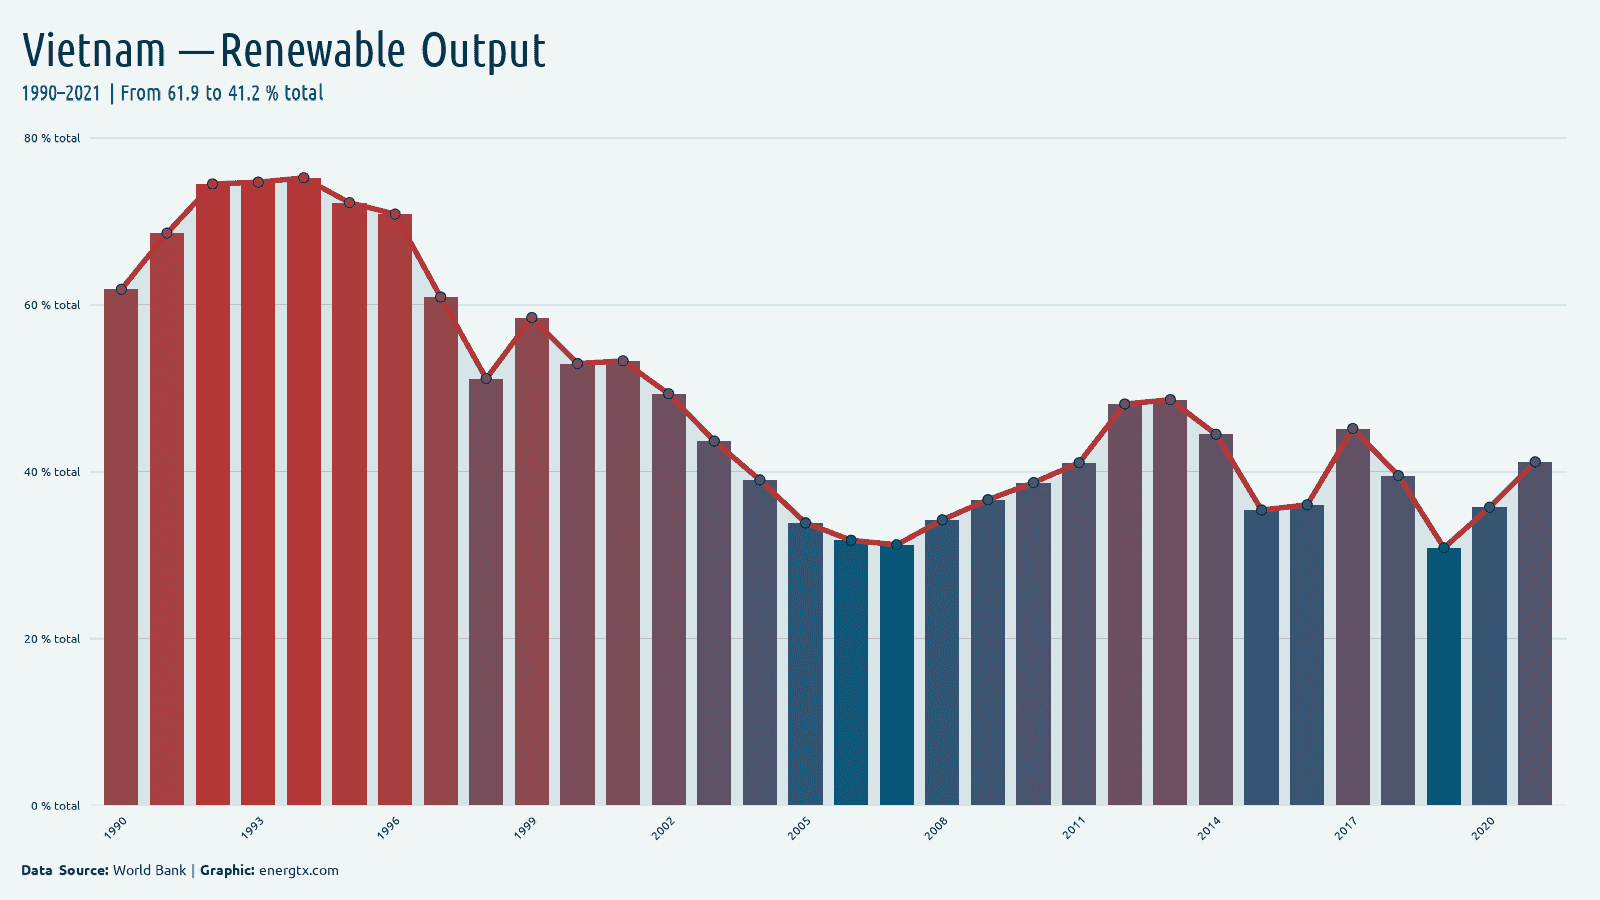
2021
Renewable Output
41.2%
%
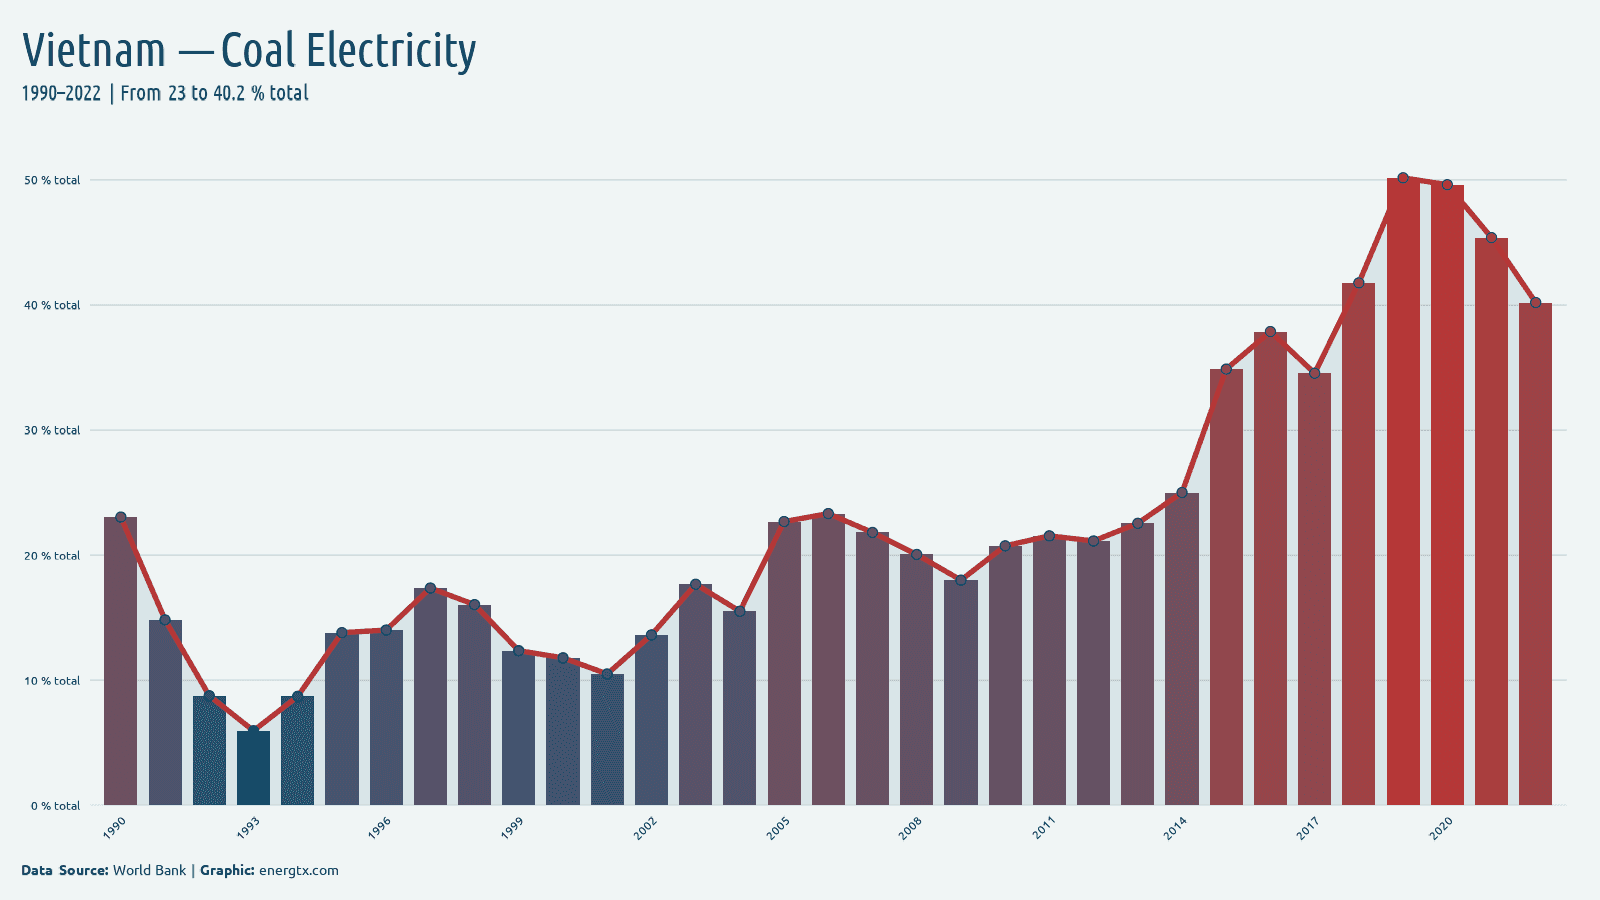
2022
Coal Electricity
40.2%
%
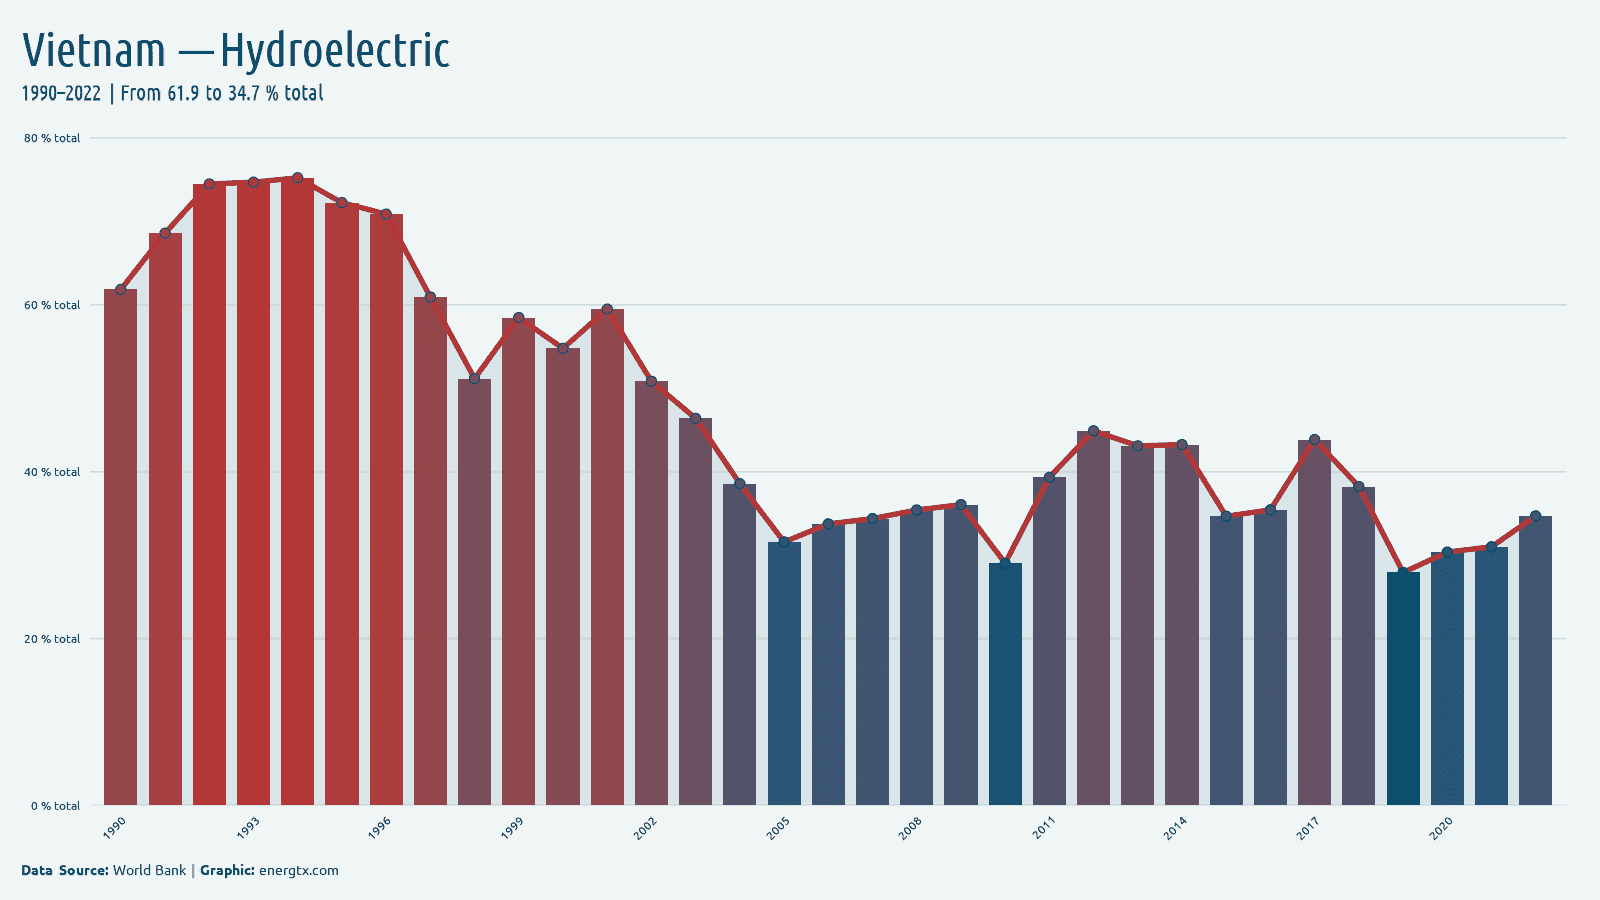
2022
Hydroelectric
34.7%
%
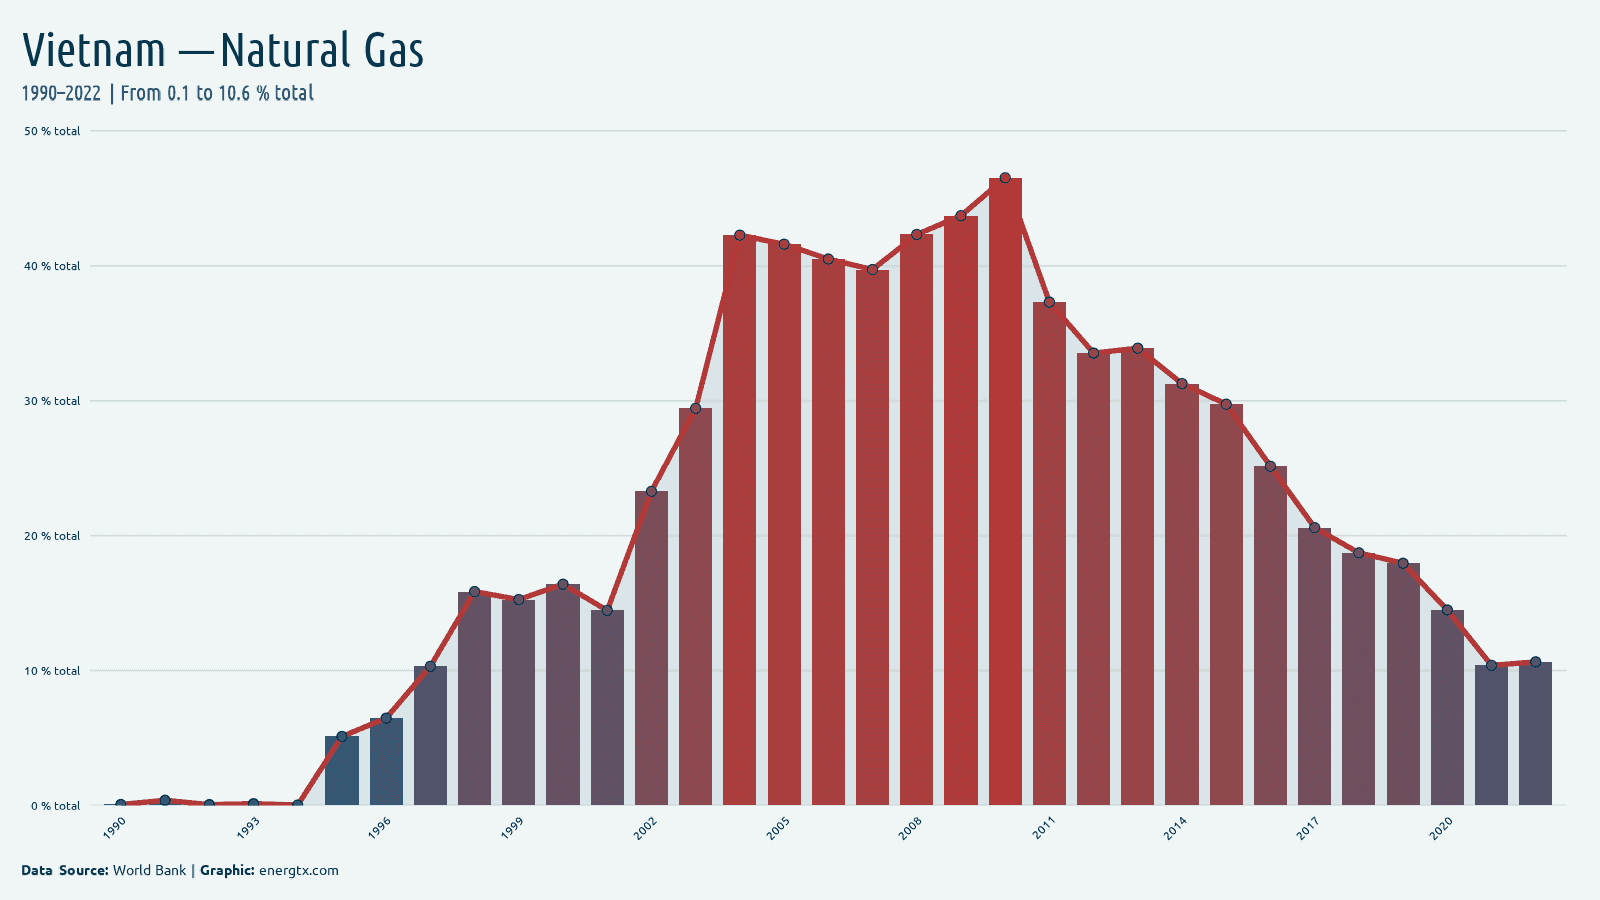
2022
Natural Gas
10.6%
%
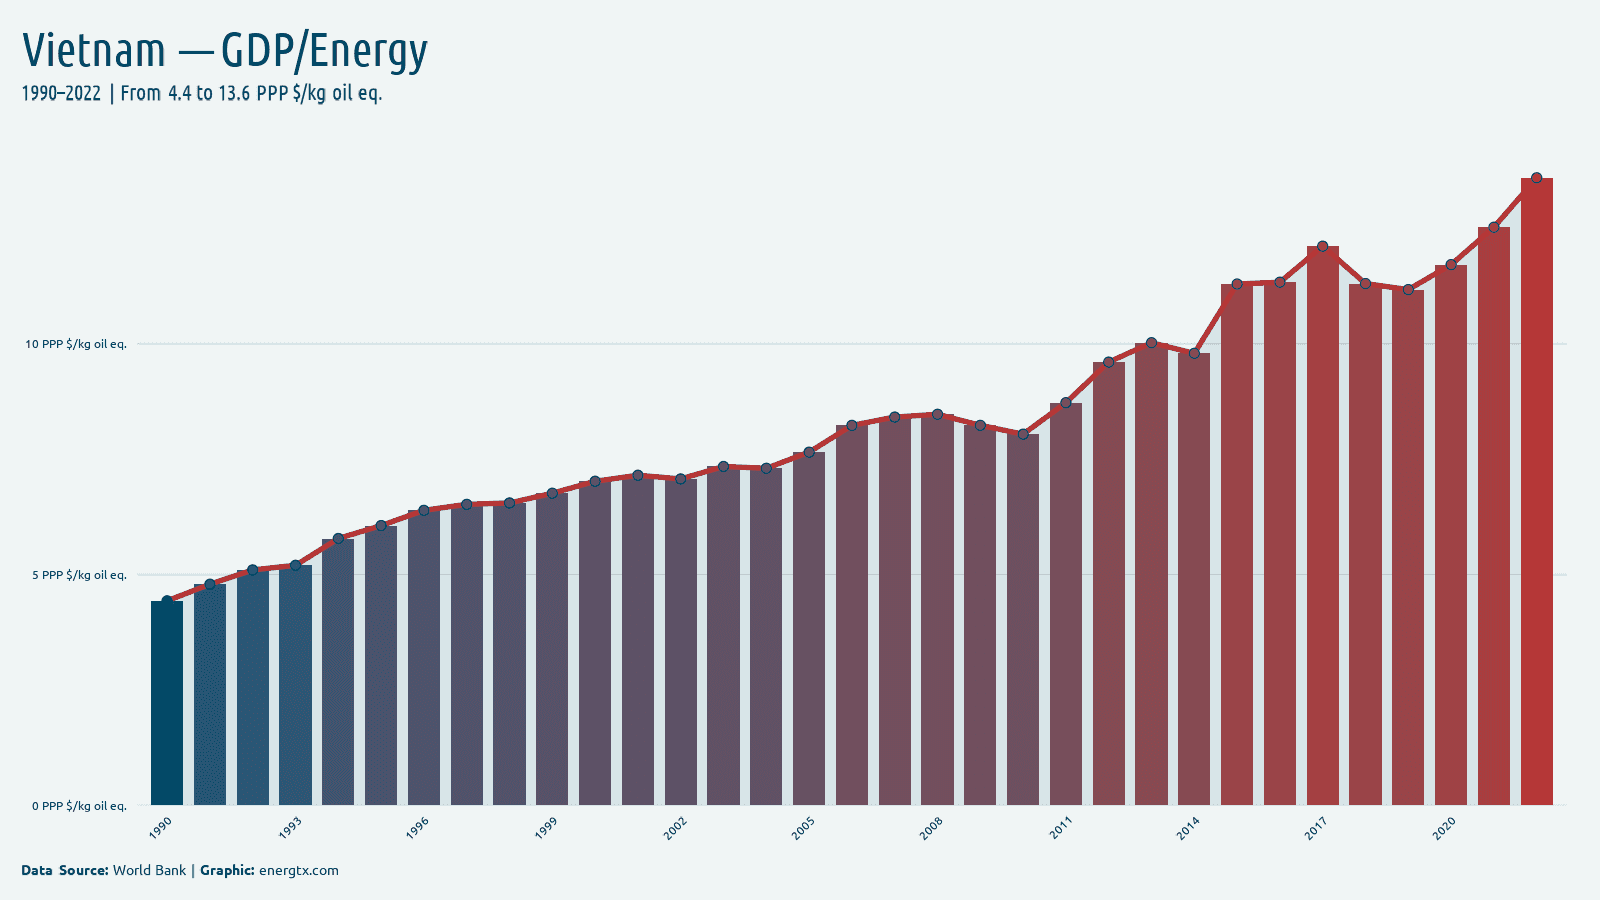
2022
GDP/Energy
13.6
PPP $/kg oil eq.
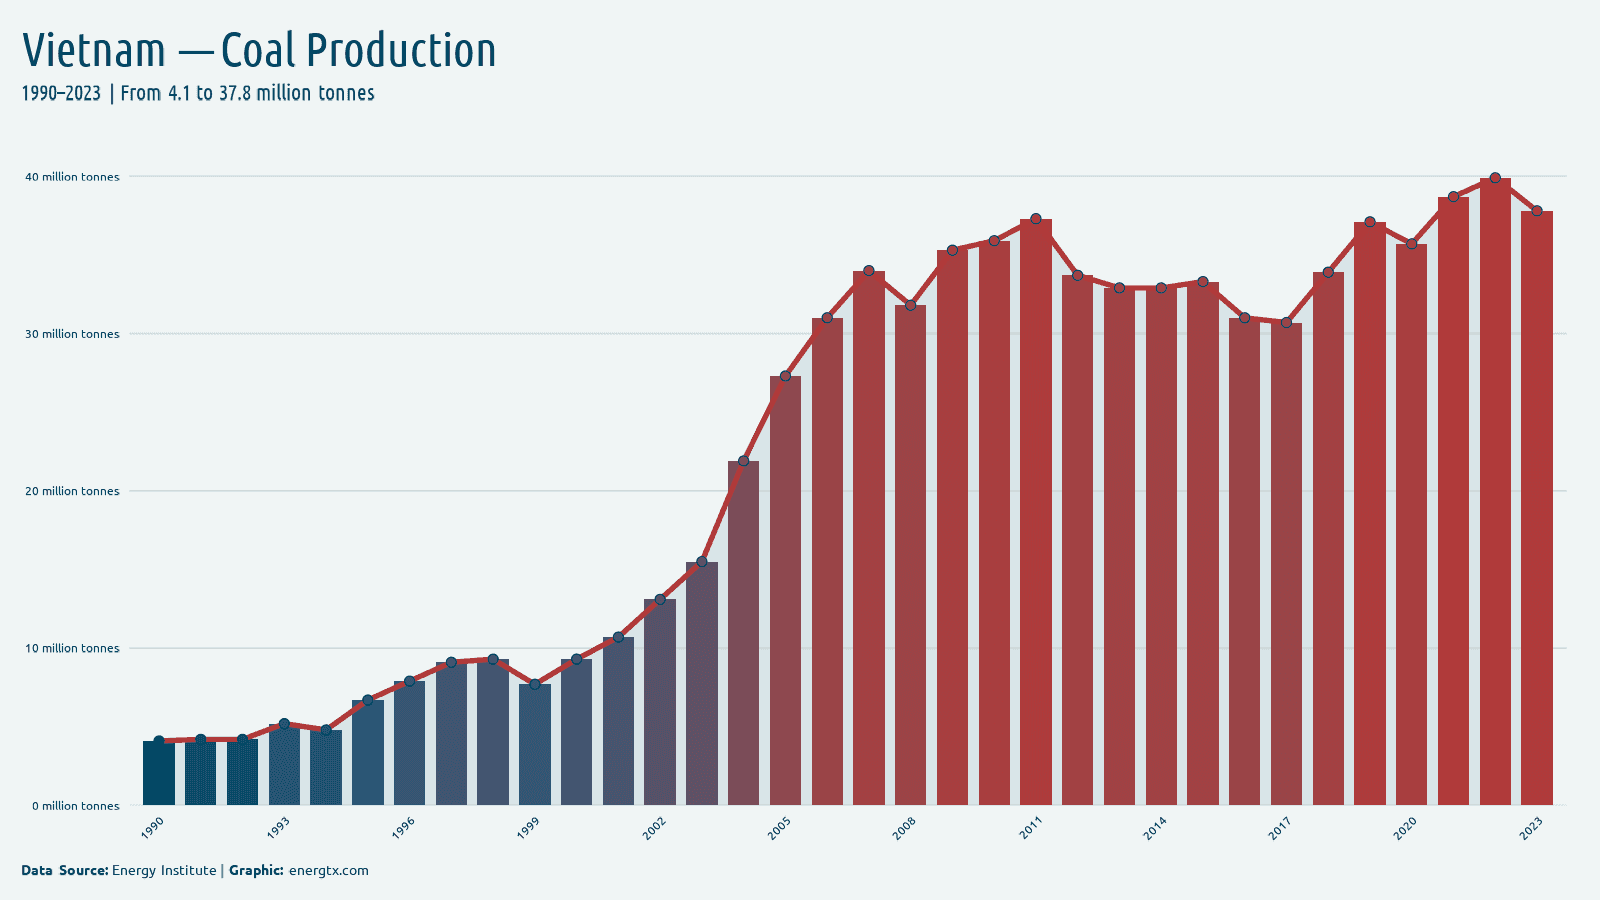
2023
Coal Production
37.8
Mt
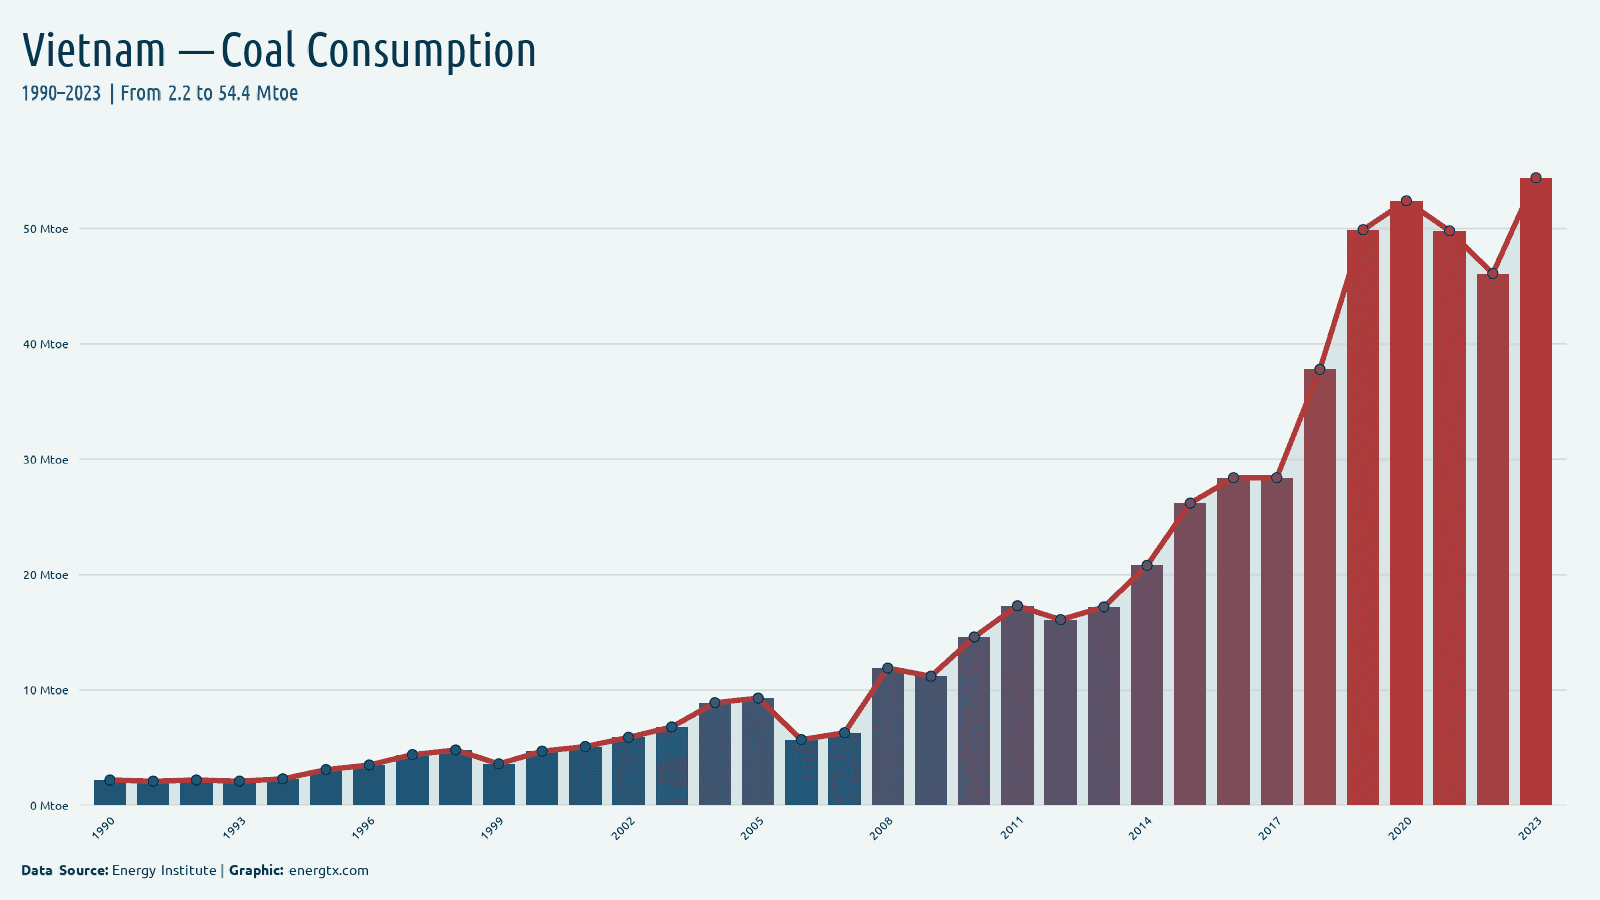
2023
Coal Consumption
54.4
Mtoe
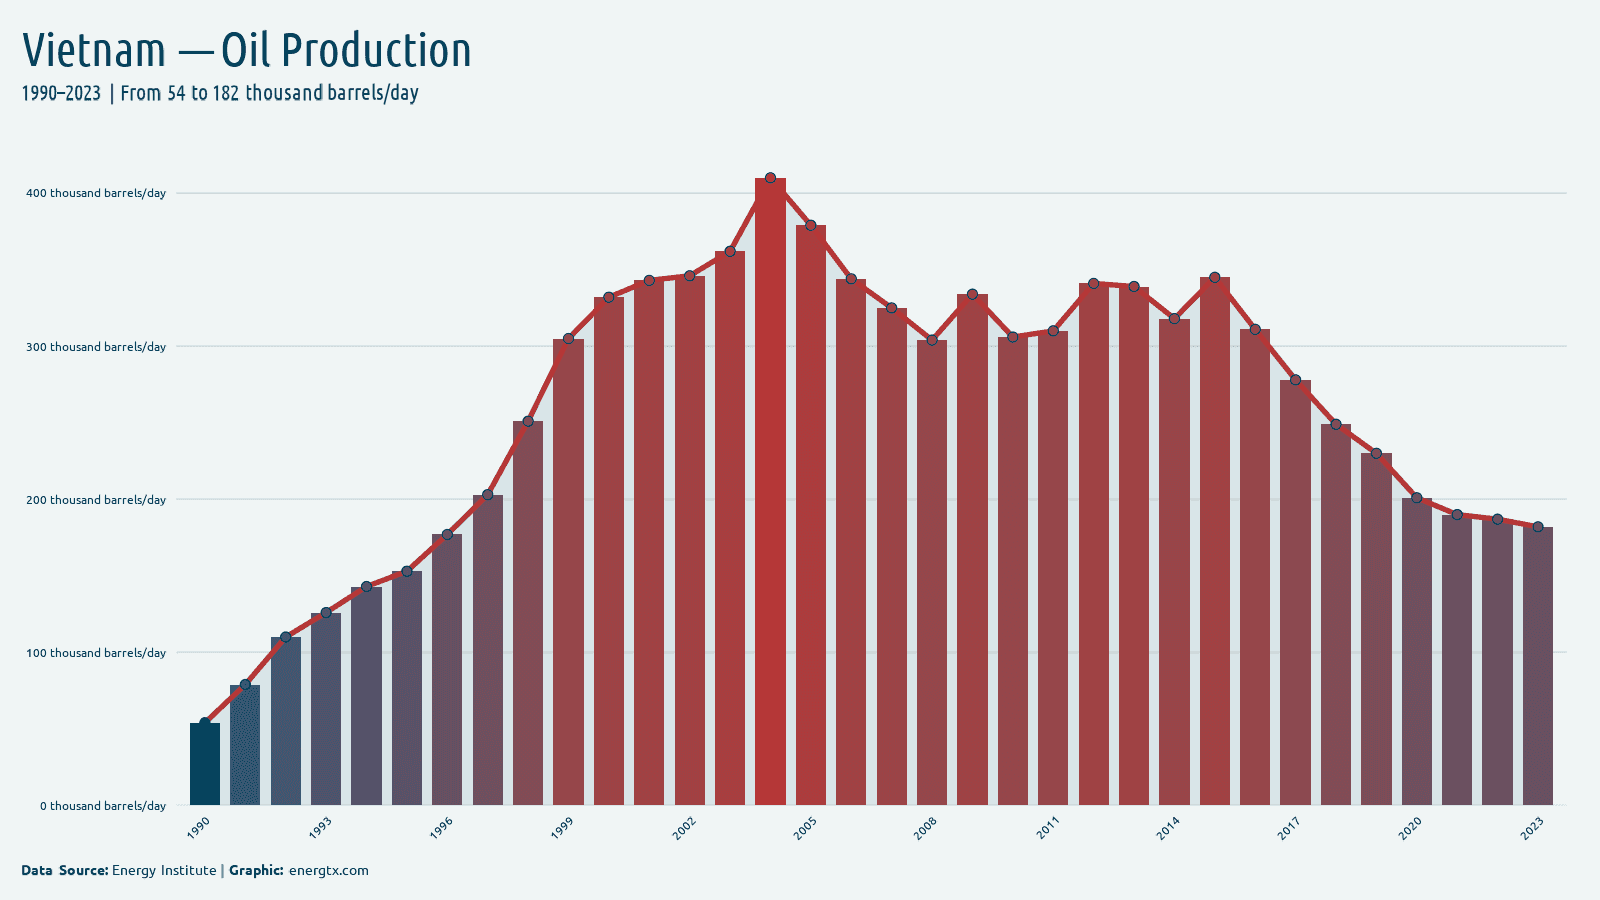
2023
Oil Production
182.0
k barrels/day
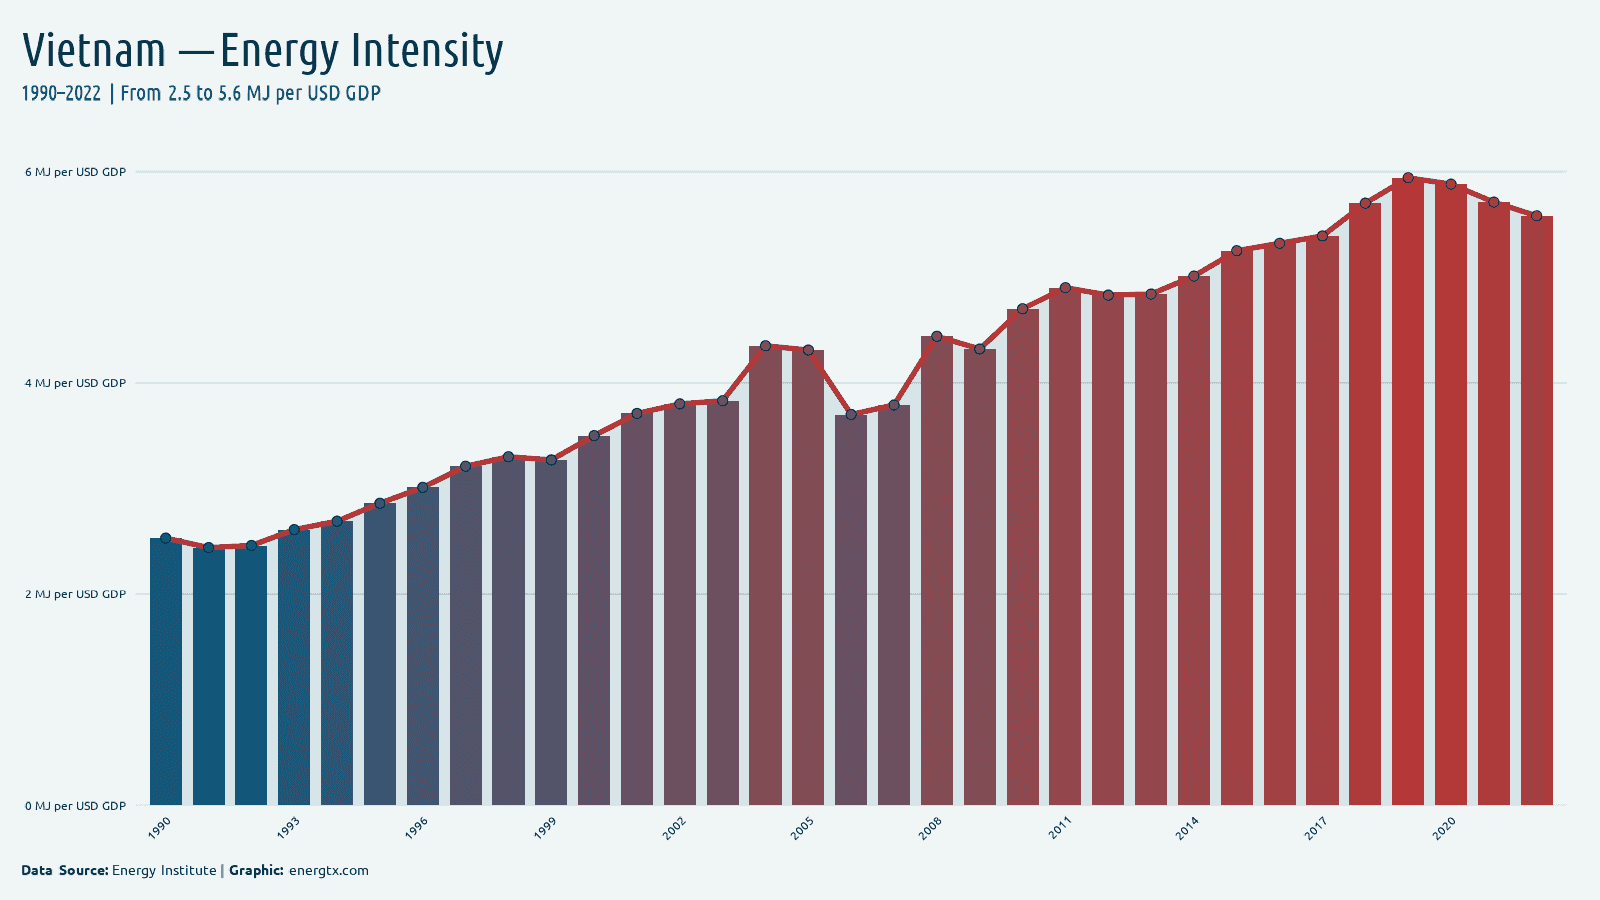
2022
Energy Intensity
5.6
MJ/$ GDP
2023
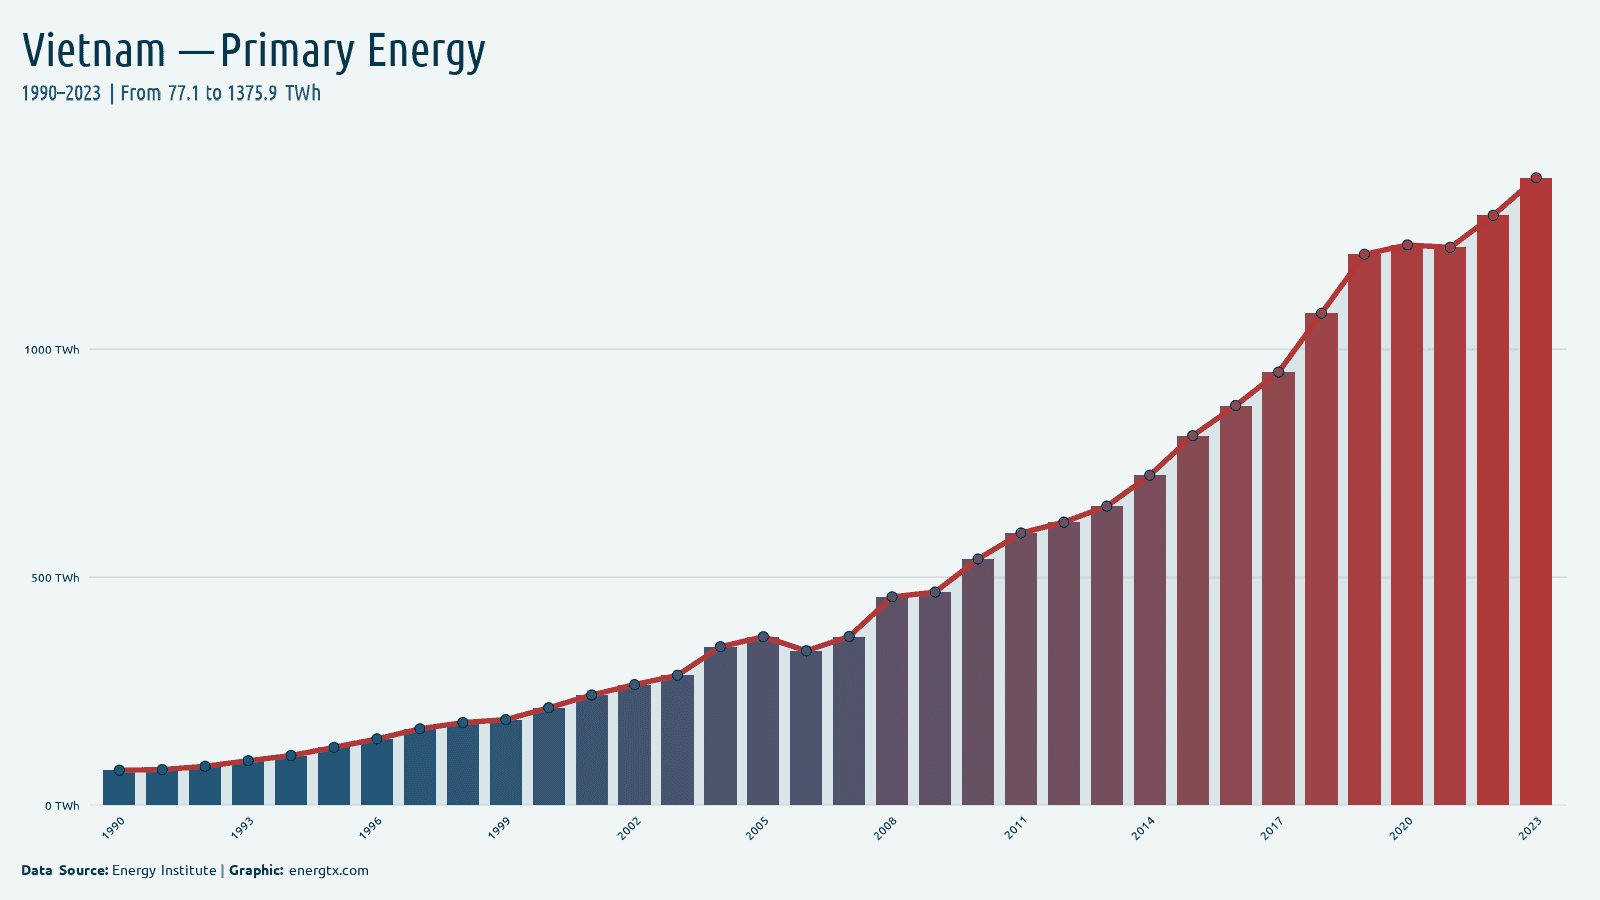
Primary Energy
1.4k
TWh
2023
Fossil Fuel Consumption
1.1k
TWh
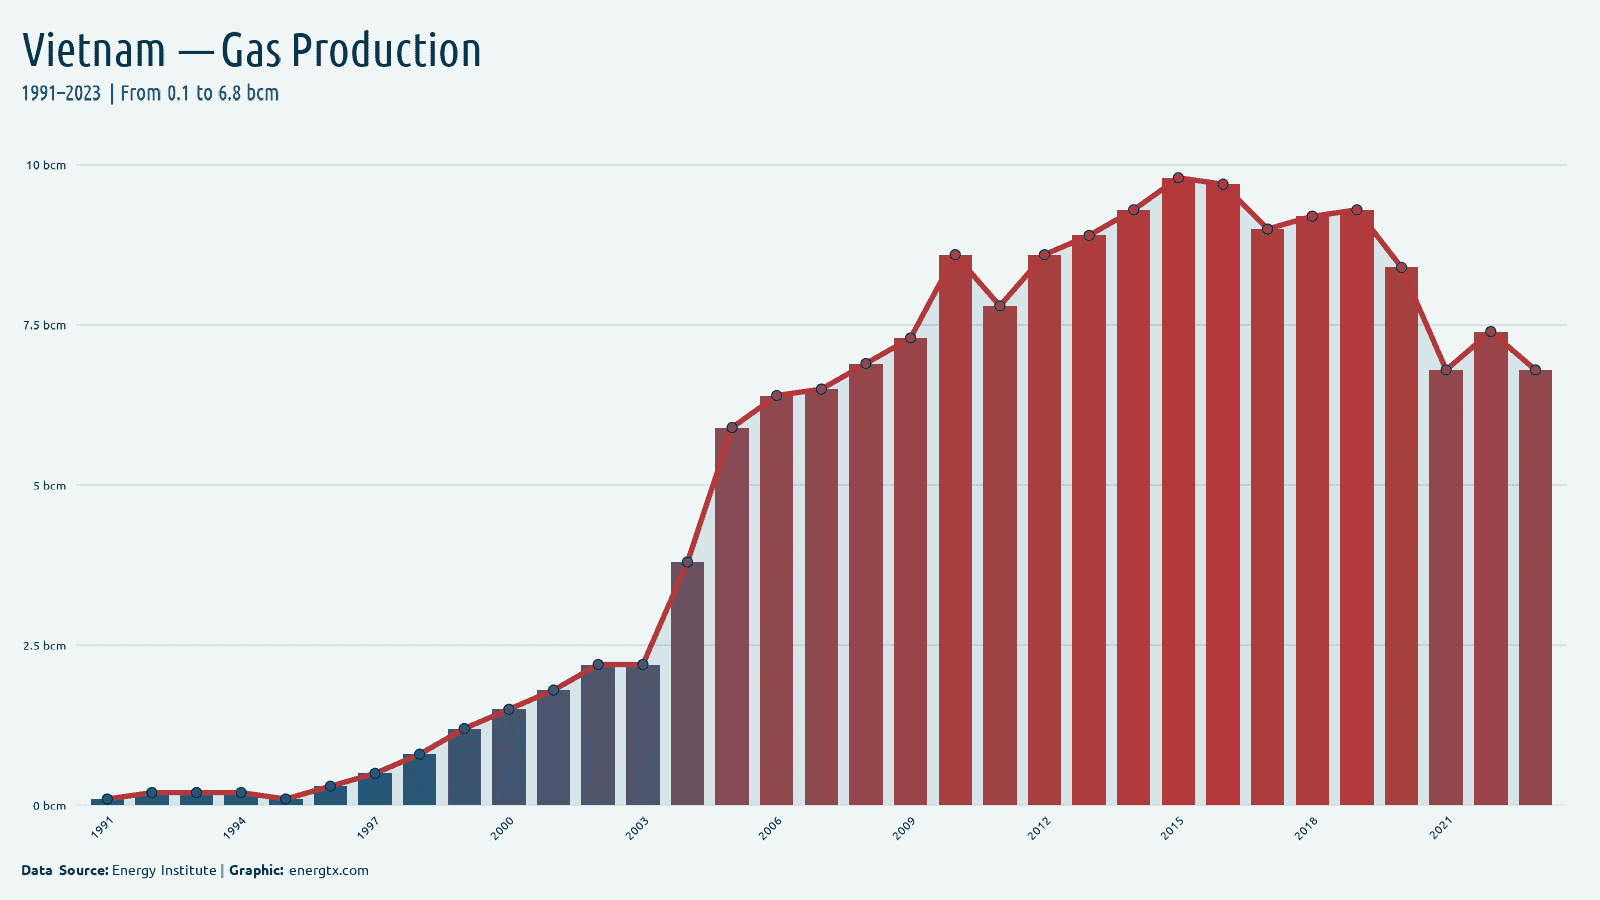
2023
Gas Production
6.8
bcm
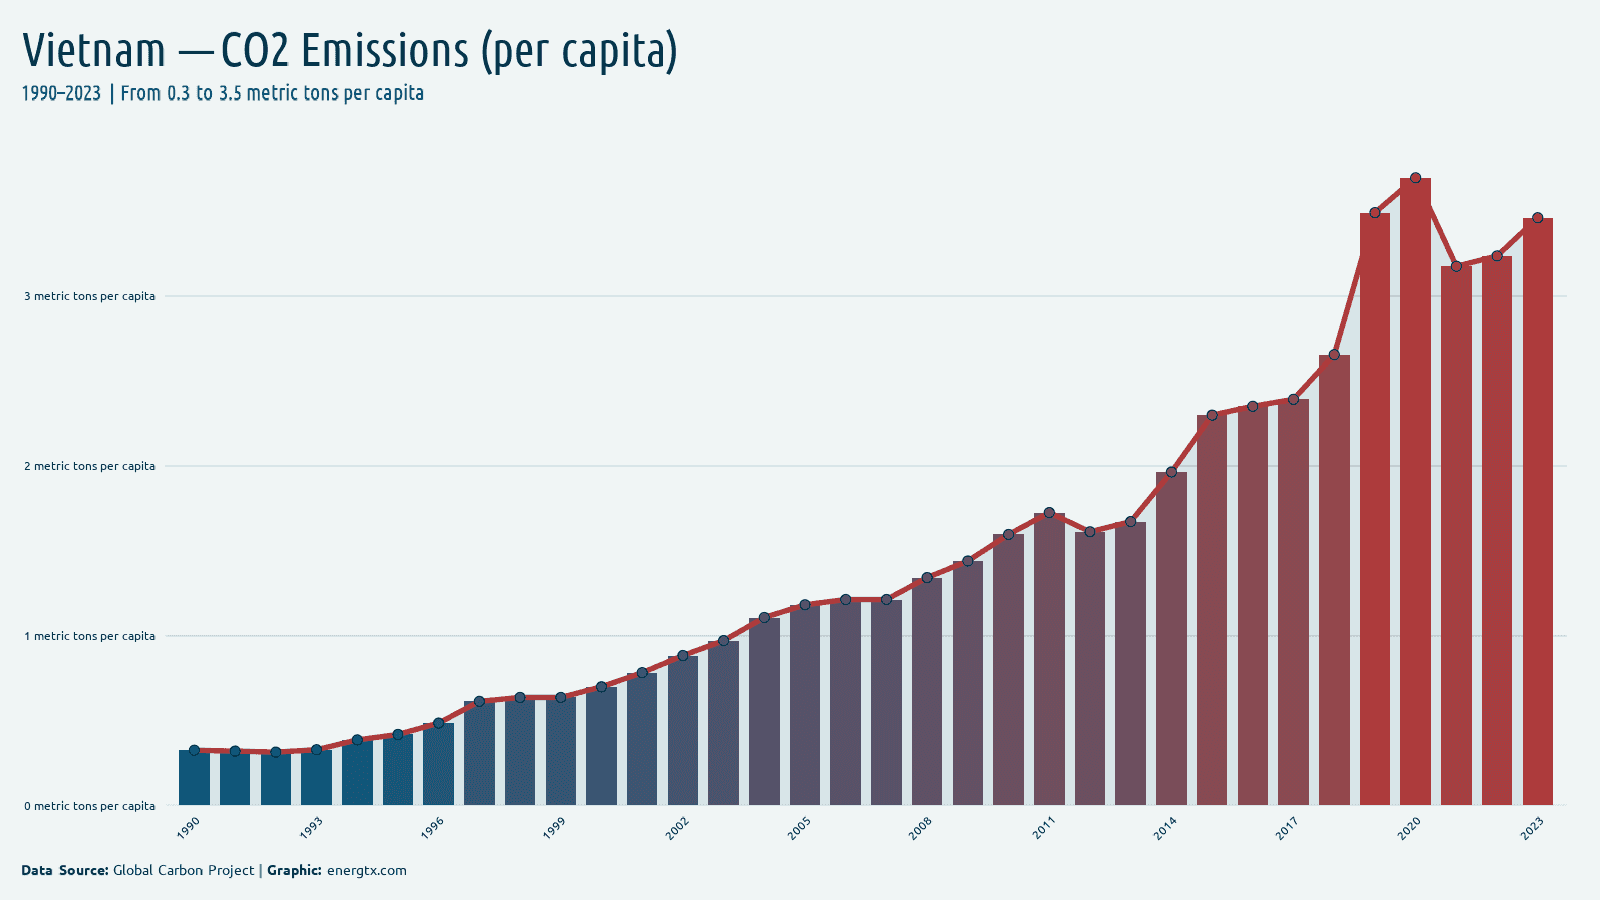
2023
CO2 Emissions (per capita)
3.5
metric tons/capita
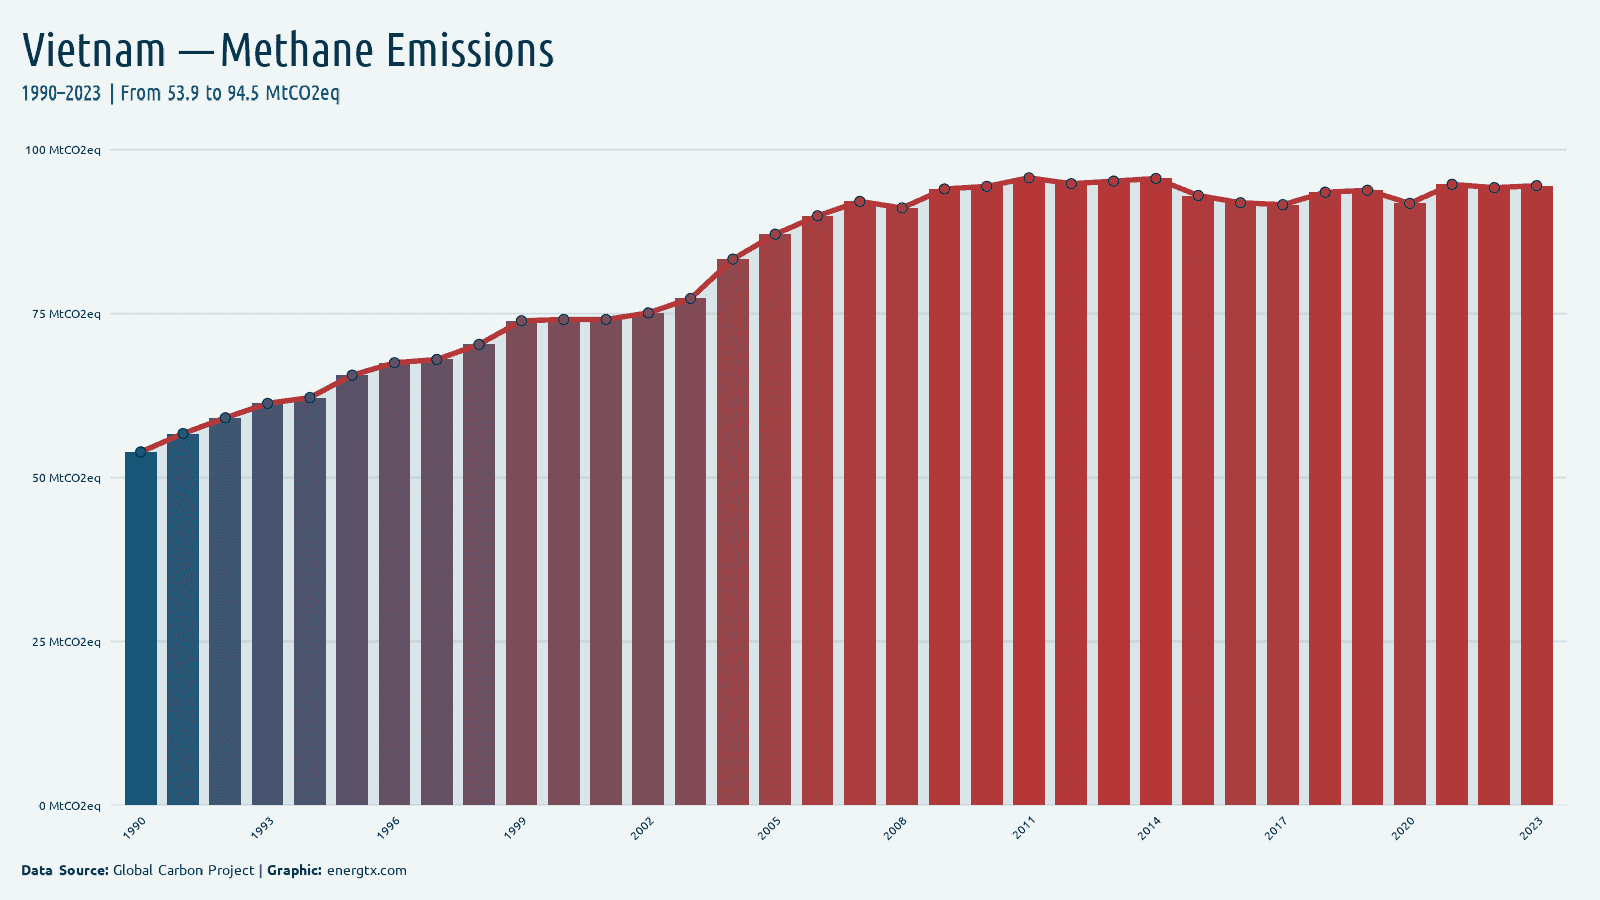
2023
Methane Emissions
94.5
MtCO2eq
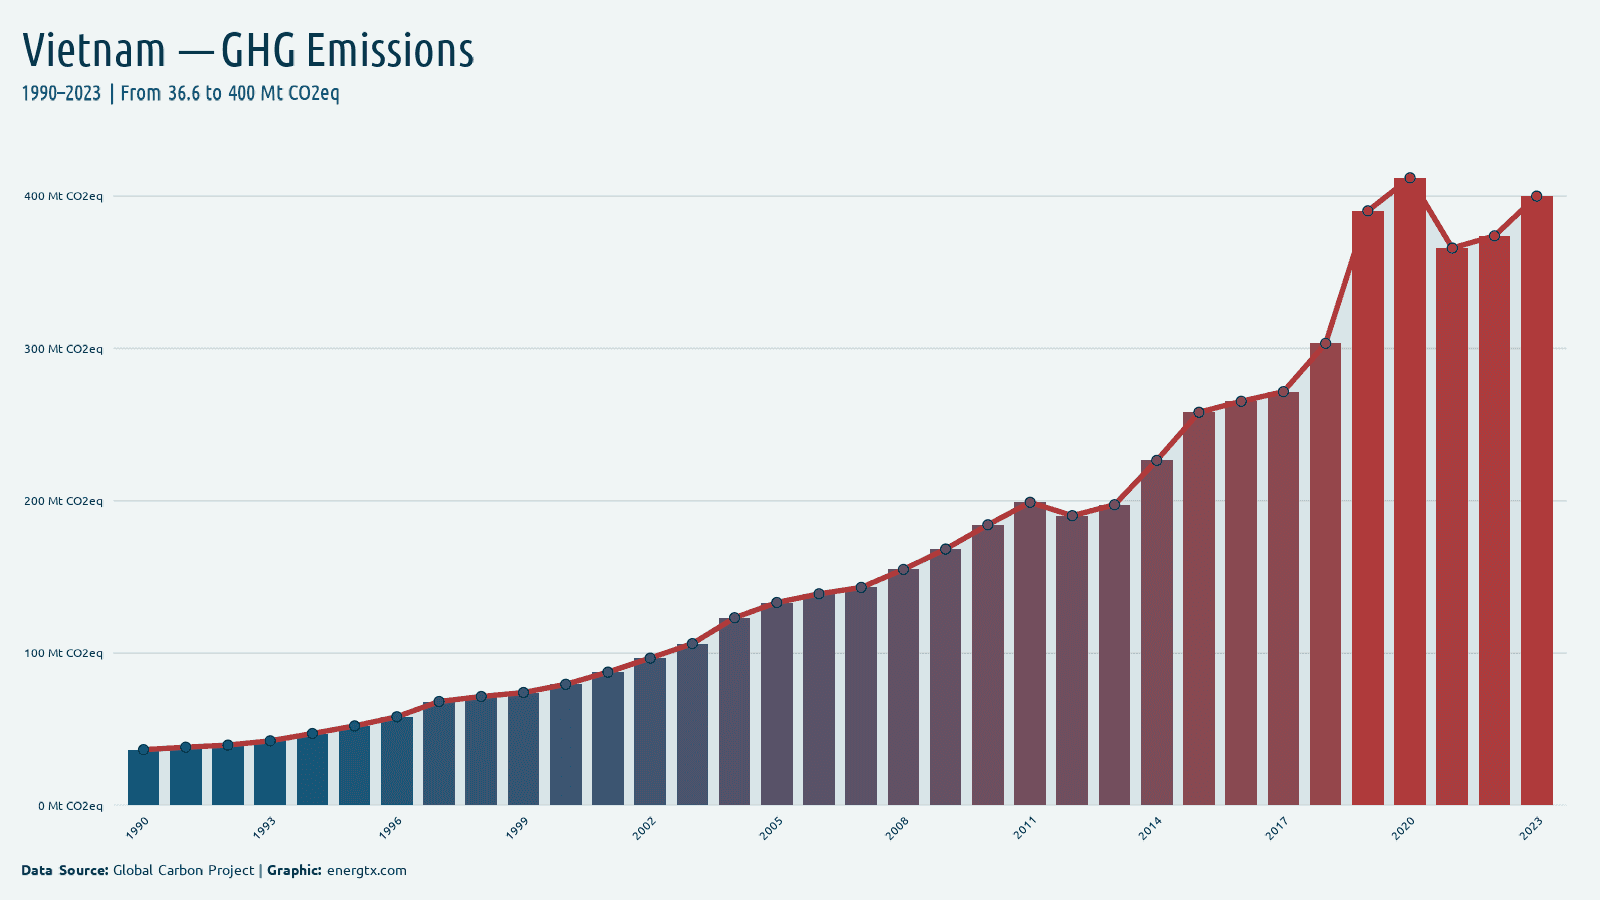
2023
GHG Emissions
400.0
MtCO2eq
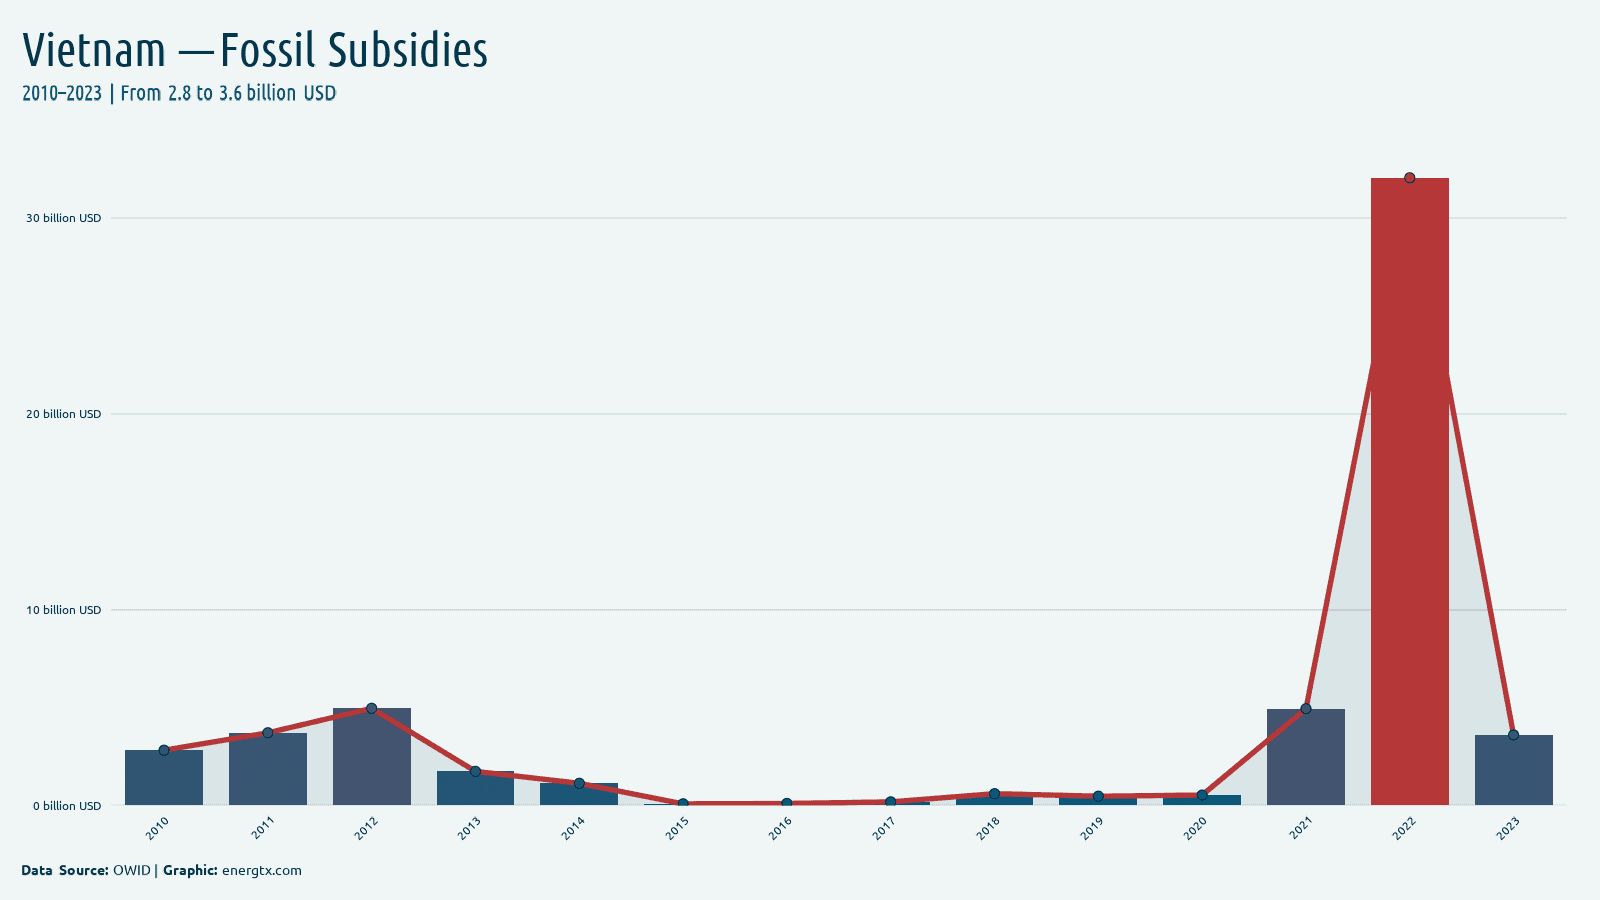
2023
Fossil Subsidies
3.6
billion $
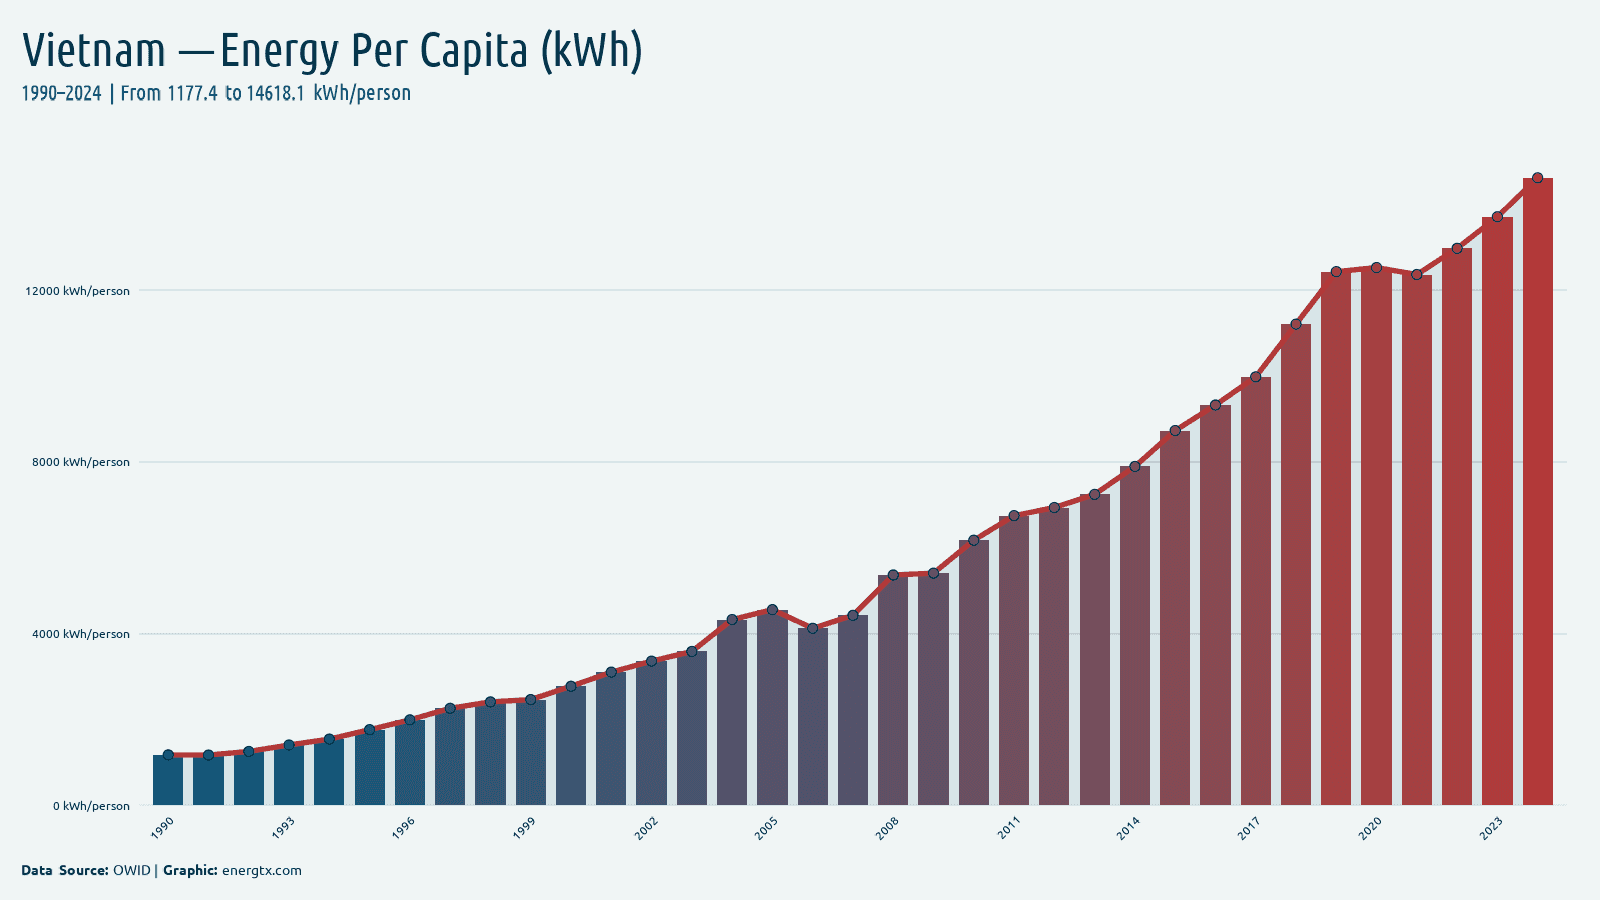
2024
Energy Use Per Capita (kWh)
14.6k
kWh/capita
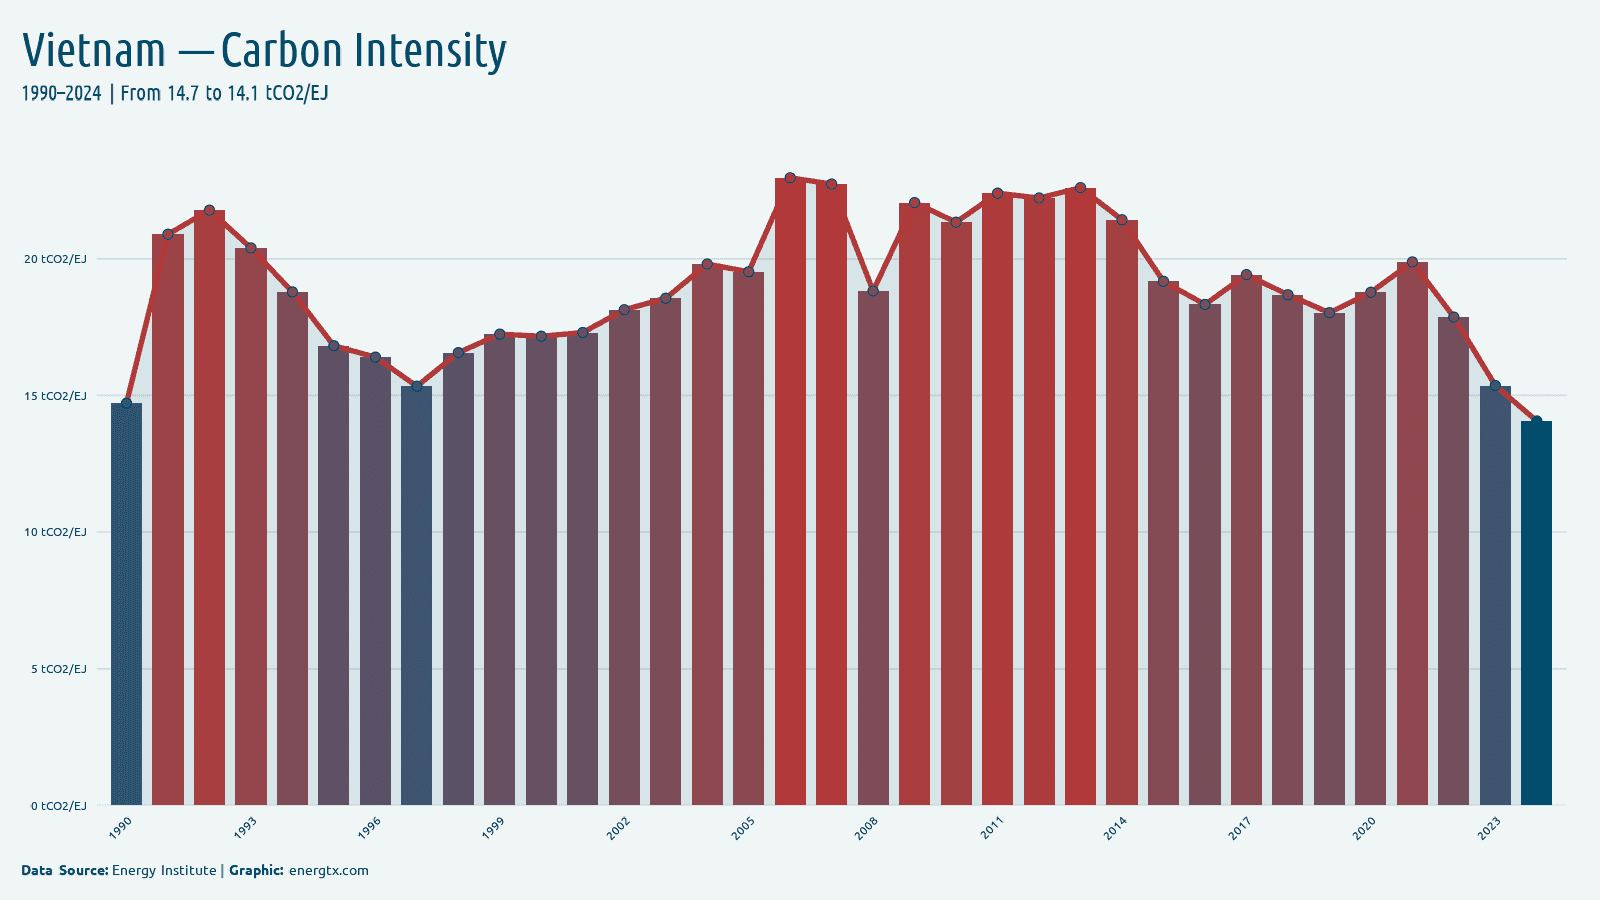
2024
Carbon Intensity
14.1
tCO2/EJ
2024
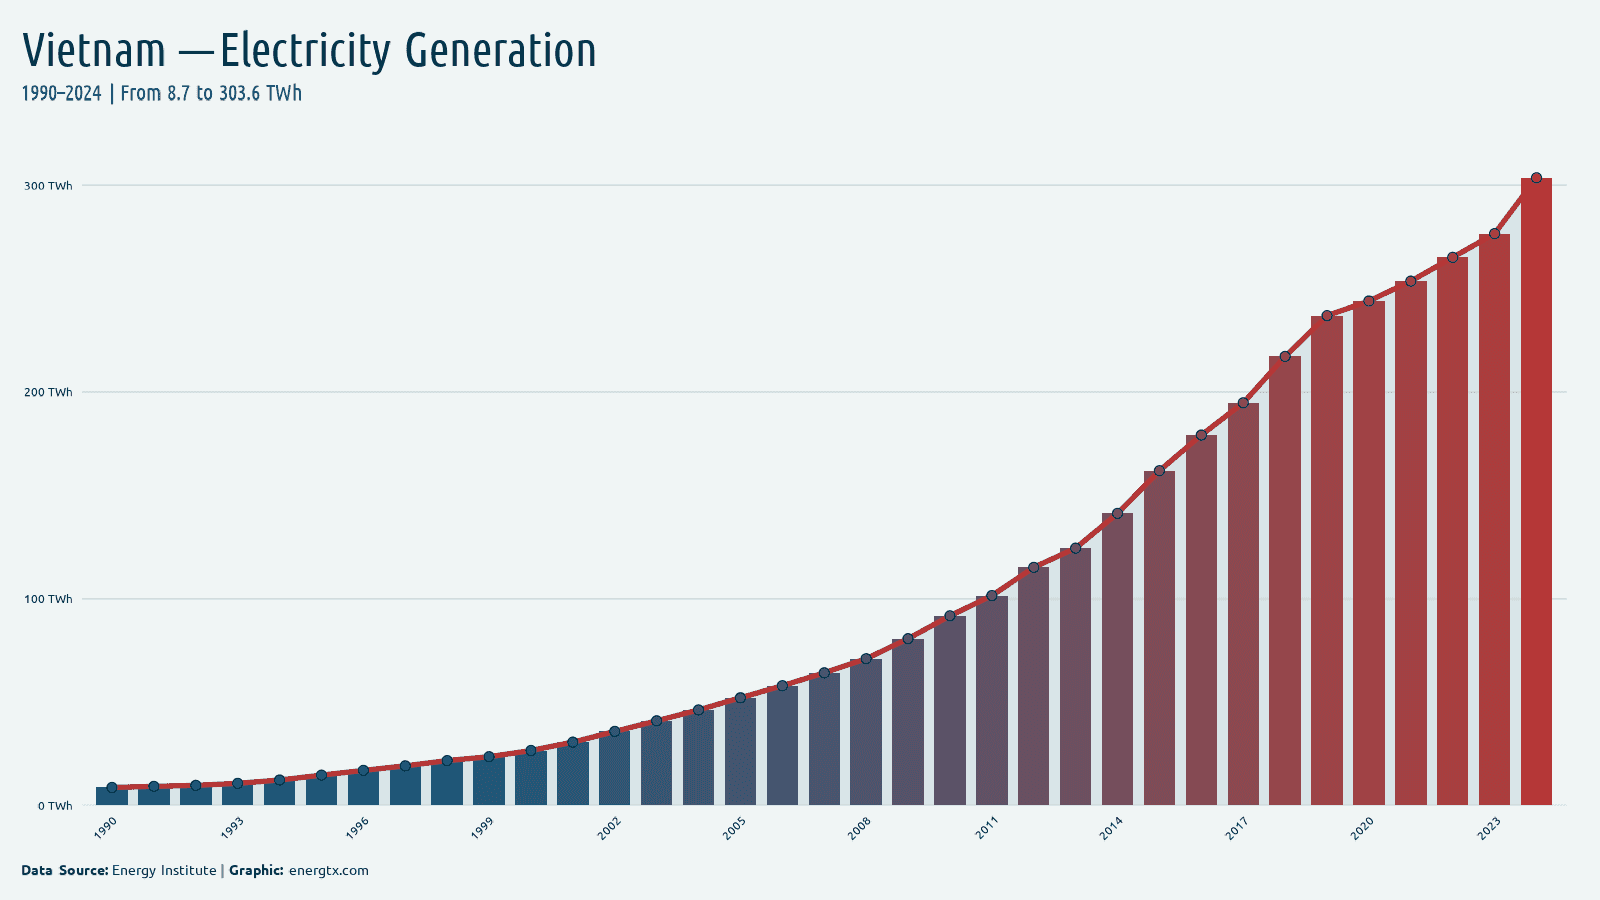
Electricity Generation
303.6
TWh
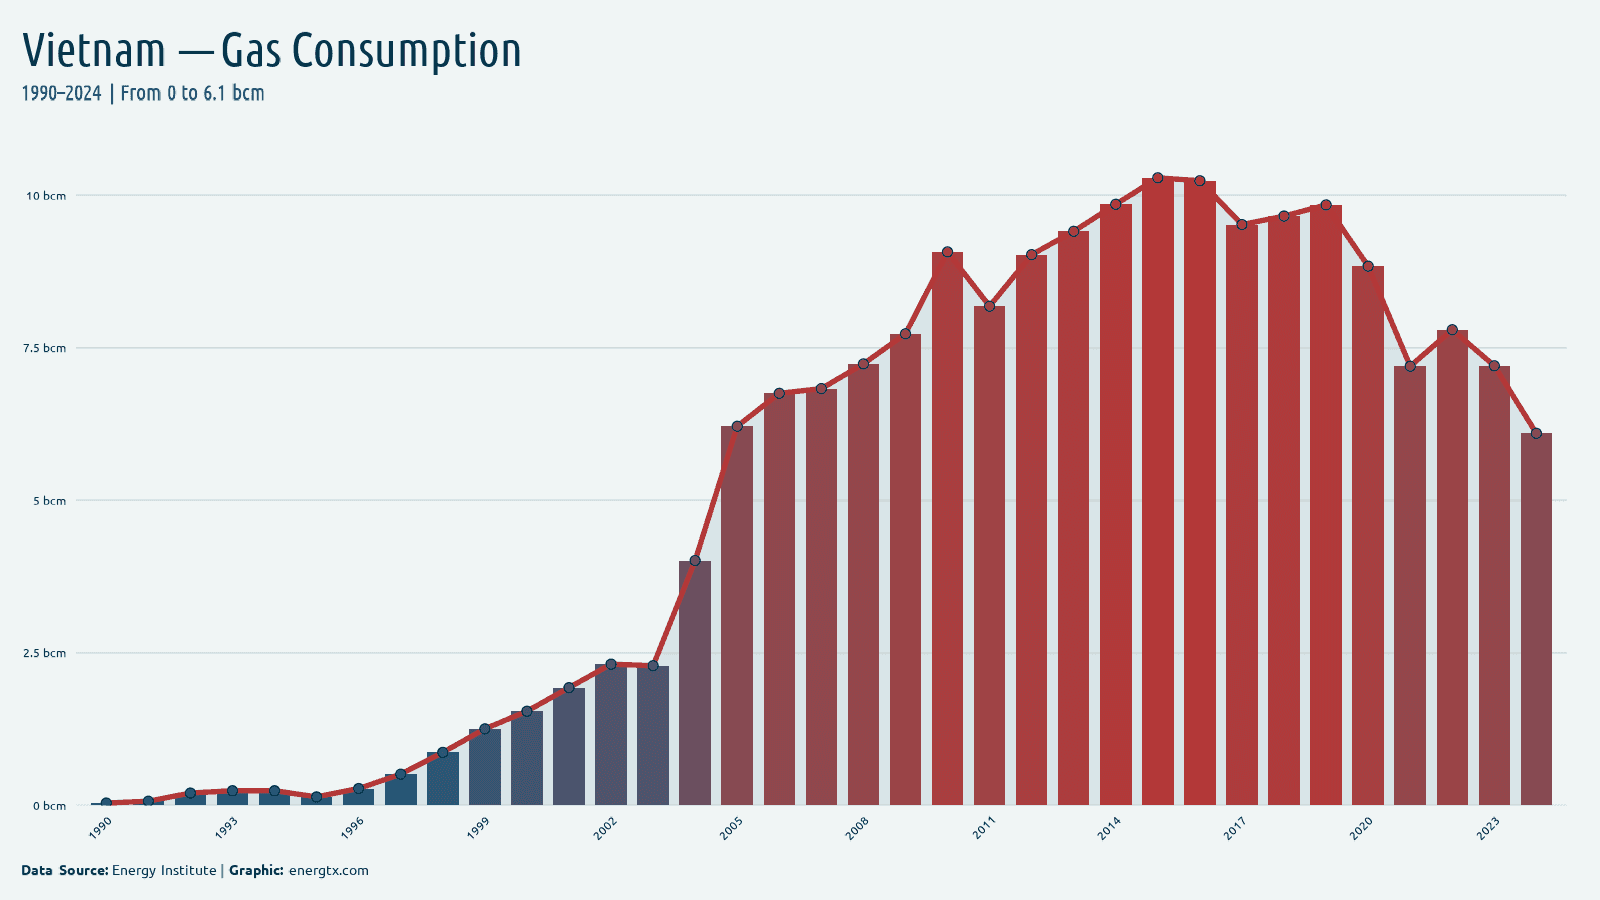
2024
Gas Consumption
6.1
bcm
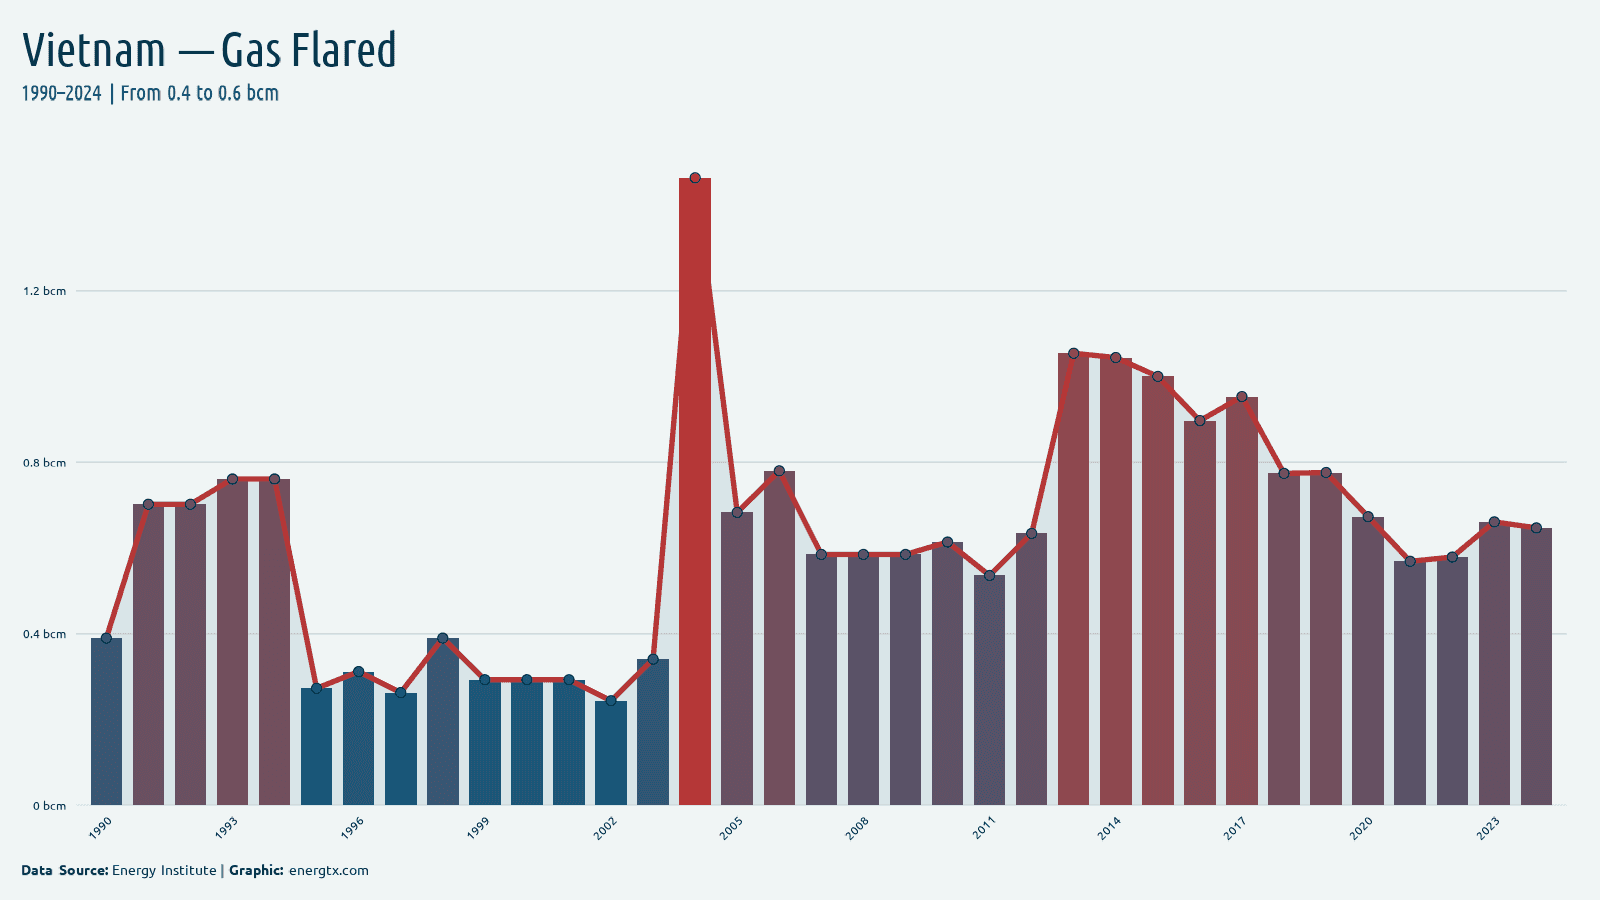
2024
Gas Flared
0.6
bcm
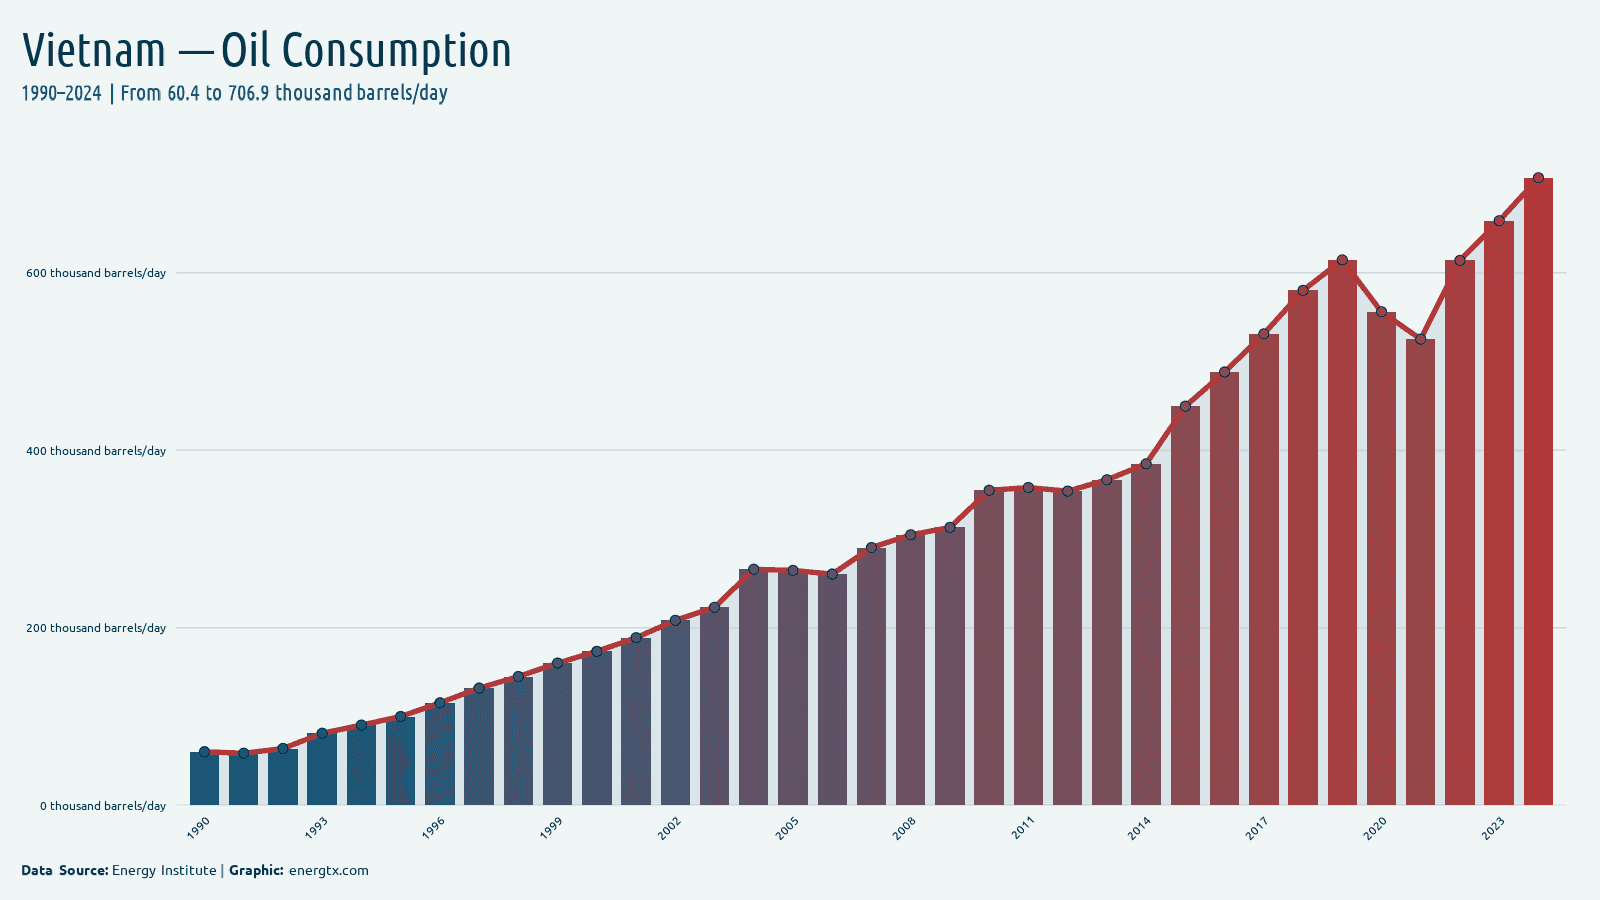
2024
Oil Consumption
706.9
k barrels/day
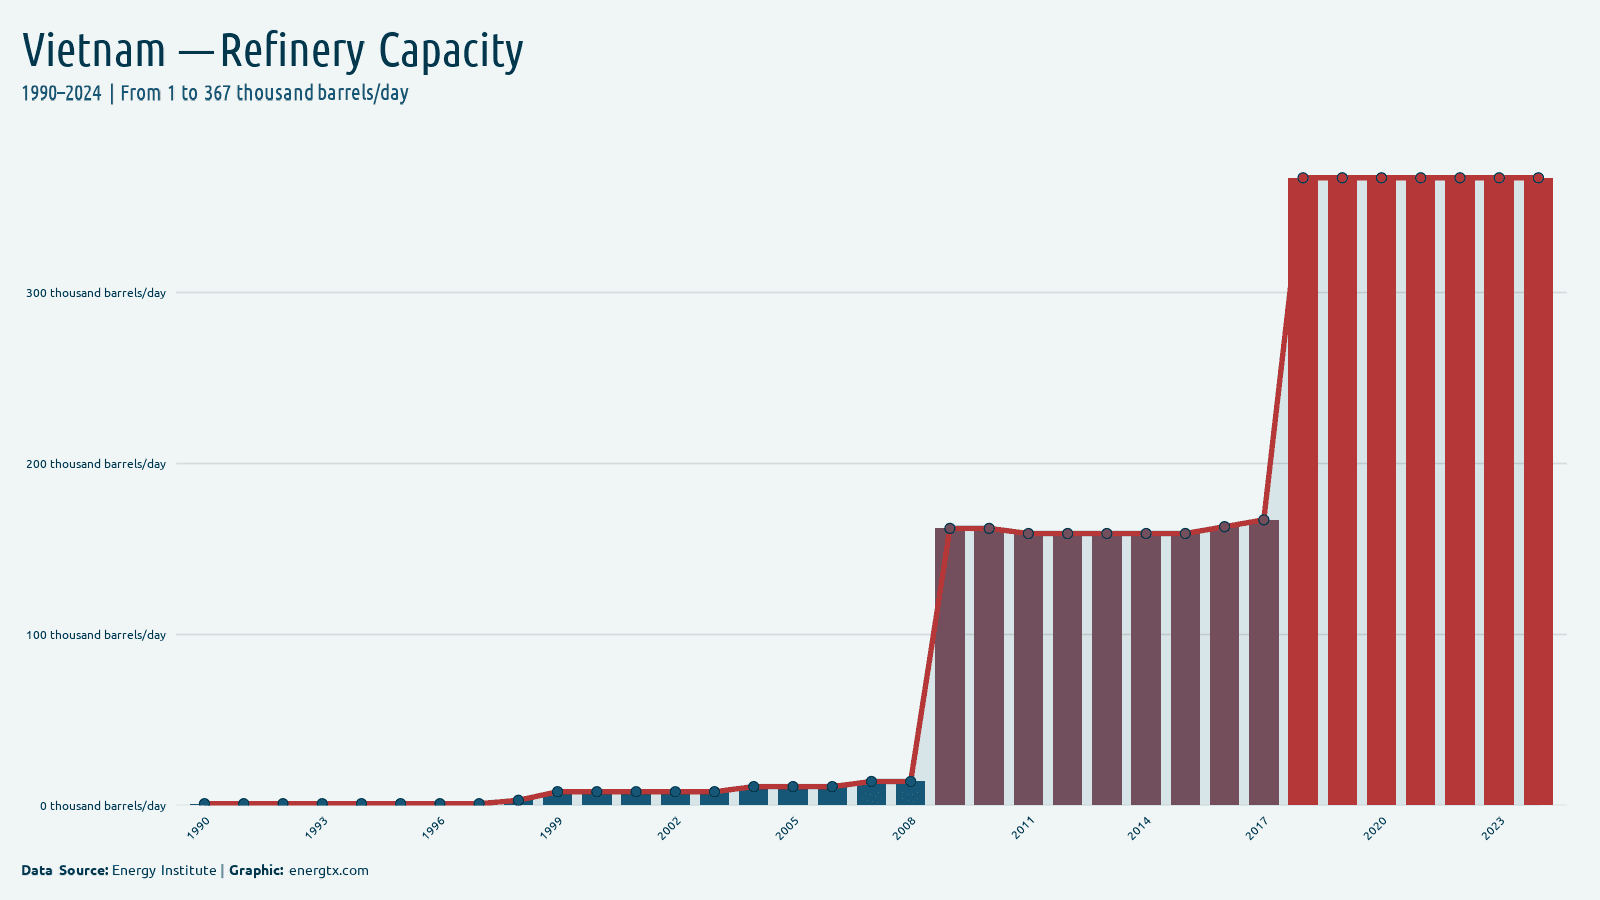
2024
Refinery Capacity
367.0
k barrels/day
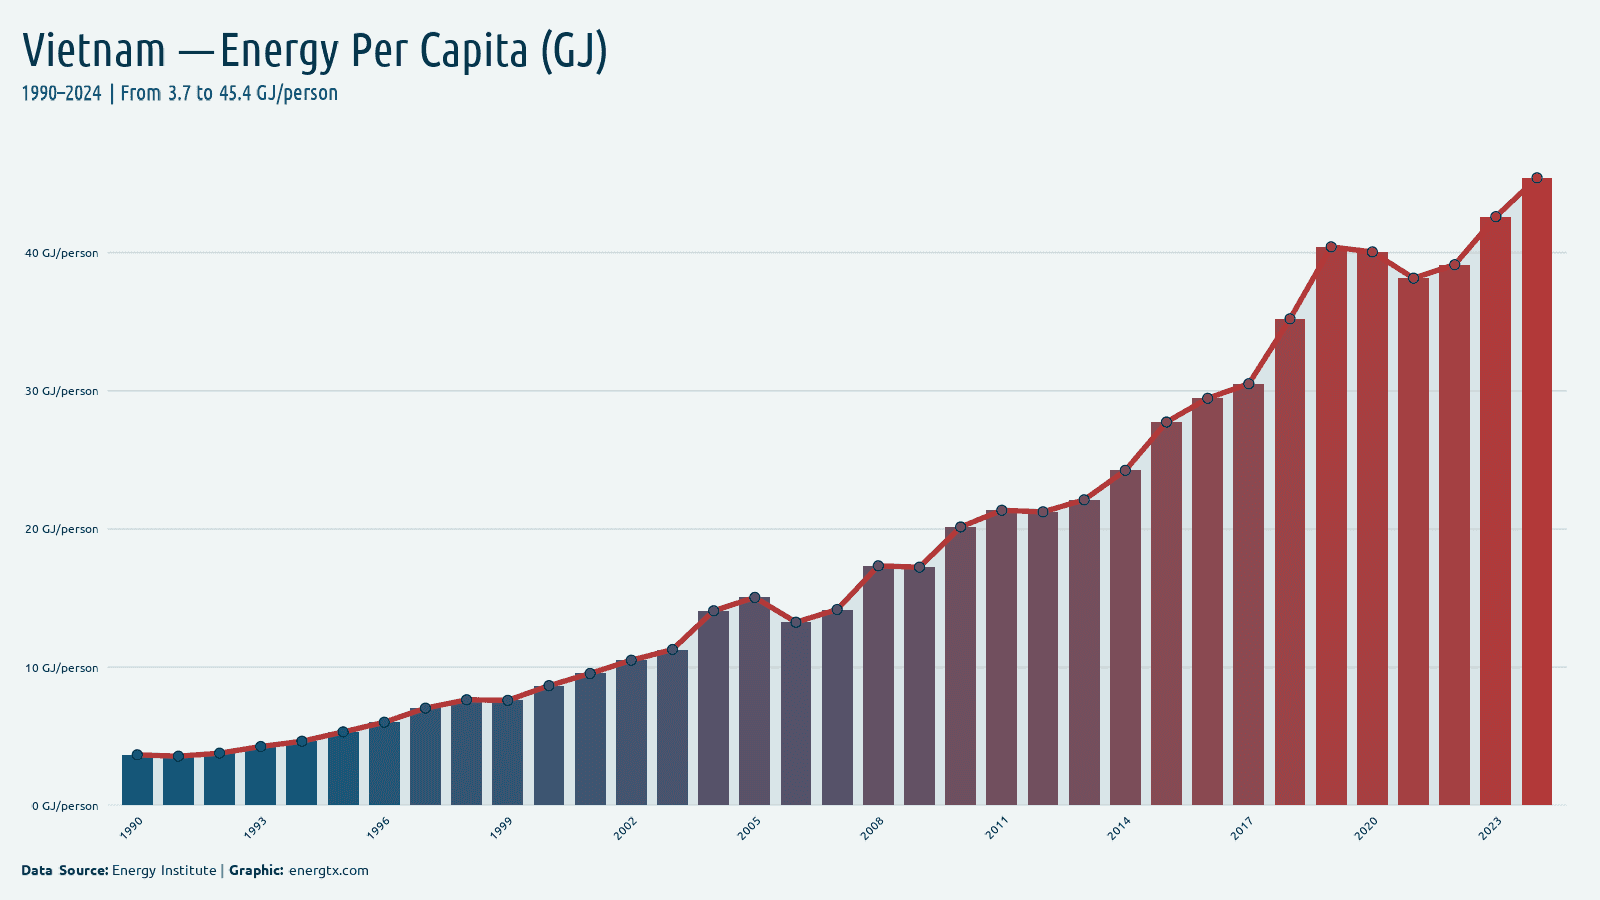
2024
Energy Per Capita (GJ)
45.4
GJ/person
2024
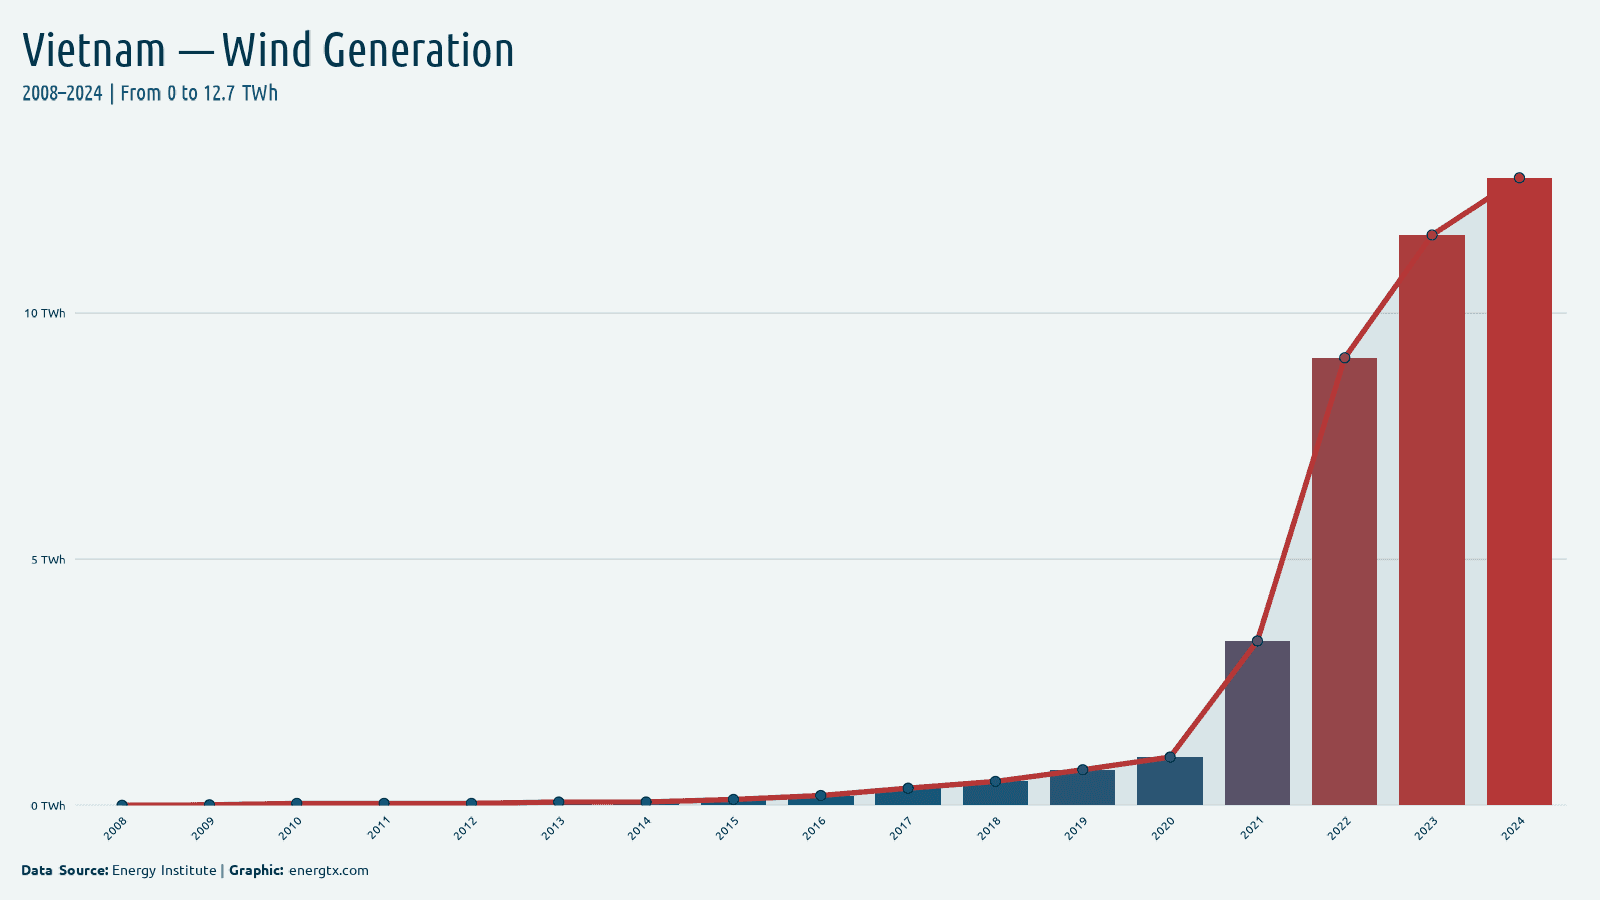
Wind Generation
12.7
TWh
2024
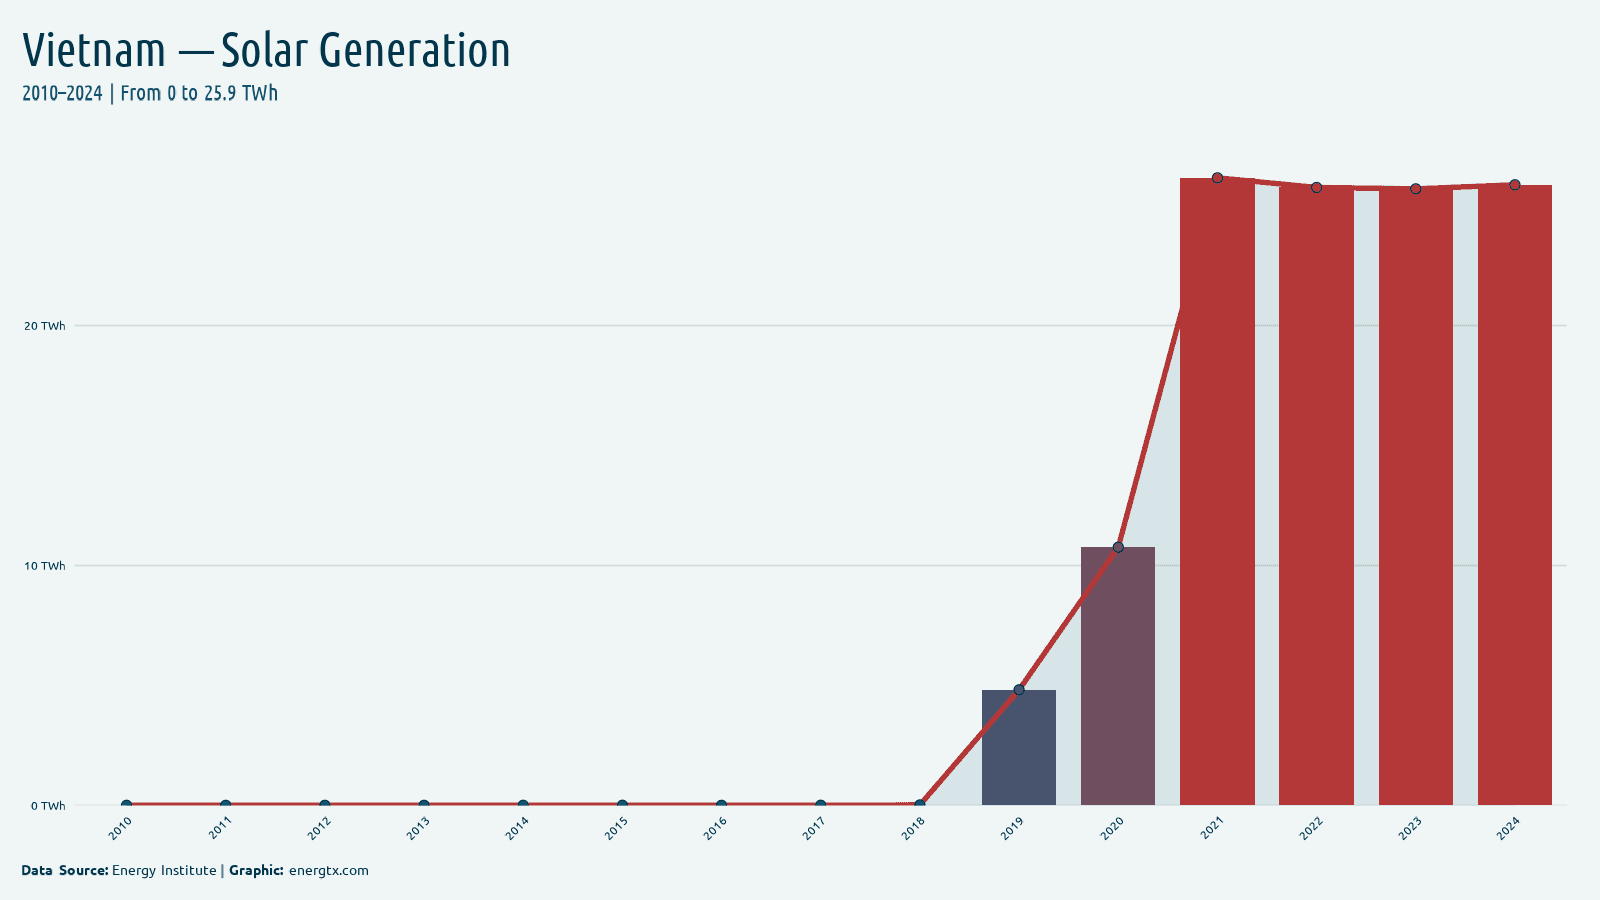
Solar Generation
25.9
TWh
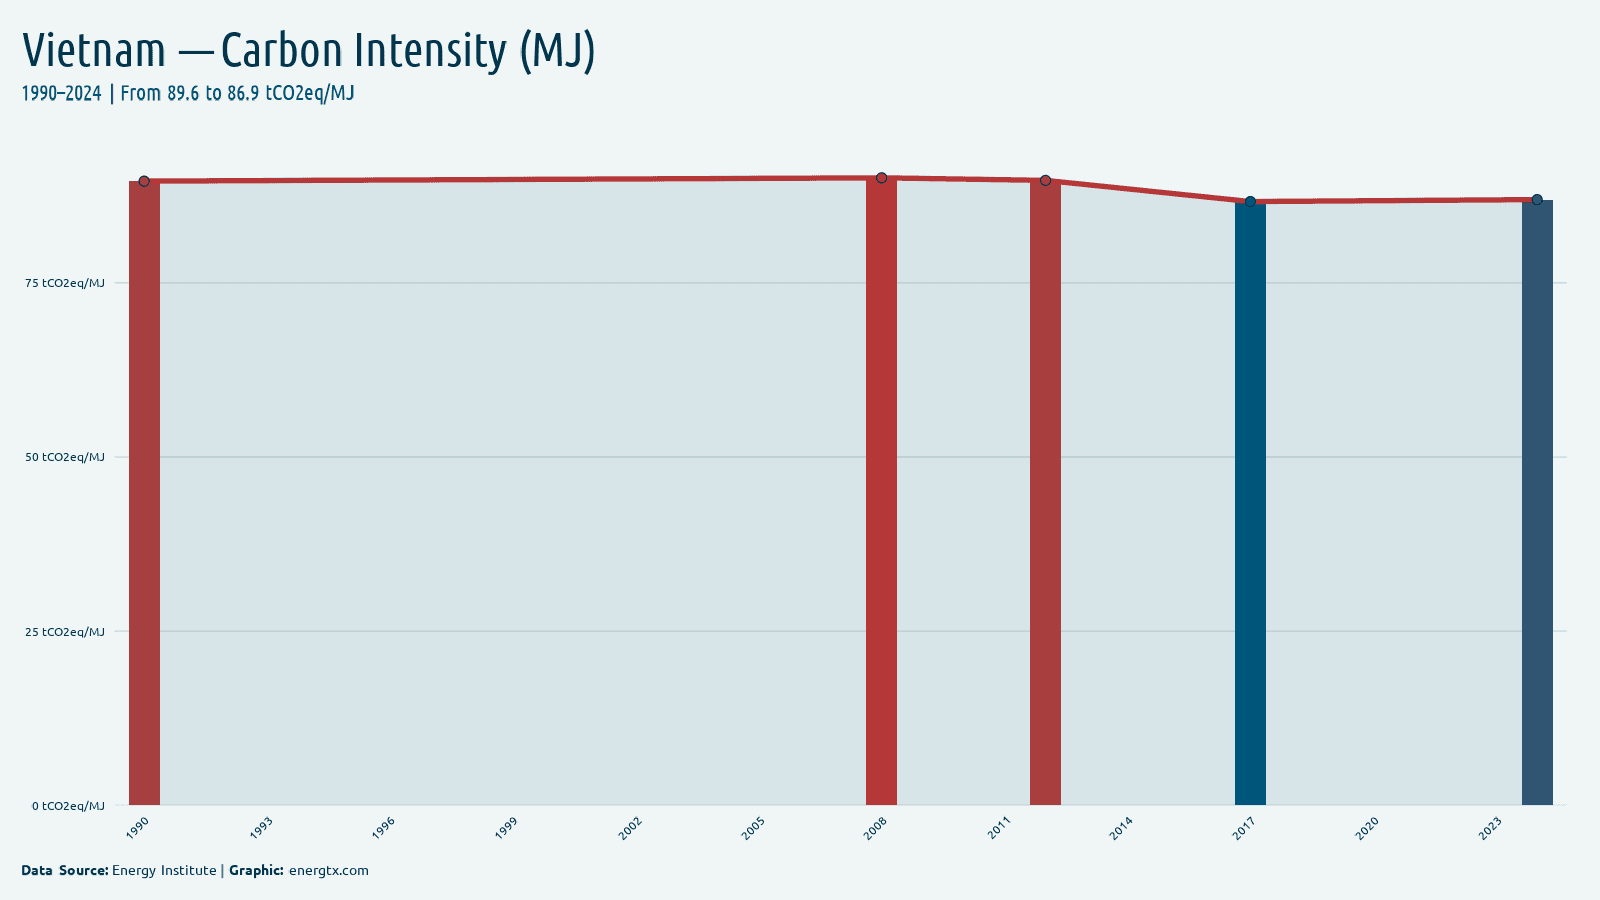
2024
Carbon Intensity (MJ)
86.9
tCO2eq/MJ
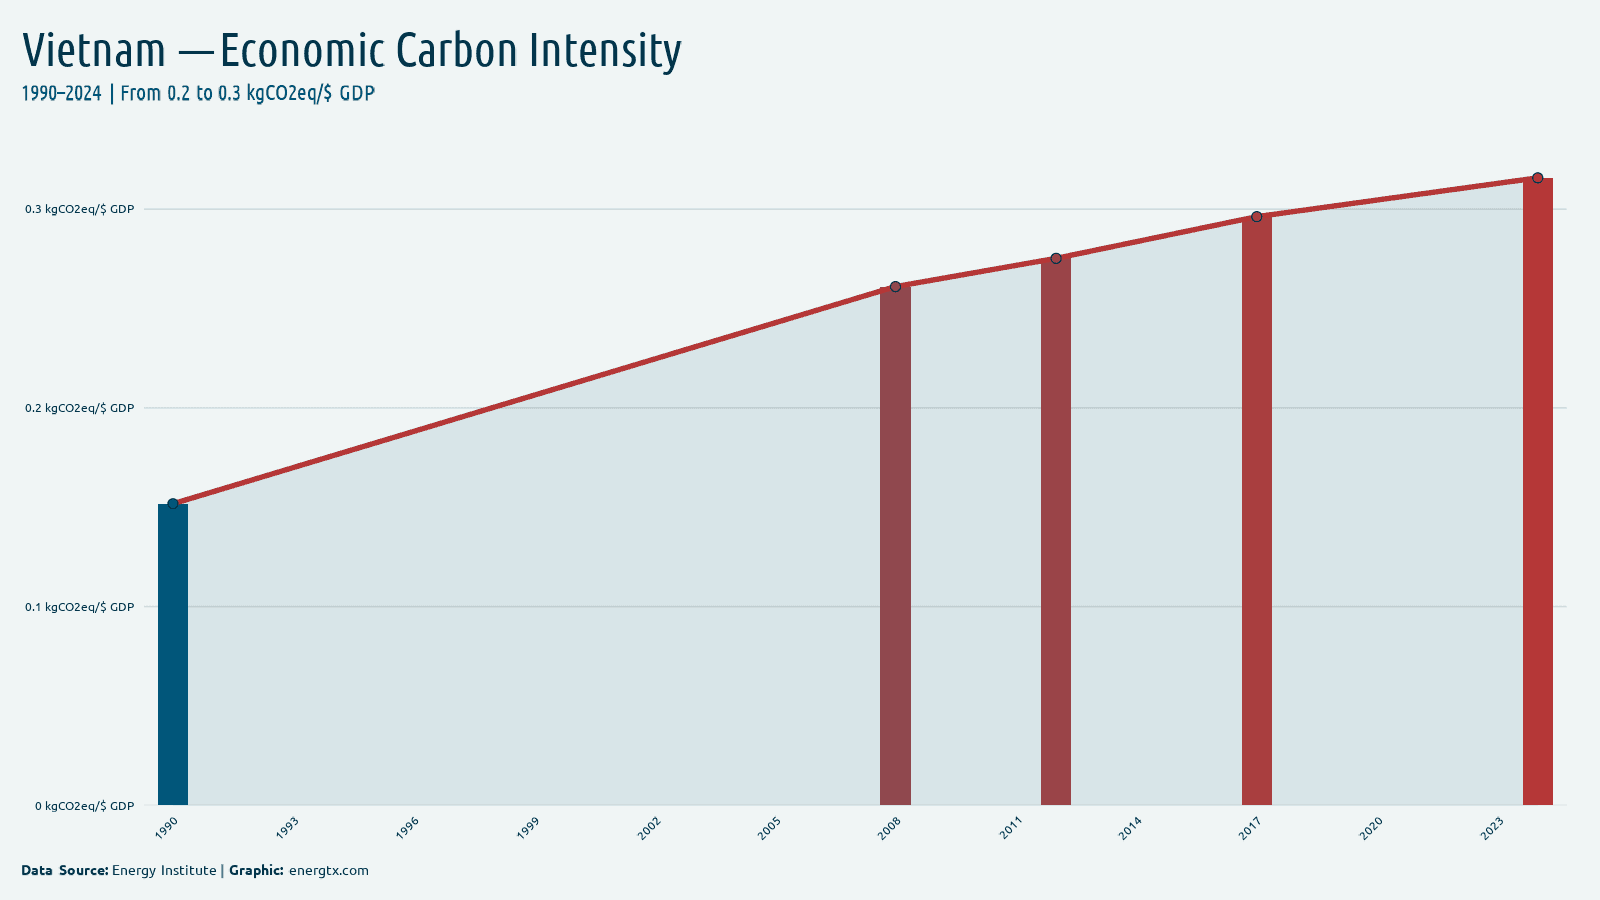
2024
Economic Carbon Intensity
0.3
kgCO2eq/$ GDP
2024
Petroleum Consumption
555.2
k barrels/day
2024
Petroleum Production
197.2
k barrels/day
2024
Crude Oil Production
162.8
k barrels/day
2024
Motor Gasoline
174.8
k barrels/day
2024
Jet Fuel
58.7
k barrels/day
2024
Distillate Fuel
213.4
k barrels/day
2024
LPG
74.4
k barrels/day
2024
Gas Production (BCF)
225.0
billion cubic feet
2024
Gas Consumption (BCF)
239.1
billion cubic feet
2024
Gas Imports
14.1
billion cubic feet
2024
Gas Exports
0.0
billion cubic feet
2024
Coal Production (TST)
49.2k
thousand short tons
2024
Coal Consumption (TST)
103.5k
thousand short tons
2024
Coal Imports
54.9k
thousand short tons
2024
Coal Exports
771.3
thousand short tons
2023
Coal Reserves
3.4k
million short tons
2024
Elec. Generation (EIA)
316.5
billion kWh
2024
Elec. Consumption (EIA)
300.9
billion kWh
2024
Elec. Capacity
88.7
GW
2024
Elec. Imports
4.3
billion kWh
2024
Elec. Exports
0.7
billion kWh
2024
Elec. Losses
19.2
billion kWh
2024
Nuclear Capacity
0.0
GW
2024
Nuclear Generation (EIA)
0.0
billion kWh
2024
Fossil Capacity
39.7
GW
2024
Fossil Generation
171.1
billion kWh
2024
Renewable Capacity
49.0
GW
2024
Renewable Generation (EIA)
145.4
billion kWh
2024
Hydro Capacity
23.7
GW
2024
Hydro Generation
96.0
billion kWh
2024
Solar Capacity (EIA)
18.7
GW
2024
Solar Generation (EIA)
32.6
billion kWh
2024
Wind Capacity (EIA)
6.2
GW
2024
Wind Generation (EIA)
13.5
billion kWh
2024
Geothermal Capacity
0.0
GW
2024
Geothermal Generation
0.0
billion kWh
2024
Biomass Capacity
0.5
GW
2024
Biomass Generation
3.3
billion kWh
2023
Primary Energy Production
61.4
Mtoe
2023
Primary Energy Consumption (EIA)
101.8
Mtoe
2023
CO2 from Coal
218.5
million metric tonnes CO2
2023
CO2 from Petroleum
72.4
million metric tonnes CO2
2023
Energy Per Capita (Btu)
40.3
million Btu/person
2023
Energy Intensity (Btu/USD)
3.4
thousand Btu/USD PPP
2022
Elec. from Oil
0.1%
%
2022
Elec. from Fossil
50.9%
%
2021
Elec. Renew. (excl. Hydro)
10.2%
%
2021
Renew. excl. Hydro (kWh)
25778100.0k
kWh/capita
2022
T&D Losses
6.2%
%
2022
Net Energy Imports
34.0%
%
2022
Fossil Fuel Share
0.0%
%
2022
Renewables & Waste
9.2%
%
2022
Alt. & Nuclear Energy
11.3%
%
2021
Energy Intensity (MJ/GDP)
3.9
MJ/$ GDP
2021
Elec. from Nuclear
0.0%
%
2021
Final Energy (PJ)
2.8k
PJ
2022
Renew. Capacity/Capita
462.0
watts/capita
2022
Crude oil production — JODI (thousand barrels/day)
180.3
k barrels/day
2010
Refinery crude intake — JODI (thousand barrels/day)
118.5
k barrels/day
2010
Crude oil exports — JODI (thousand barrels/day)
203.8
k barrels/day
2005
Crude oil imports — JODI (thousand barrels/day)
0.0
k barrels/day
2010
Refinery output — JODI (thousand barrels/day)
136.2
k barrels/day
2010
Oil products exports — JODI (thousand barrels/day)
12.1
k barrels/day
2010
Diesel demand — JODI (thousand barrels/day)
130.7
k barrels/day
2010
Gasoline demand — JODI (thousand barrels/day)
90.0
k barrels/day
2010
Kerosene demand — JODI (thousand barrels/day)
24.7
k barrels/day
2010
LPG demand — JODI (thousand barrels/day)
35.1
k barrels/day
2010
Fuel oil demand — JODI (thousand barrels/day)
63.6
k barrels/day
2010
Oil products imports — JODI (thousand barrels/day)
165.7
k barrels/day
2010
Total oil products demand — JODI (thousand barrels/day)
344.0
k barrels/day
2025
Bioenergy Share
0.3%
%
2025
Coal Share
48.1%
%
2025
Gas Share
6.2%
%
2025
Hydro Share
33.0%
%
2025
Other Fossil Share
0.2%
%
2025
Solar Share
7.4%
%
2025
Wind Share
4.6%
%
2025
Nuclear Share
0.0%
%
2025
GHG Emissions (Total)
578.0
Mt CO2e
2025
GHG Per Capita
5.9
t CO2e/person
2025
Global GHG Share
0.8%
%
2025
GHG from Power
207.8
Mt CO2e
2025
GHG from Transport
42.5
Mt CO2e
2025
GHG from Manufacturing
107.3
Mt CO2e
2025
GHG from Buildings
19.9
Mt CO2e
2025
GHG from Agriculture
89.3
Mt CO2e
2025
GHG from Fossil Ops
36.7
Mt CO2e
2025
GHG from Waste
19.1
Mt CO2e
2025
GHG from Land Use
42.2
Mt CO2e
Charts


Trends Over Time
Electricity Consumption (per capita)kWh/capita
Dataset
| Indicator | Year | Value | Unit | Source |
|---|---|---|---|---|
| Electricity Access | 2023 | 99.8% | % | World Bank |
| Electricity Access | 2022 | 100.0% | % | World Bank |
| Electricity Access | 2021 | 100.0% | % | World Bank |
| Electricity Access | 2020 | 99.8% | % | World Bank |
| Electricity Access | 2019 | 99.4% | % | World Bank |
| Electricity Access | 2018 | 100.0% | % | World Bank |
| Electricity Access | 2017 | 100.0% | % | World Bank |
| Electricity Access | 2016 | 99.2% | % | World Bank |
| Electricity Access | 2015 | 99.3% | % | World Bank |
| Electricity Access | 2014 | 99.2% | % | World Bank |
| Electricity Access | 2013 | 98.5% | % | World Bank |
| Electricity Access | 2012 | 97.9% | % | World Bank |
| Electricity Access | 2011 | 99.0% | % | World Bank |
| Electricity Access | 2010 | 97.4% | % | World Bank |
| Electricity Access | 2009 | 96.1% | % | World Bank |
| Electricity Access | 2008 | 93.8% | % | World Bank |
| Electricity Access | 2007 | 93.1% | % | World Bank |
| Electricity Access | 2006 | 96.0% | % | World Bank |
| Electricity Access | 2005 | 96.1% | % | World Bank |
| Electricity Access | 2004 | 91.0% | % | World Bank |
| Electricity Access | 2003 | 90.3% | % | World Bank |
| Electricity Access | 2002 | 89.1% | % | World Bank |
| Electricity Access | 2001 | 88.9% | % | World Bank |
| Electricity Access | 2000 | 88.2% | % | World Bank |
| Electricity Access | 1999 | 87.0% | % | World Bank |
| Electricity Access | 1998 | 86.2% | % | World Bank |
| Electricity Access | 1997 | 78.4% | % | World Bank |
| Alt. & Nuclear Energy | 2022 | 11.3% | % | World Bank |
| Alt. & Nuclear Energy | 2021 | 9.9% | % | World Bank |
| Alt. & Nuclear Energy | 2020 | 7.4% | % | World Bank |
| Alt. & Nuclear Energy | 2019 | 6.4% | % | World Bank |
| Alt. & Nuclear Energy | 2018 | 8.4% | % | World Bank |
| Alt. & Nuclear Energy | 2017 | 10.3% | % | World Bank |
| Alt. & Nuclear Energy | 2016 | 7.9% | % | World Bank |
| Alt. & Nuclear Energy | 2015 | 7.7% | % | World Bank |
| Alt. & Nuclear Energy | 2014 | 7.5% | % | World Bank |
| Alt. & Nuclear Energy | 2013 | 7.3% | % | World Bank |
| Alt. & Nuclear Energy | 2012 | 7.7% | % | World Bank |
| Alt. & Nuclear Energy | 2011 | 6.0% | % | World Bank |
| Alt. & Nuclear Energy | 2010 | 4.0% | % | World Bank |
| Alt. & Nuclear Energy | 2009 | 4.8% | % | World Bank |
| Alt. & Nuclear Energy | 2008 | 4.6% | % | World Bank |
| Alt. & Nuclear Energy | 2007 | 4.3% | % | World Bank |
| Alt. & Nuclear Energy | 2006 | 4.2% | % | World Bank |
| Alt. & Nuclear Energy | 2005 | 3.5% | % | World Bank |
| Alt. & Nuclear Energy | 2004 | 3.9% | % | World Bank |
| Alt. & Nuclear Energy | 2003 | 4.7% | % | World Bank |
| Alt. & Nuclear Energy | 2002 | 4.7% | % | World Bank |
| Alt. & Nuclear Energy | 2001 | 5.1% | % | World Bank |
| Alt. & Nuclear Energy | 2000 | 4.3% | % | World Bank |
| Alt. & Nuclear Energy | 1999 | 4.3% | % | World Bank |
| Alt. & Nuclear Energy | 1998 | 3.6% | % | World Bank |
| Alt. & Nuclear Energy | 1997 | 4.0% | % | World Bank |
| Alt. & Nuclear Energy | 1996 | 4.5% | % | World Bank |
| Alt. & Nuclear Energy | 1995 | 4.2% | % | World Bank |
| Alt. & Nuclear Energy | 1994 | 3.9% | % | World Bank |
| Alt. & Nuclear Energy | 1993 | 3.3% | % | World Bank |
| Alt. & Nuclear Energy | 1992 | 3.3% | % | World Bank |
| Alt. & Nuclear Energy | 1991 | 3.0% | % | World Bank |
| Alt. & Nuclear Energy | 1990 | 2.6% | % | World Bank |
| Biomass Capacity | 2024 | 0.5 | GW | EIA |
| Biomass Capacity | 2023 | 0.4 | GW | EIA |
| Biomass Capacity | 2022 | 0.4 | GW | EIA |
| Biomass Capacity | 2021 | 0.4 | GW | EIA |
| Biomass Capacity | 2020 | 0.4 | GW | EIA |
| Biomass Capacity | 2019 | 0.4 | GW | EIA |
| Biomass Capacity | 2018 | 0.4 | GW | EIA |
| Biomass Capacity | 2017 | 0.2 | GW | EIA |
| Biomass Capacity | 2016 | 0.2 | GW | EIA |
| Biomass Capacity | 2015 | 0.2 | GW | EIA |
| Biomass Capacity | 2014 | 0.1 | GW | EIA |
| Biomass Capacity | 2013 | 0.1 | GW | EIA |
| Biomass Capacity | 2012 | 0.1 | GW | EIA |
| Biomass Capacity | 2011 | 0.1 | GW | EIA |
| Biomass Capacity | 2010 | 0.1 | GW | EIA |
| Biomass Capacity | 2009 | 0.1 | GW | EIA |
| Biomass Capacity | 2008 | 0.1 | GW | EIA |
| Biomass Capacity | 2007 | 0.1 | GW | EIA |
| Biomass Capacity | 2006 | 0.1 | GW | EIA |
| Biomass Capacity | 2005 | 0.1 | GW | EIA |
| Biomass Capacity | 2004 | 0.1 | GW | EIA |
| Biomass Capacity | 2003 | 0.1 | GW | EIA |
| Biomass Capacity | 2002 | 0.1 | GW | EIA |
| Biomass Capacity | 2001 | 0.1 | GW | EIA |
| Biomass Capacity | 2000 | 0.1 | GW | EIA |
| Biomass Generation | 2024 | 3.3 | billion kWh | EIA |
| Biomass Generation | 2023 | 3.2 | billion kWh | EIA |
| Biomass Generation | 2022 | 3.0 | billion kWh | EIA |
| Biomass Generation | 2021 | 2.1 | billion kWh | EIA |
| Biomass Generation | 2020 | 1.7 | billion kWh | EIA |
| Biomass Generation | 2019 | 1.6 | billion kWh | EIA |
| Biomass Generation | 2018 | 1.5 | billion kWh | EIA |
| Biomass Generation | 2017 | 1.5 | billion kWh | EIA |
| Biomass Generation | 2016 | 1.4 | billion kWh | EIA |
| Biomass Generation | 2015 | 0.1 | billion kWh | EIA |
| Biomass Generation | 2014 | 0.1 | billion kWh | EIA |
| Biomass Generation | 2013 | 0.1 | billion kWh | EIA |
| Biomass Generation | 2012 | 0.1 | billion kWh | EIA |
| Biomass Generation | 2011 | 0.1 | billion kWh | EIA |
| Biomass Generation | 2010 | 0.1 | billion kWh | EIA |
| Biomass Generation | 2009 | 0.1 | billion kWh | EIA |
| Biomass Generation | 2008 | 0.1 | billion kWh | EIA |
| Biomass Generation | 2007 | 0.1 | billion kWh | EIA |
| Biomass Generation | 2006 | 0.1 | billion kWh | EIA |
| Biomass Generation | 2005 | 0.1 | billion kWh | EIA |
| Biomass Generation | 2004 | 0.0 | billion kWh | EIA |
| Biomass Generation | 2003 | 0.0 | billion kWh | EIA |
| Biomass Generation | 2002 | 0.0 | billion kWh | EIA |
| Biomass Generation | 2001 | 0.0 | billion kWh | EIA |
| Biomass Generation | 2000 | 0.0 | billion kWh | EIA |
| Biomass Generation | 1999 | 0.0 | billion kWh | EIA |
| Biomass Generation | 1998 | 0.0 | billion kWh | EIA |
| Biomass Generation | 1997 | 0.0 | billion kWh | EIA |
| Biomass Generation | 1996 | 0.0 | billion kWh | EIA |
| Biomass Generation | 1995 | 0.0 | billion kWh | EIA |
| Biomass Generation | 1994 | 0.0 | billion kWh | EIA |
| Biomass Generation | 1993 | 0.0 | billion kWh | EIA |
| Biomass Generation | 1992 | 0.0 | billion kWh | EIA |
| Biomass Generation | 1991 | 0.0 | billion kWh | EIA |
| Biomass Generation | 1990 | 0.0 | billion kWh | EIA |
| Carbon Intensity (MJ) | 2024 | 86.9 | tCO2eq/MJ | Energy Institute |
| Carbon Intensity (MJ) | 2017 | 86.7 | tCO2eq/MJ | Energy Institute |
| Carbon Intensity (MJ) | 2012 | 89.7 | tCO2eq/MJ | Energy Institute |
| Carbon Intensity (MJ) | 2008 | 90.1 | tCO2eq/MJ | Energy Institute |
| Carbon Intensity (MJ) | 1990 | 89.6 | tCO2eq/MJ | Energy Institute |
| Carbon Intensity | 2024 | 14.1 | tCO2/EJ | Energy Institute |
| Carbon Intensity | 2023 | 15.4 | tCO2/EJ | Energy Institute |
| Carbon Intensity | 2022 | 17.9 | tCO2/EJ | Energy Institute |
| Carbon Intensity | 2021 | 19.9 | tCO2/EJ | Energy Institute |
| Carbon Intensity | 2020 | 18.8 | tCO2/EJ | Energy Institute |
| Carbon Intensity | 2019 | 18.0 | tCO2/EJ | Energy Institute |
| Carbon Intensity | 2018 | 18.7 | tCO2/EJ | Energy Institute |
| Carbon Intensity | 2017 | 19.4 | tCO2/EJ | Energy Institute |
| Carbon Intensity | 2016 | 18.3 | tCO2/EJ | Energy Institute |
| Carbon Intensity | 2015 | 19.2 | tCO2/EJ | Energy Institute |
| Carbon Intensity | 2014 | 21.4 | tCO2/EJ | Energy Institute |
| Carbon Intensity | 2013 | 22.6 | tCO2/EJ | Energy Institute |
| Carbon Intensity | 2012 | 22.2 | tCO2/EJ | Energy Institute |
| Carbon Intensity | 2011 | 22.4 | tCO2/EJ | Energy Institute |
| Carbon Intensity | 2010 | 21.3 | tCO2/EJ | Energy Institute |
| Carbon Intensity | 2009 | 22.1 | tCO2/EJ | Energy Institute |
| Carbon Intensity | 2008 | 18.8 | tCO2/EJ | Energy Institute |
| Carbon Intensity | 2007 | 22.7 | tCO2/EJ | Energy Institute |
| Carbon Intensity | 2006 | 23.0 | tCO2/EJ | Energy Institute |
| Carbon Intensity | 2005 | 19.5 | tCO2/EJ | Energy Institute |
| Carbon Intensity | 2004 | 19.8 | tCO2/EJ | Energy Institute |
| Carbon Intensity | 2003 | 18.6 | tCO2/EJ | Energy Institute |
| Carbon Intensity | 2002 | 18.1 | tCO2/EJ | Energy Institute |
| Carbon Intensity | 2001 | 17.3 | tCO2/EJ | Energy Institute |
| Carbon Intensity | 2000 | 17.2 | tCO2/EJ | Energy Institute |
| Carbon Intensity | 1999 | 17.2 | tCO2/EJ | Energy Institute |
| Carbon Intensity | 1998 | 16.6 | tCO2/EJ | Energy Institute |
| Carbon Intensity | 1997 | 15.3 | tCO2/EJ | Energy Institute |
| Carbon Intensity | 1996 | 16.4 | tCO2/EJ | Energy Institute |
| Carbon Intensity | 1995 | 16.8 | tCO2/EJ | Energy Institute |
| Carbon Intensity | 1994 | 18.8 | tCO2/EJ | Energy Institute |
| Carbon Intensity | 1993 | 20.4 | tCO2/EJ | Energy Institute |
| Carbon Intensity | 1992 | 21.8 | tCO2/EJ | Energy Institute |
| Carbon Intensity | 1991 | 20.9 | tCO2/EJ | Energy Institute |
| Carbon Intensity | 1990 | 14.7 | tCO2/EJ | Energy Institute |
| CO2 Emissions (per capita) | 2023 | 3.5 | metric tons/capita | Global Carbon Project |
| CO2 Emissions (per capita) | 2022 | 3.2 | metric tons/capita | Global Carbon Project |
| CO2 Emissions (per capita) | 2021 | 3.2 | metric tons/capita | Global Carbon Project |
| CO2 Emissions (per capita) | 2020 | 3.7 | metric tons/capita | Global Carbon Project |
| CO2 Emissions (per capita) | 2019 | 3.5 | metric tons/capita | Global Carbon Project |
| CO2 Emissions (per capita) | 2018 | 2.7 | metric tons/capita | Global Carbon Project |
| CO2 Emissions (per capita) | 2017 | 2.4 | metric tons/capita | Global Carbon Project |
| CO2 Emissions (per capita) | 2016 | 2.4 | metric tons/capita | Global Carbon Project |
| CO2 Emissions (per capita) | 2015 | 2.3 | metric tons/capita | Global Carbon Project |
| CO2 Emissions (per capita) | 2014 | 2.0 | metric tons/capita | Global Carbon Project |
| CO2 Emissions (per capita) | 2013 | 1.7 | metric tons/capita | Global Carbon Project |
| CO2 Emissions (per capita) | 2012 | 1.6 | metric tons/capita | Global Carbon Project |
| CO2 Emissions (per capita) | 2011 | 1.7 | metric tons/capita | Global Carbon Project |
| CO2 Emissions (per capita) | 2010 | 1.6 | metric tons/capita | Global Carbon Project |
| CO2 Emissions (per capita) | 2009 | 1.4 | metric tons/capita | Global Carbon Project |
| CO2 Emissions (per capita) | 2008 | 1.3 | metric tons/capita | Global Carbon Project |
| CO2 Emissions (per capita) | 2007 | 1.2 | metric tons/capita | Global Carbon Project |
| CO2 Emissions (per capita) | 2006 | 1.2 | metric tons/capita | Global Carbon Project |
| CO2 Emissions (per capita) | 2005 | 1.2 | metric tons/capita | Global Carbon Project |
| CO2 Emissions (per capita) | 2004 | 1.1 | metric tons/capita | Global Carbon Project |
| CO2 Emissions (per capita) | 2003 | 1.0 | metric tons/capita | Global Carbon Project |
| CO2 Emissions (per capita) | 2002 | 0.9 | metric tons/capita | Global Carbon Project |
| CO2 Emissions (per capita) | 2001 | 0.8 | metric tons/capita | Global Carbon Project |
| CO2 Emissions (per capita) | 2000 | 0.7 | metric tons/capita | Global Carbon Project |
| CO2 Emissions (per capita) | 1999 | 0.6 | metric tons/capita | Global Carbon Project |
| CO2 Emissions (per capita) | 1998 | 0.6 | metric tons/capita | Global Carbon Project |
| CO2 Emissions (per capita) | 1997 | 0.6 | metric tons/capita | Global Carbon Project |
| CO2 Emissions (per capita) | 1996 | 0.5 | metric tons/capita | Global Carbon Project |
| CO2 Emissions (per capita) | 1995 | 0.4 | metric tons/capita | Global Carbon Project |
| CO2 Emissions (per capita) | 1994 | 0.4 | metric tons/capita | Global Carbon Project |
| CO2 Emissions (per capita) | 1993 | 0.3 | metric tons/capita | Global Carbon Project |
| CO2 Emissions (per capita) | 1992 | 0.3 | metric tons/capita | Global Carbon Project |
| CO2 Emissions (per capita) | 1991 | 0.3 | metric tons/capita | Global Carbon Project |
| CO2 Emissions (per capita) | 1990 | 0.3 | metric tons/capita | Global Carbon Project |
| CO2 from Coal | 2023 | 218.5 | million metric tonnes CO2 | EIA |
| CO2 from Coal | 2022 | 200.0 | million metric tonnes CO2 | EIA |
| CO2 from Coal | 2021 | 205.8 | million metric tonnes CO2 | EIA |
| CO2 from Coal | 2020 | 210.7 | million metric tonnes CO2 | EIA |
| CO2 from Coal | 2019 | 205.1 | million metric tonnes CO2 | EIA |
| CO2 from Coal | 2018 | 159.3 | million metric tonnes CO2 | EIA |
Showing 200 of 3246 records. Download for the full dataset.
Download Vietnam Data
Found a data error?
Our data is sourced from World Bank, Energy Institute, OWID, OECD, IAEA, GCP, and Eurostat. If you notice an incorrect value, missing data, or any discrepancy for Vietnam, please let us know so we can investigate and correct it. Include the indicator name, year, and a brief description of the issue.
Report a data error