🇩🇪
Germany
3753 records · 133 indicators · 1990–2025
3,753
Data Records
133
Indicators
1990–2025
Time Range
DEU
ISO Code
Latest Indicator Values
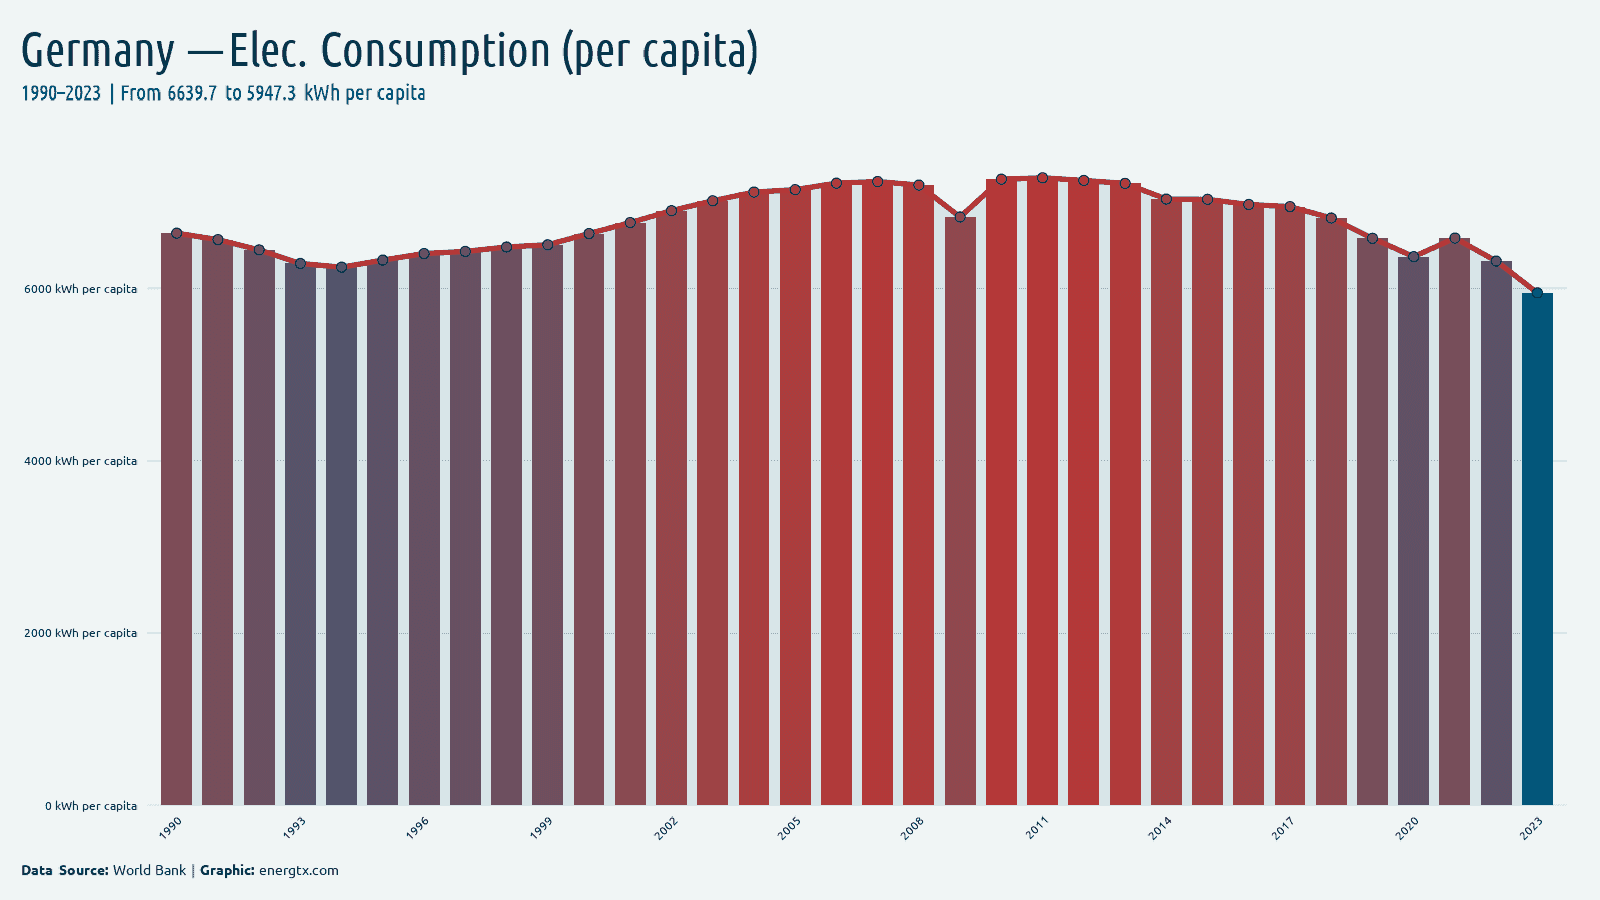
2023
Electricity Consumption (per capita)
5.9k
kWh/capita
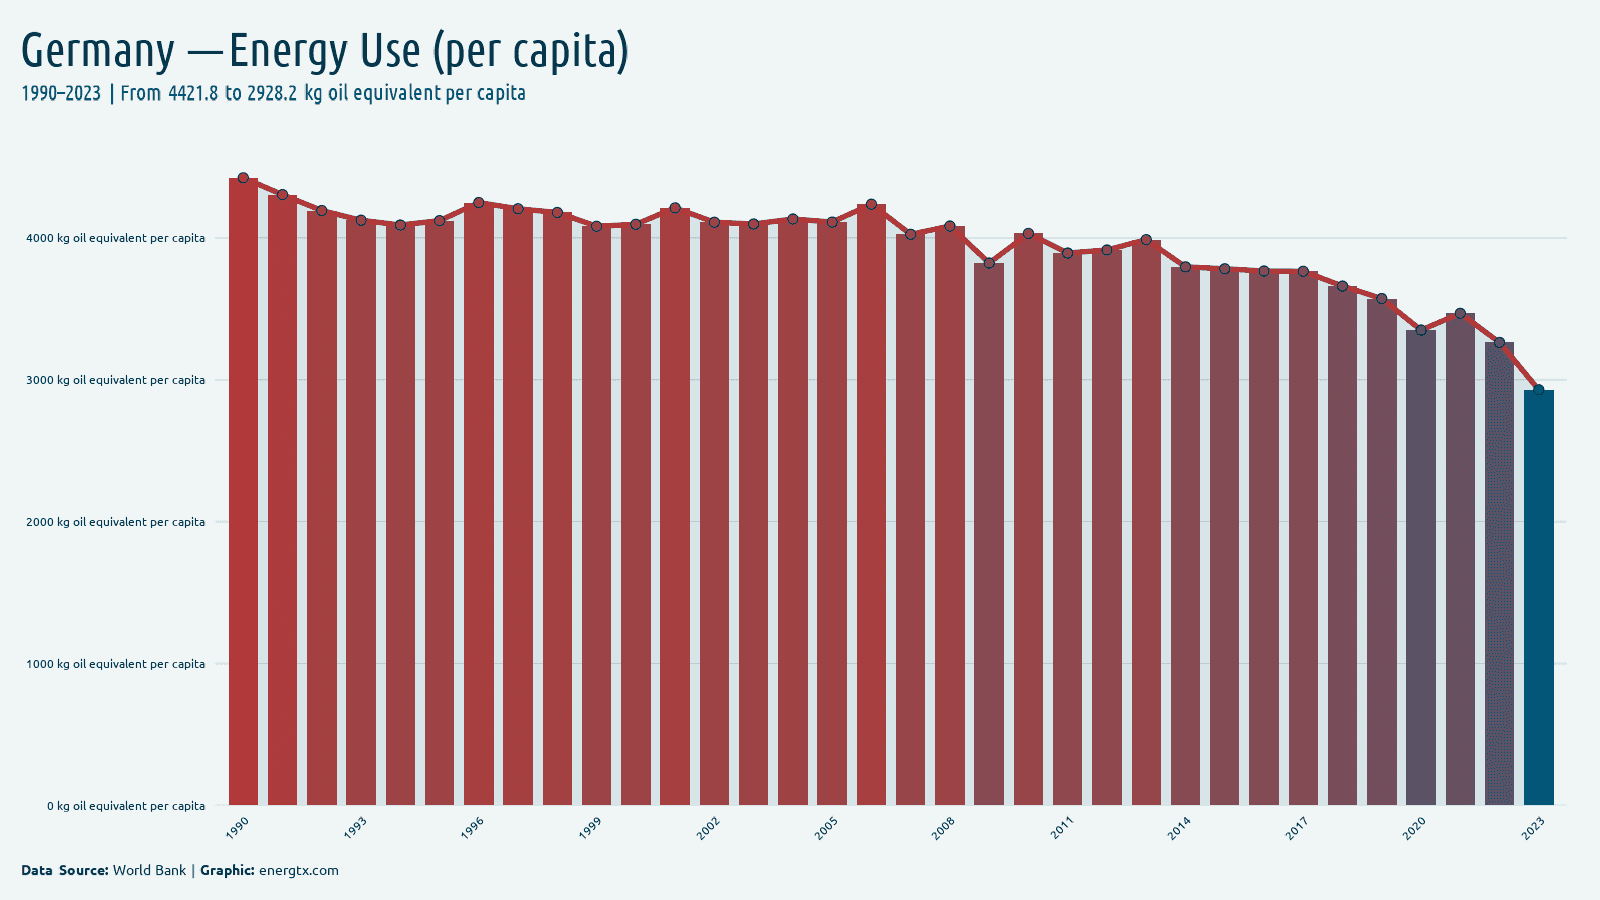
2023
Energy Use (per capita)
2.9k
kg oil eq./capita
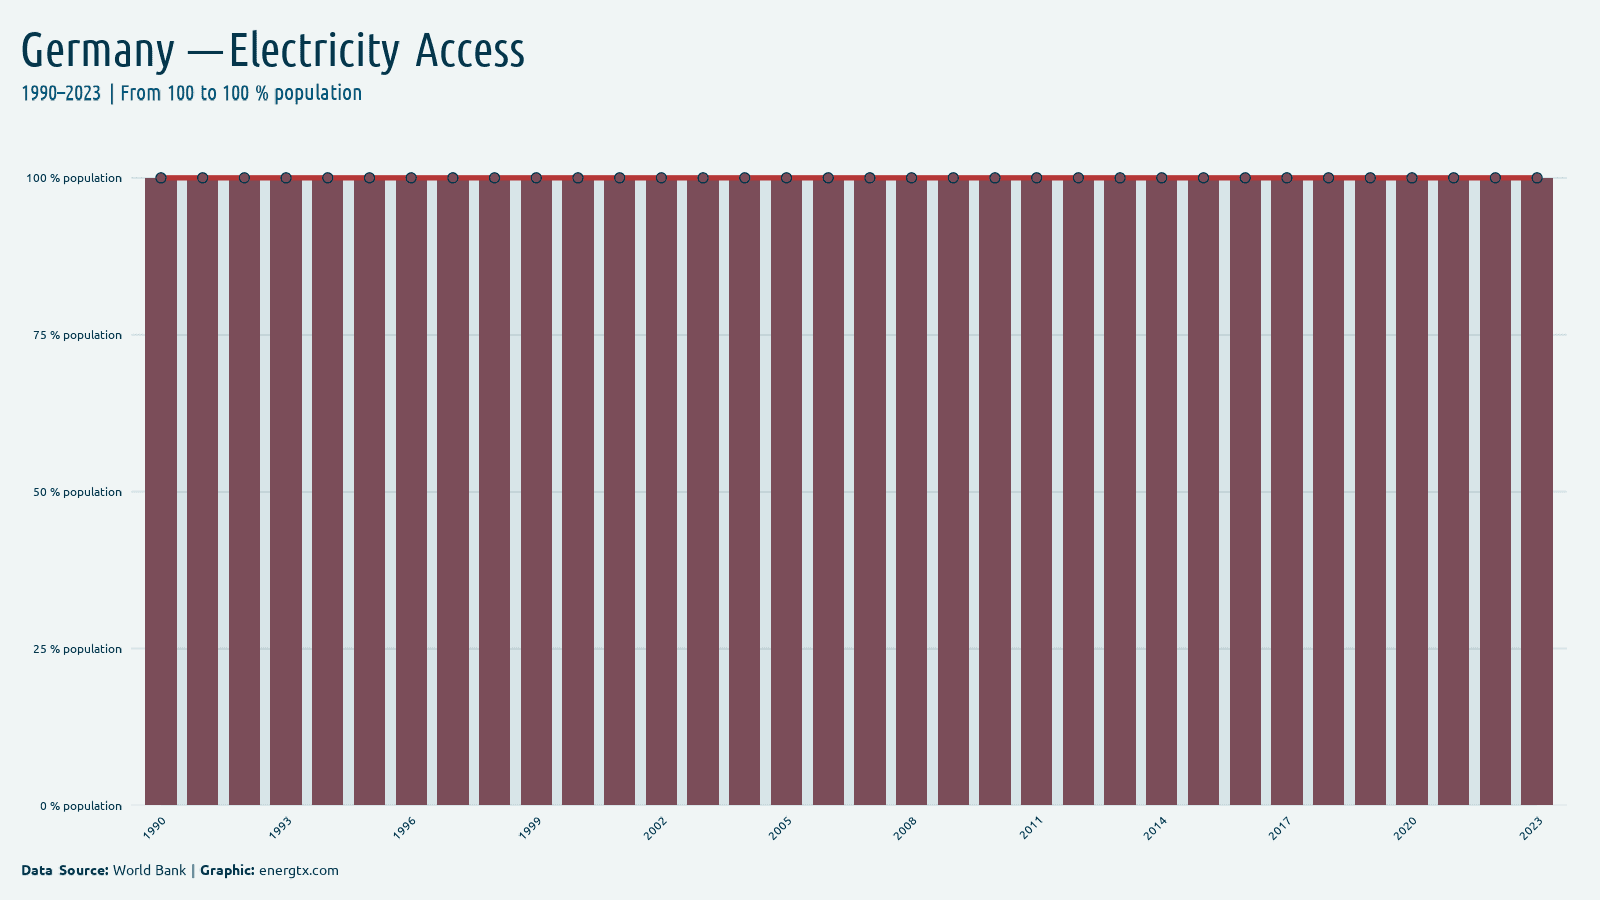
2023
Electricity Access
100.0%
%
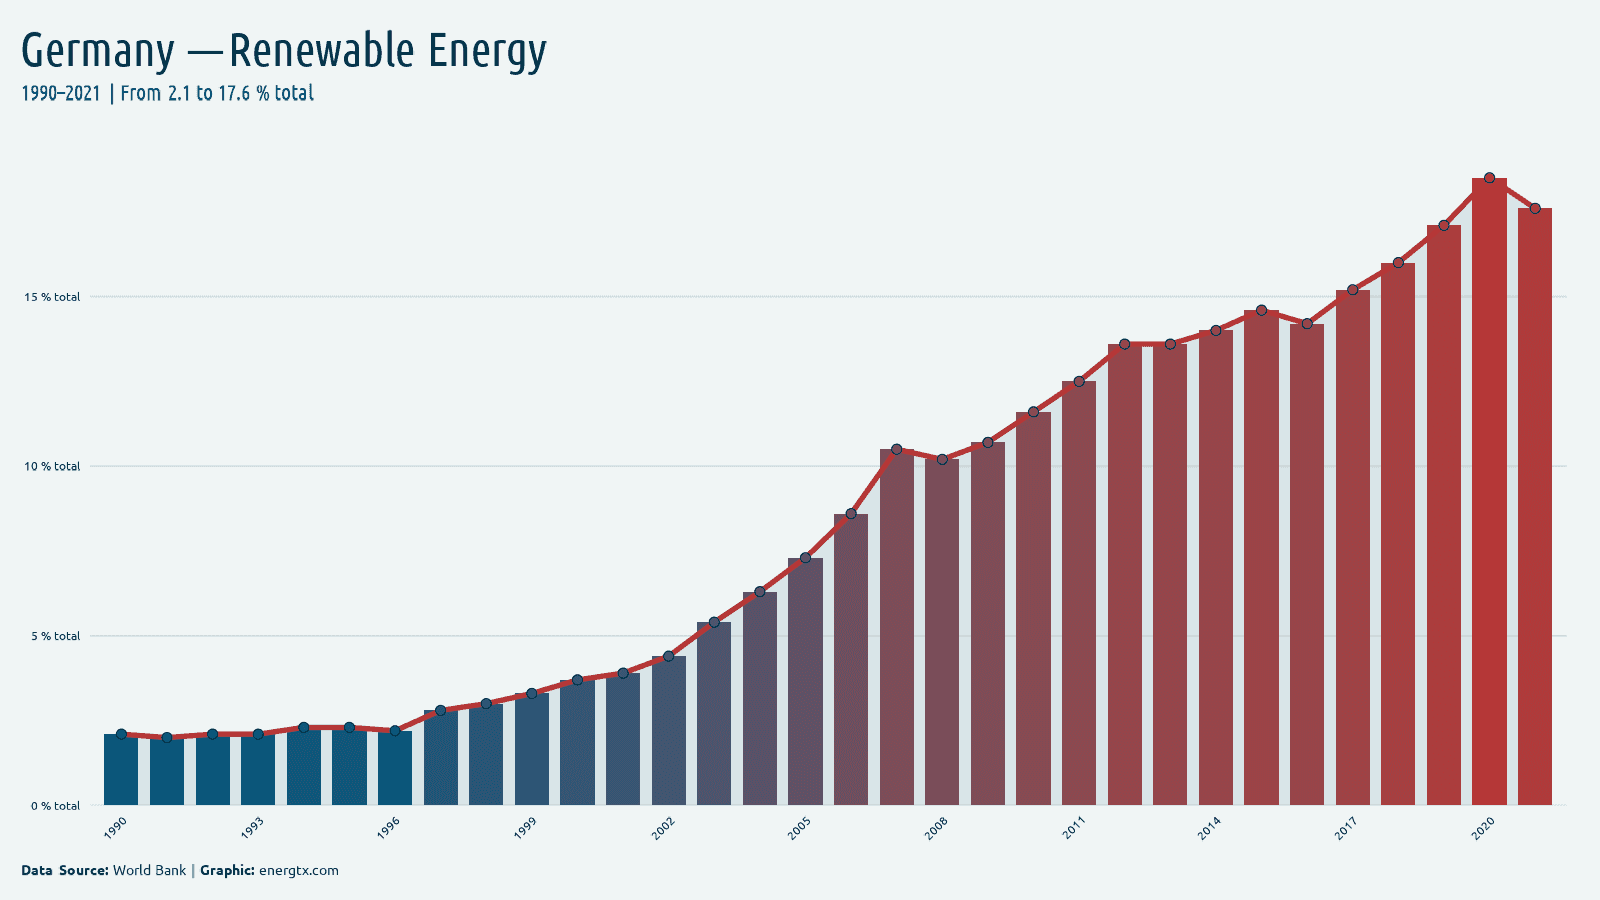
2021
Renewable Energy
17.6%
%
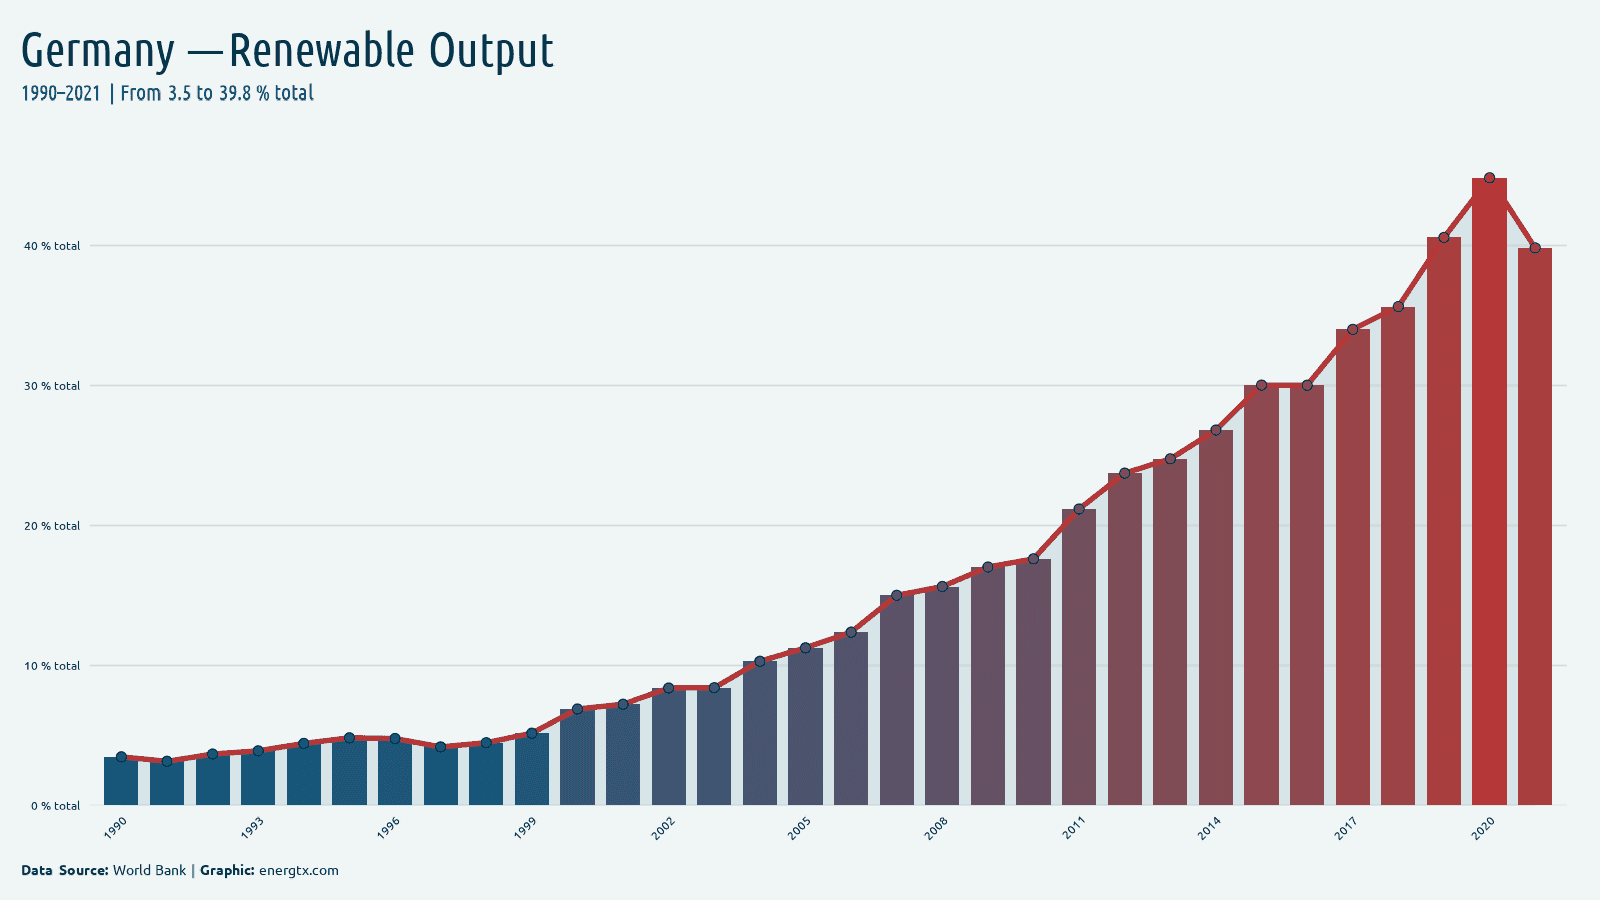
2021
Renewable Output
39.8%
%
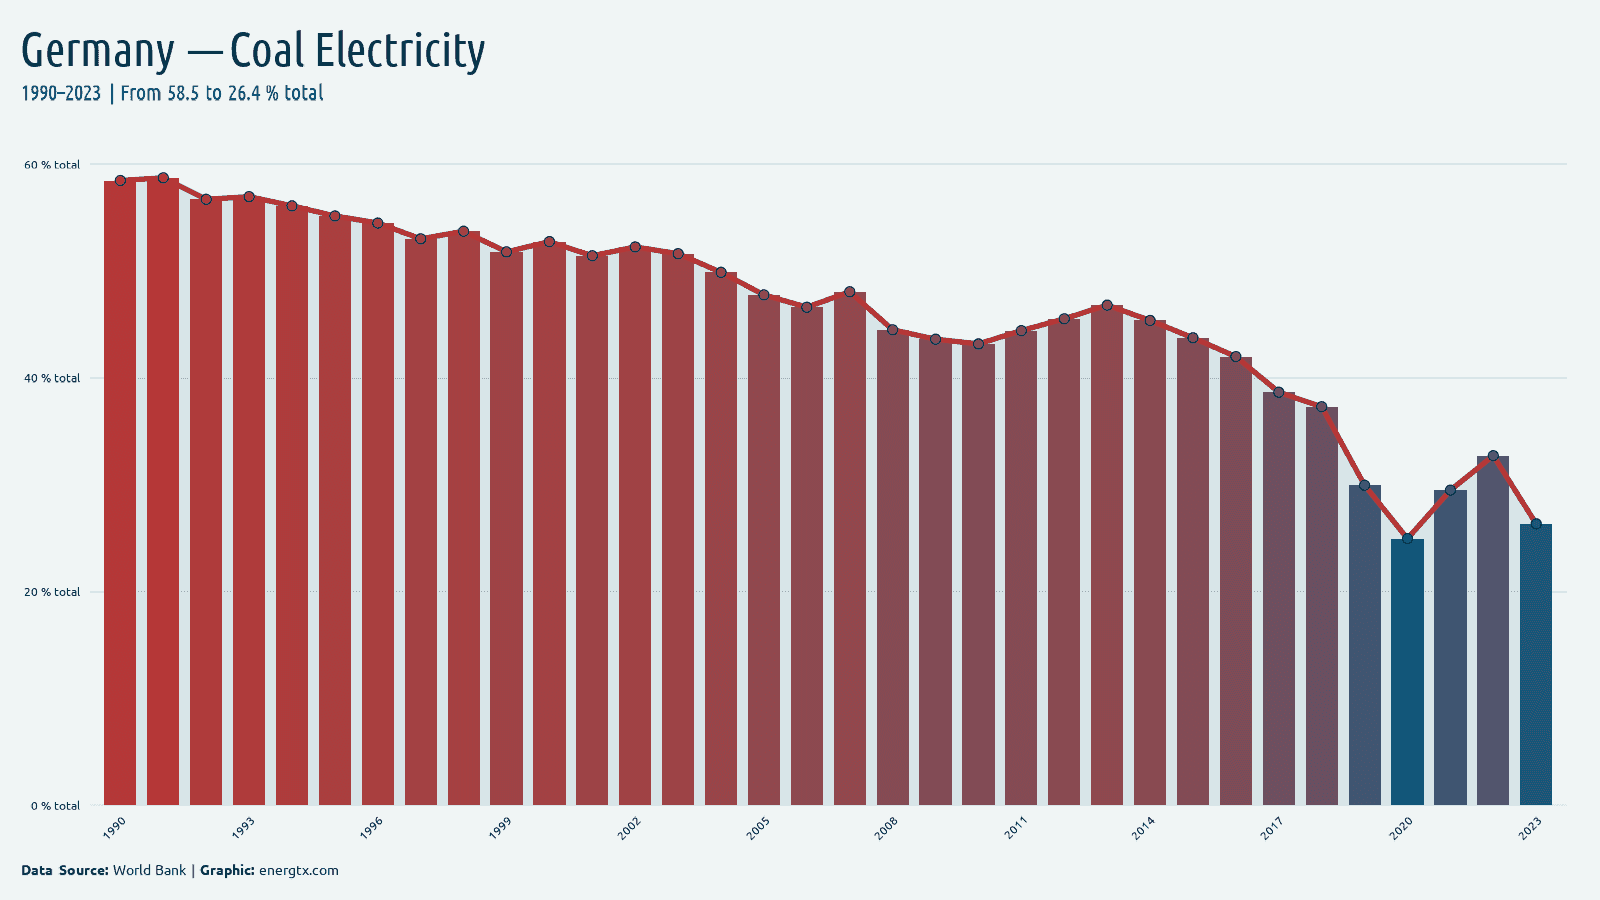
2023
Coal Electricity
26.4%
%
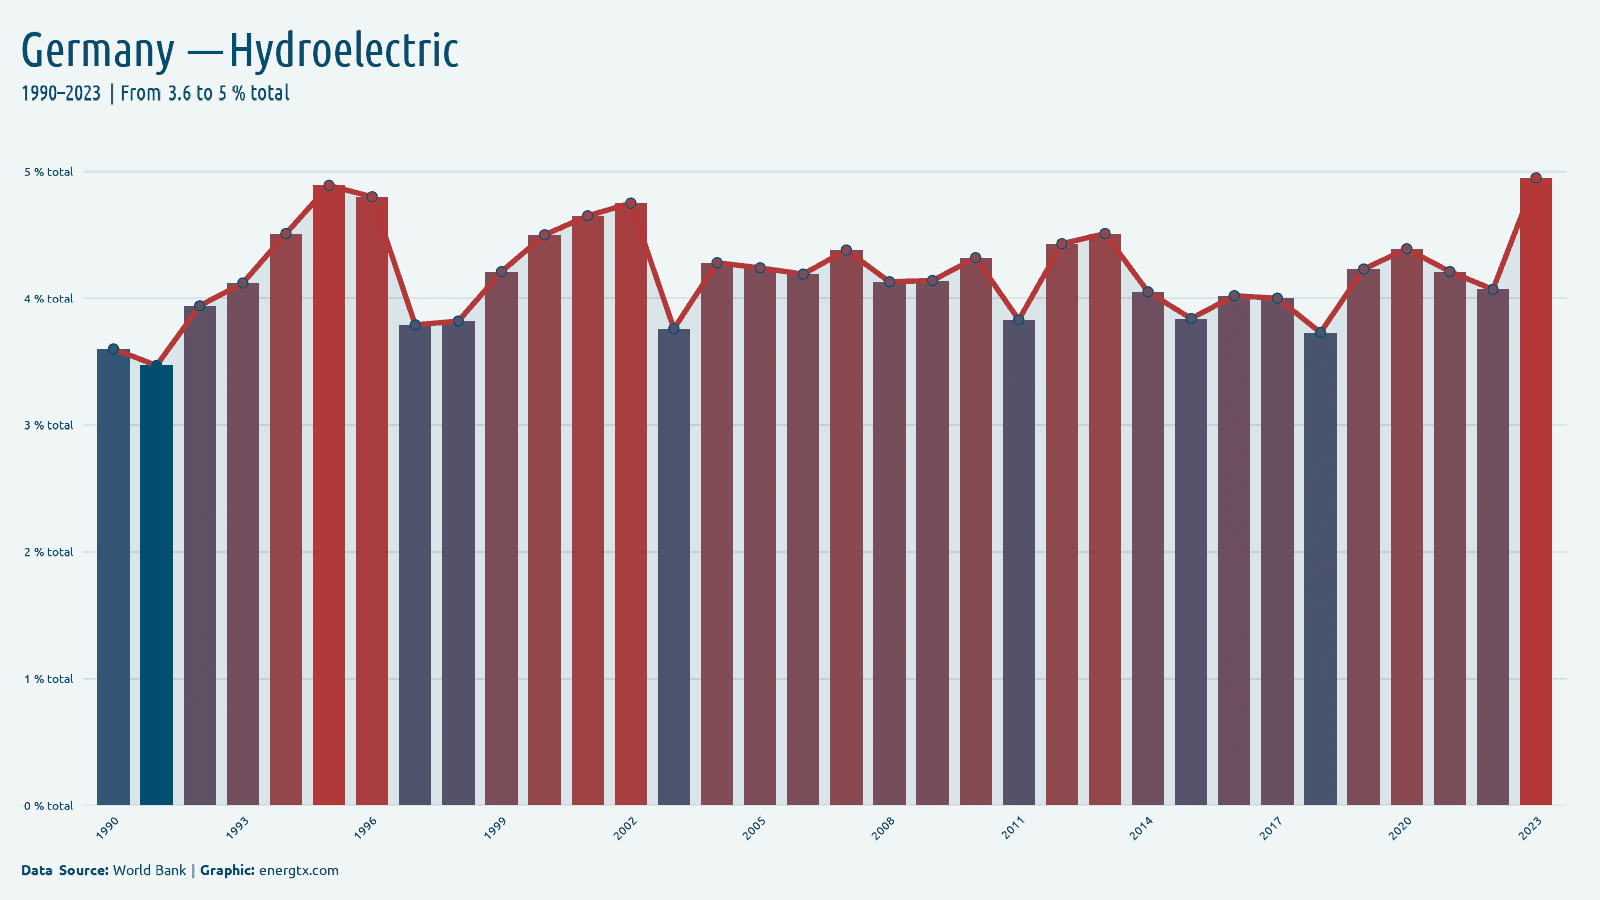
2023
Hydroelectric
5.0%
%
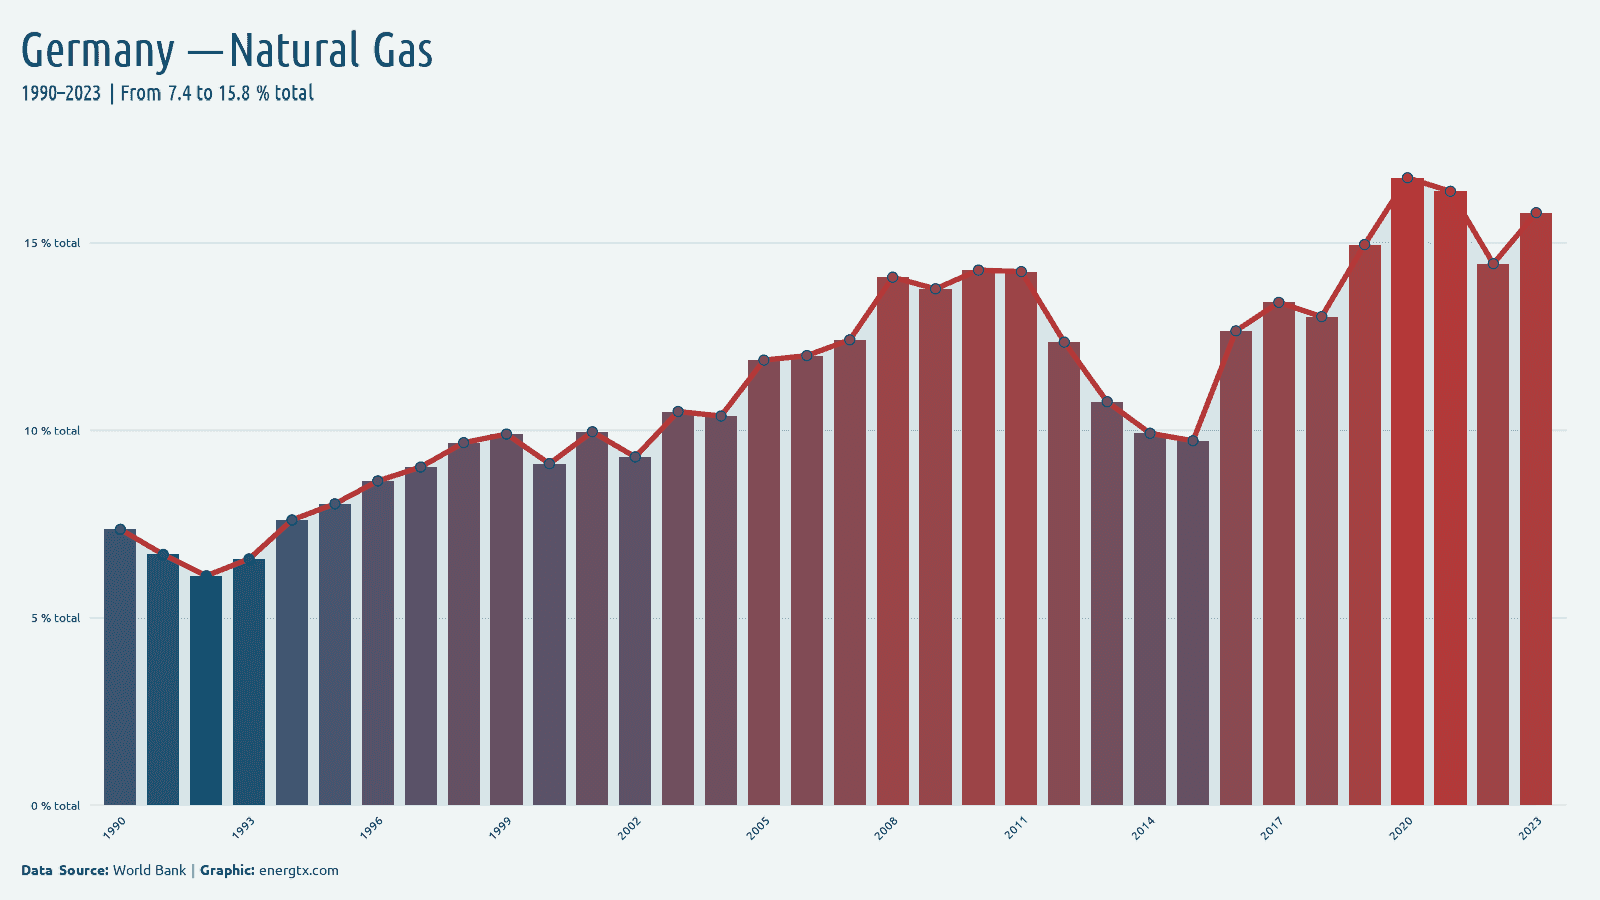
2023
Natural Gas
15.8%
%
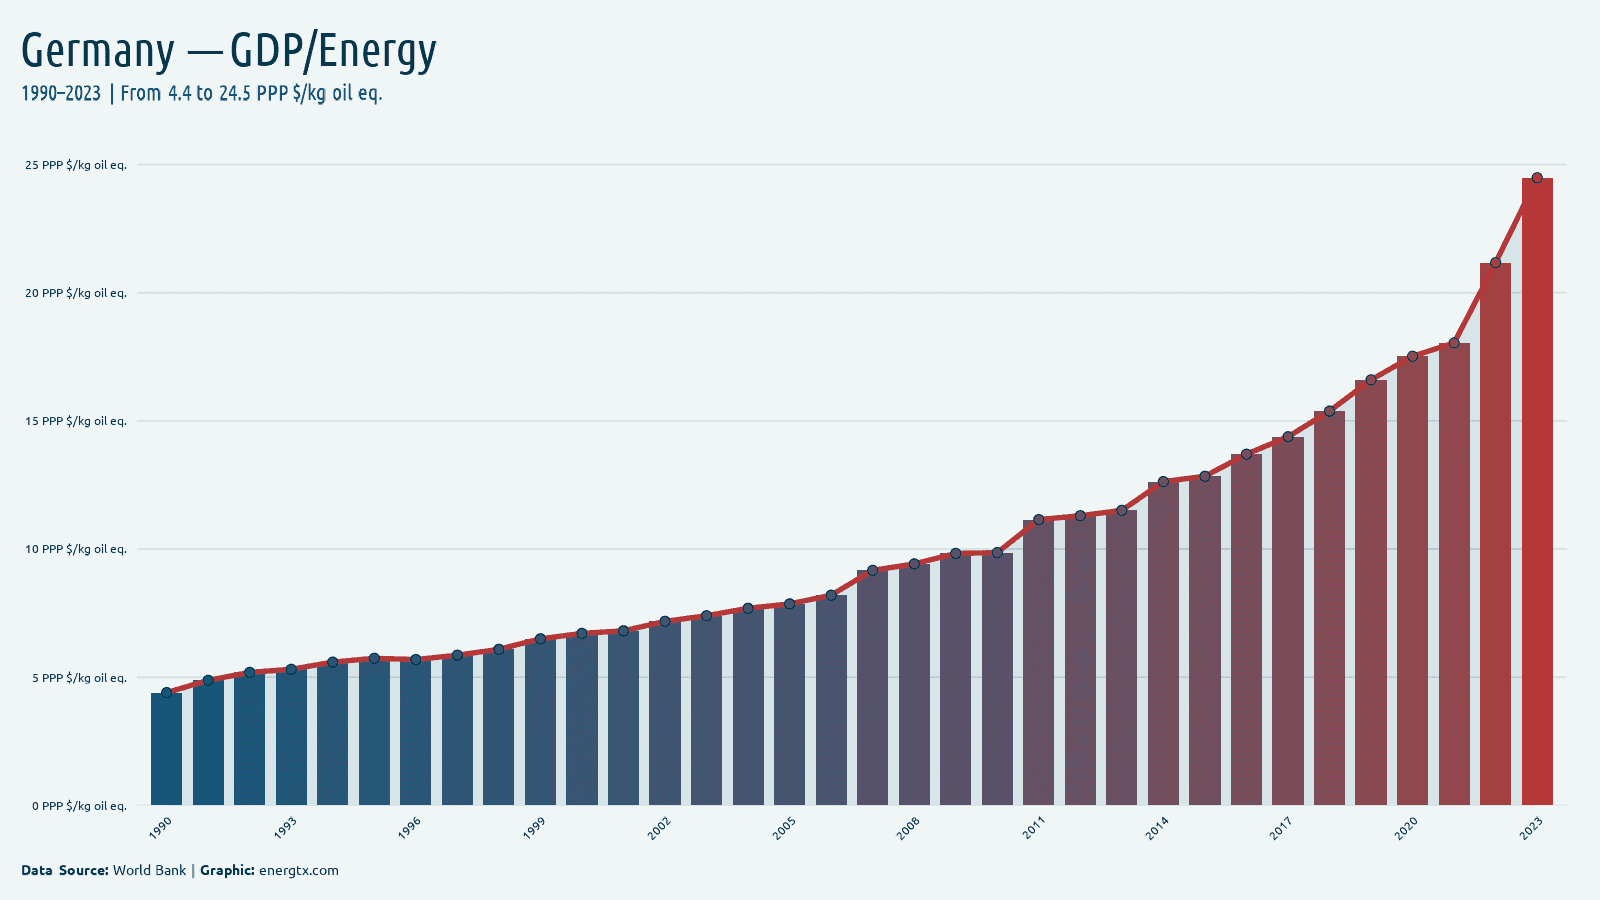
2023
GDP/Energy
24.5
PPP $/kg oil eq.
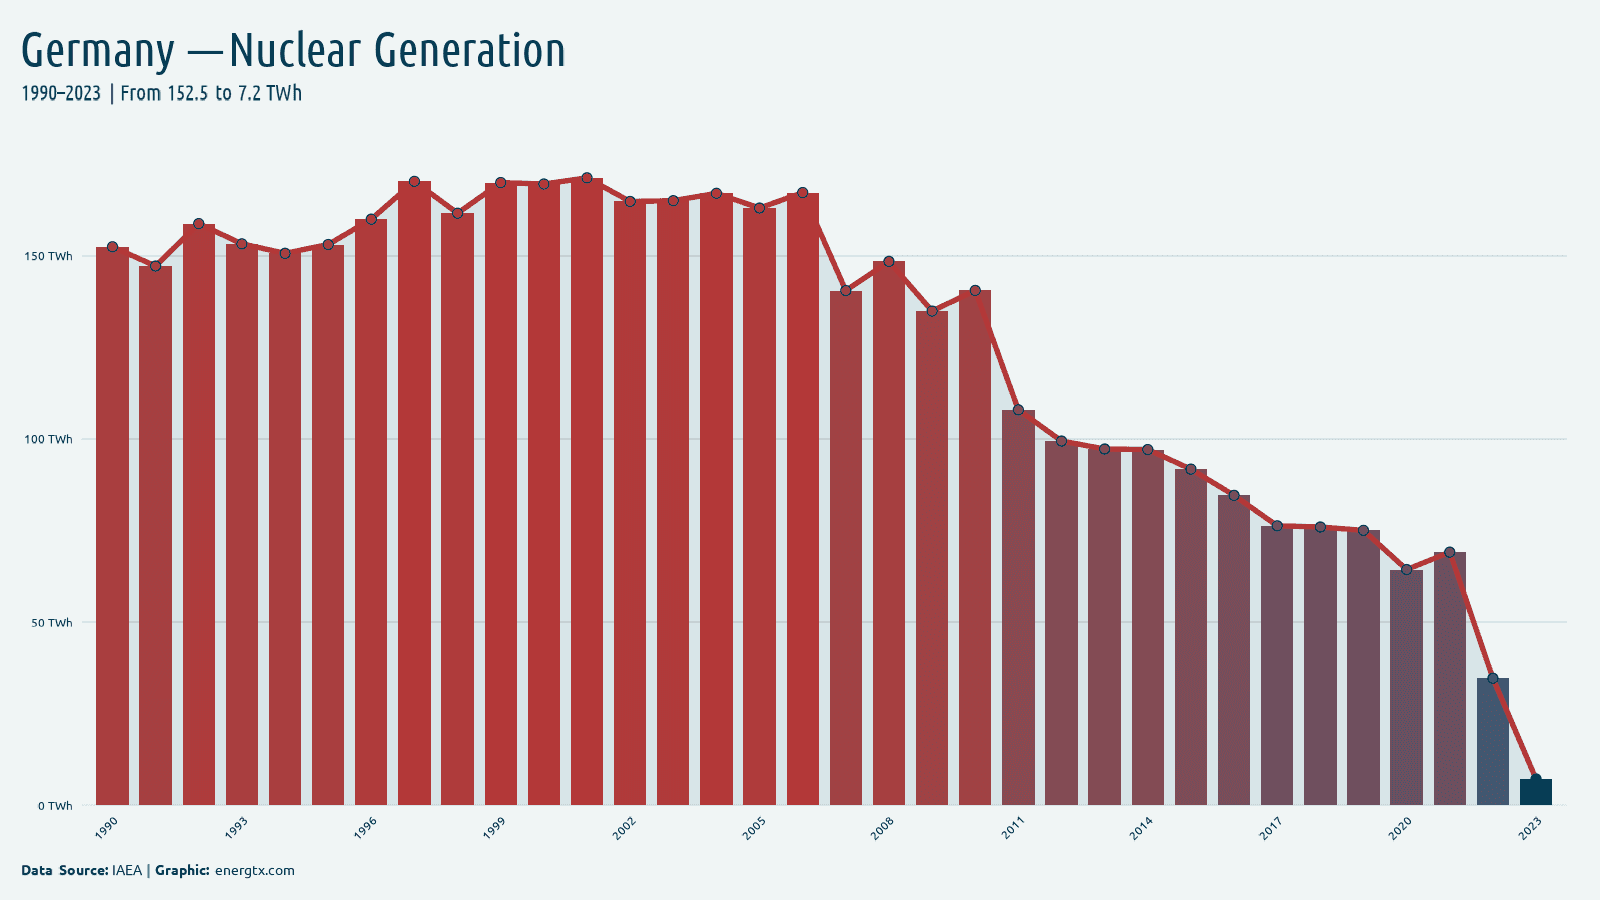
2023
Nuclear Generation
7.2
TWh
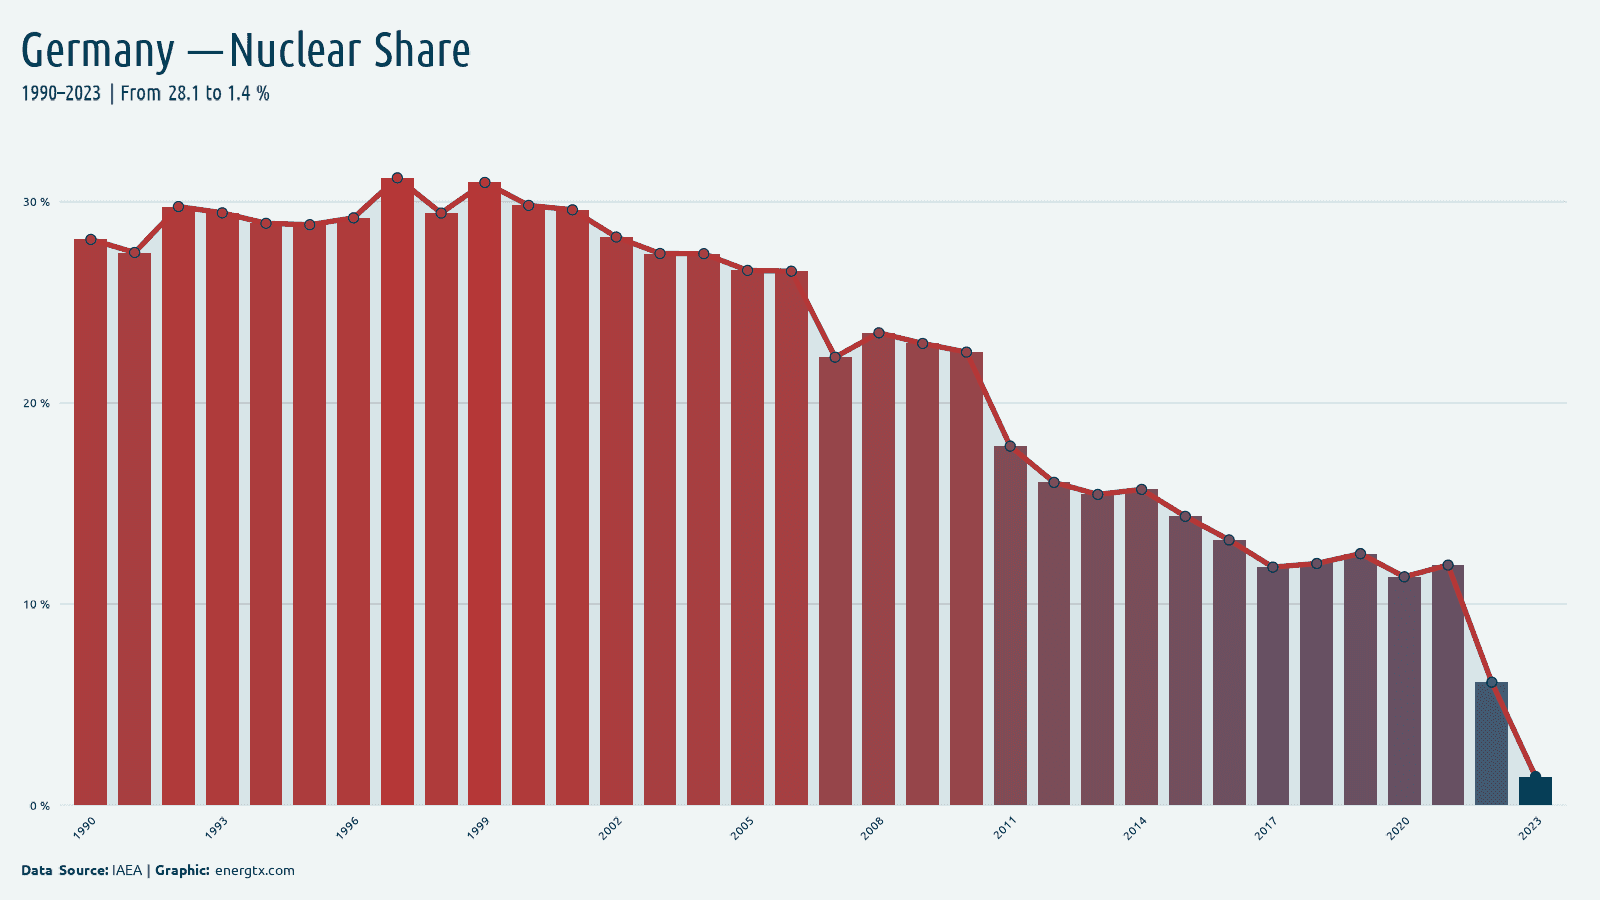
2023
Nuclear Share
1.4%
%
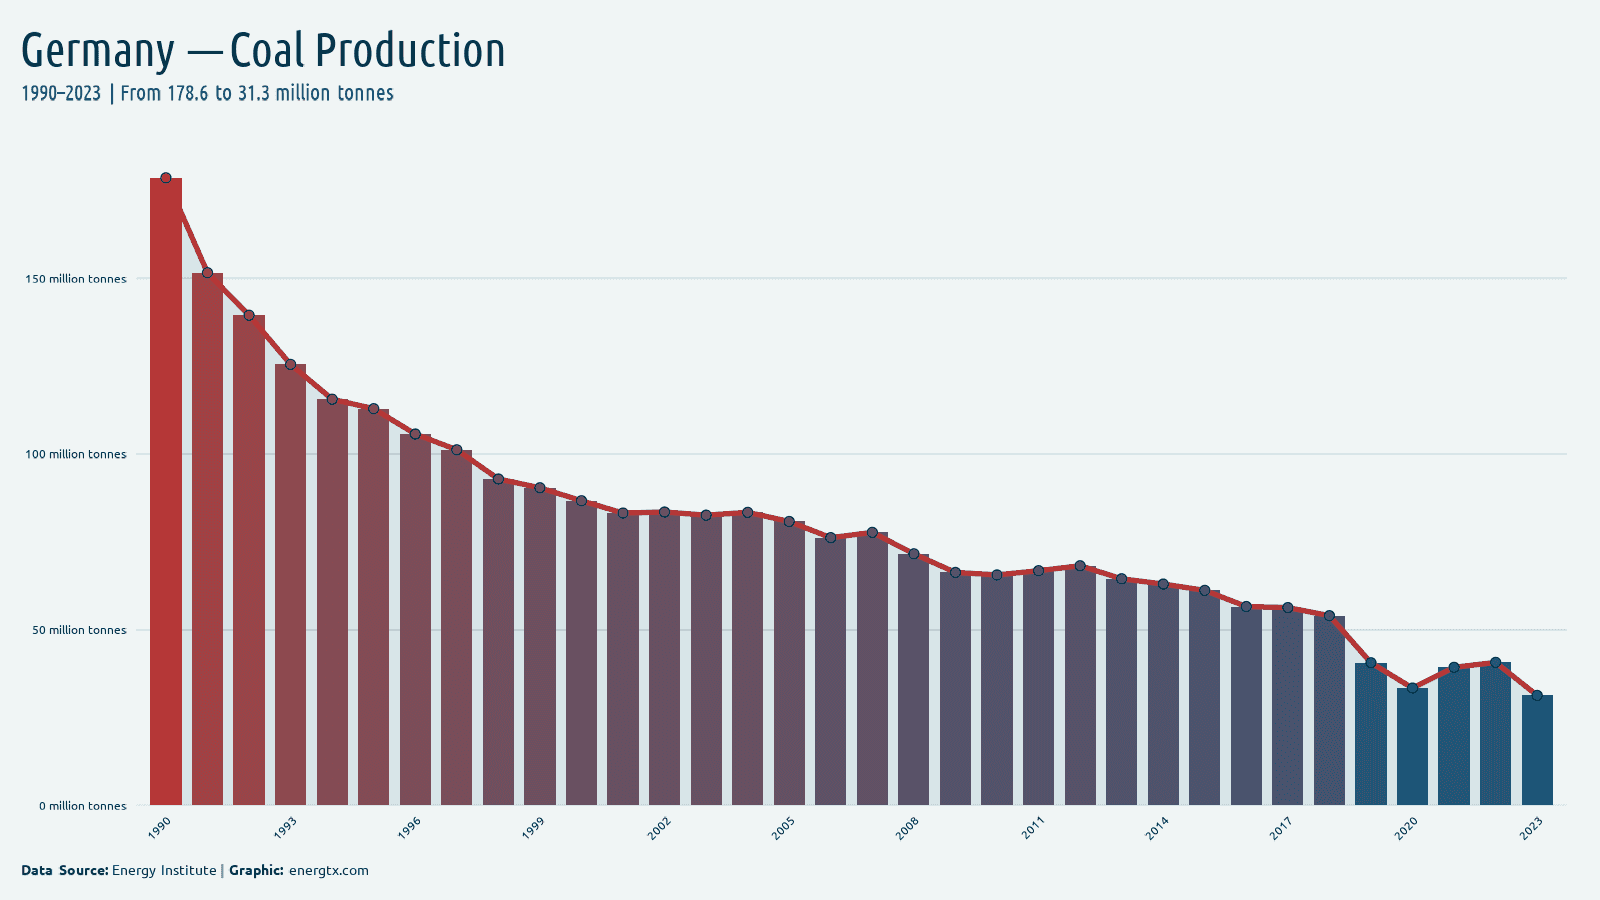
2023
Coal Production
31.3
Mt
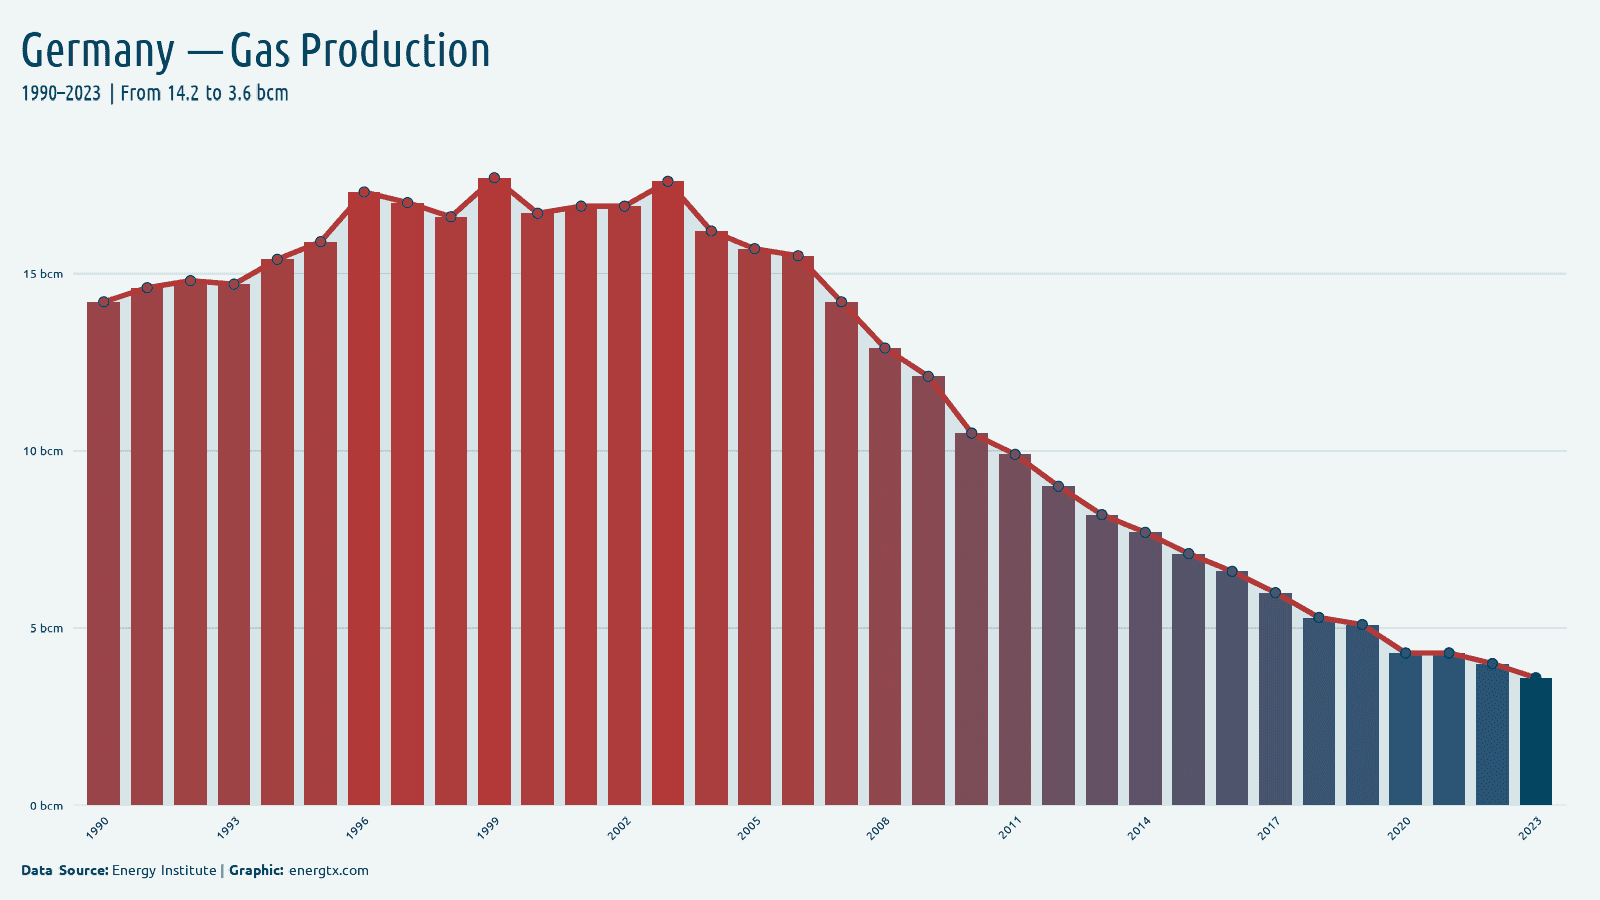
2023
Gas Production
3.6
bcm
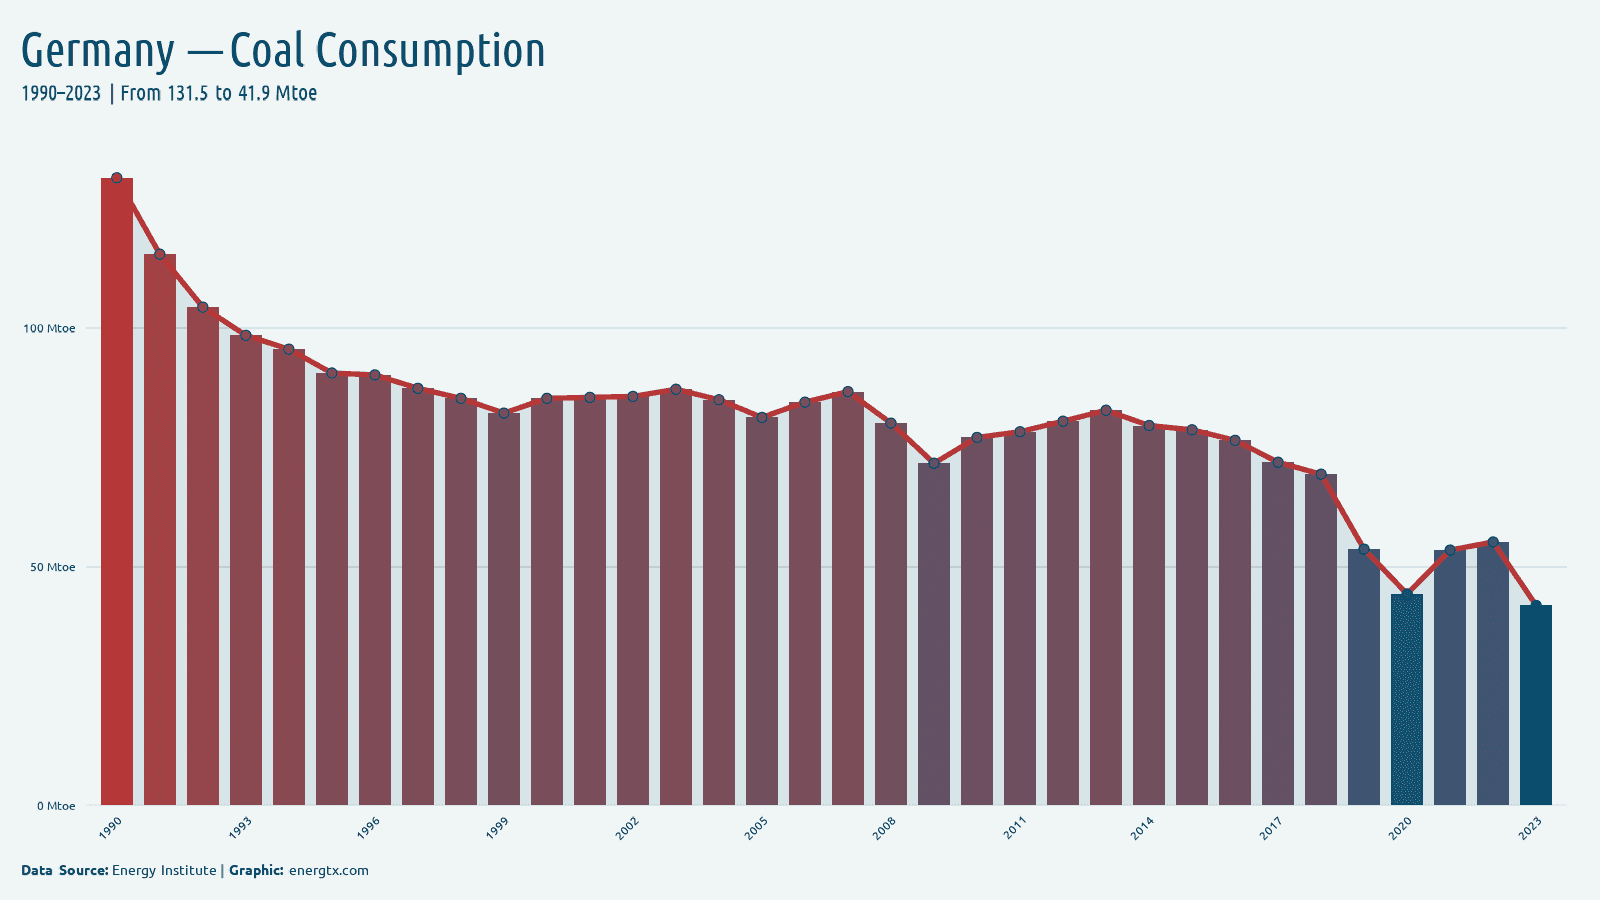
2023
Coal Consumption
41.9
Mtoe
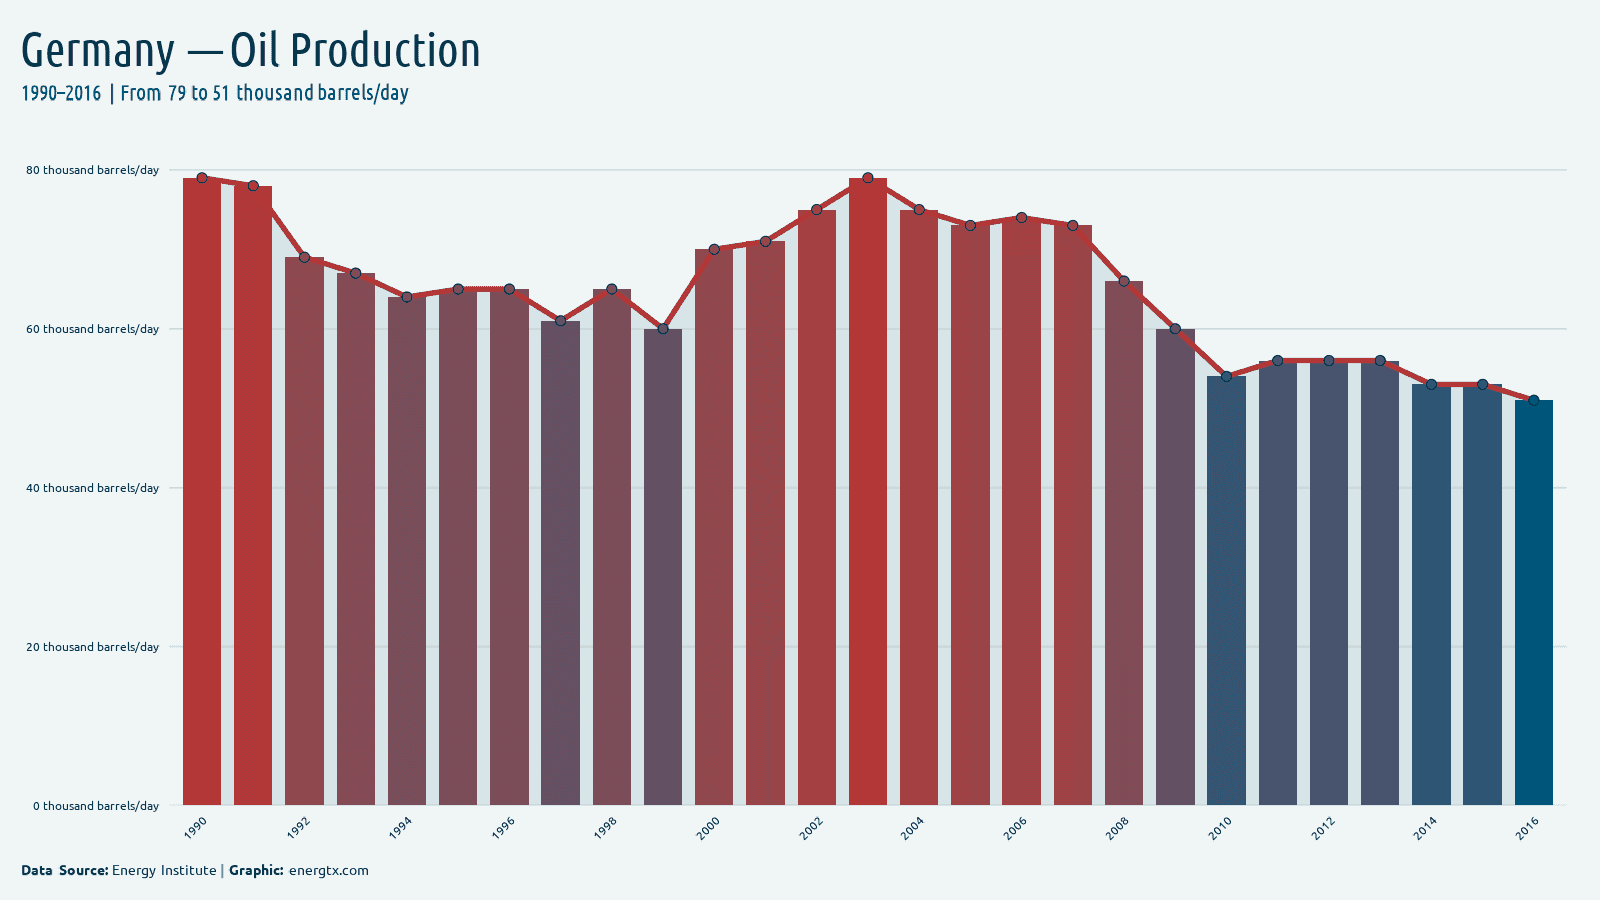
2016
Oil Production
51.0
k barrels/day
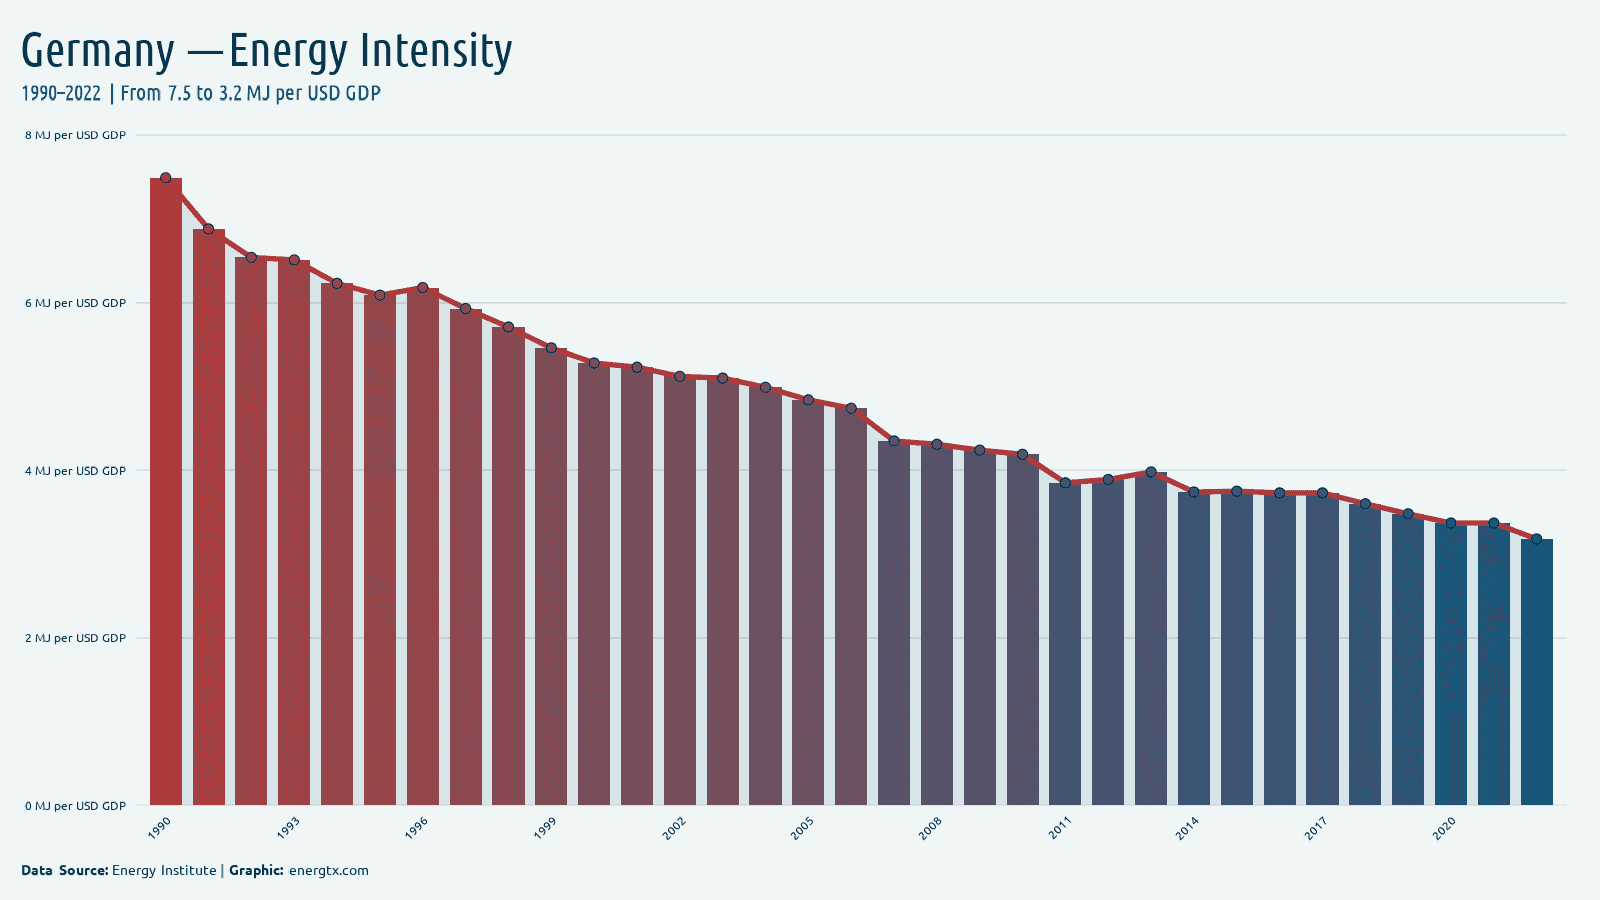
2022
Energy Intensity
3.2
MJ/$ GDP
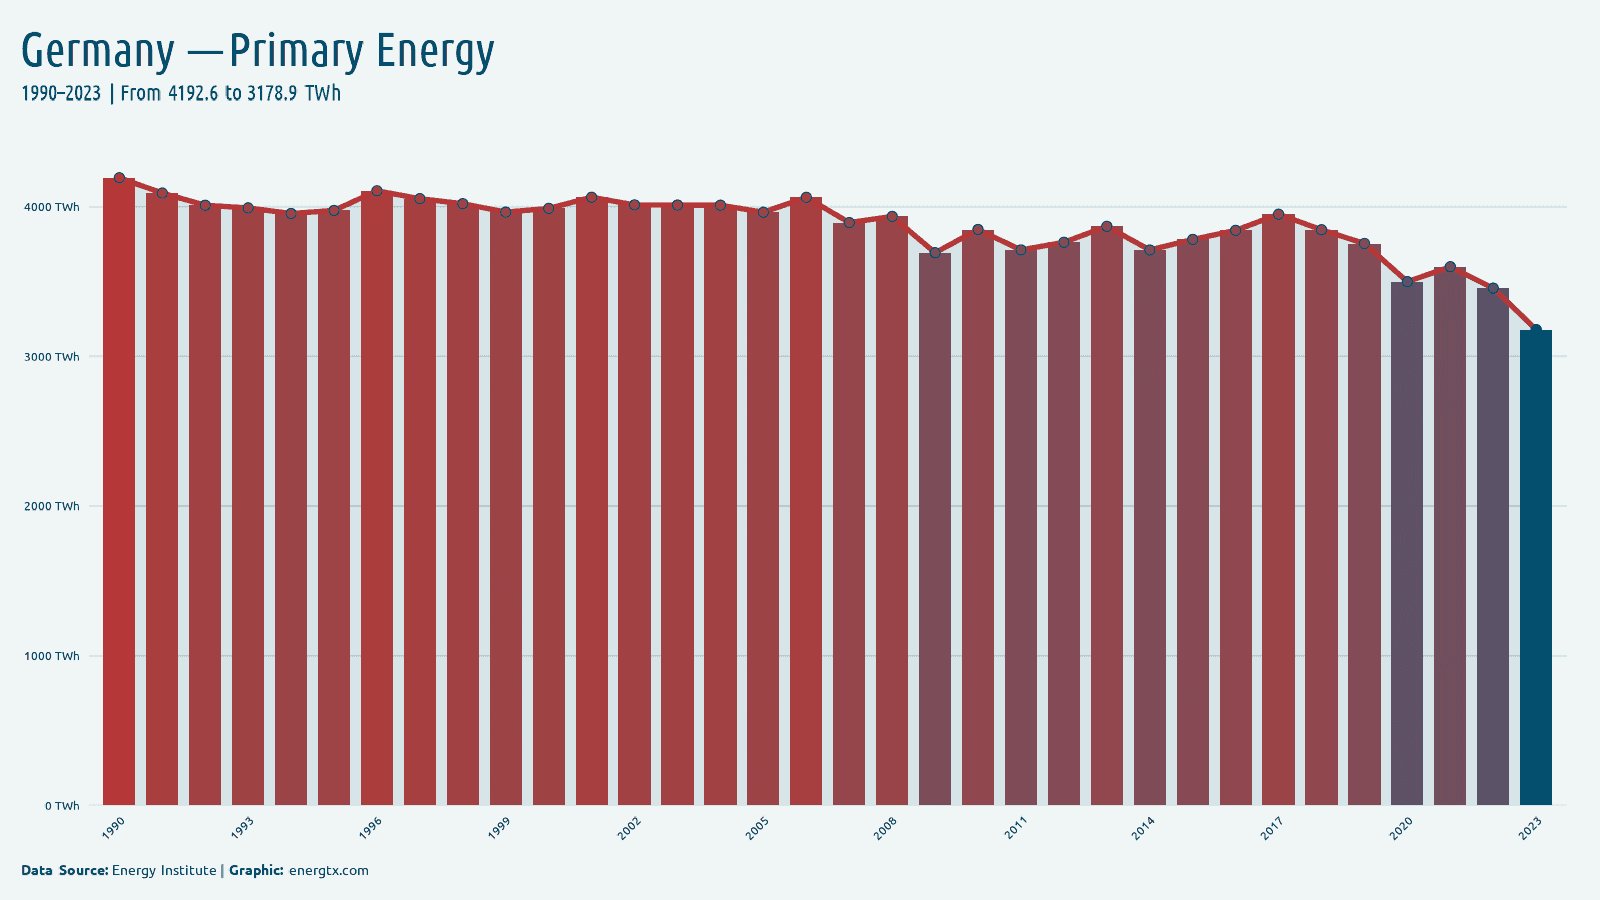
2023
Primary Energy
3.2k
TWh
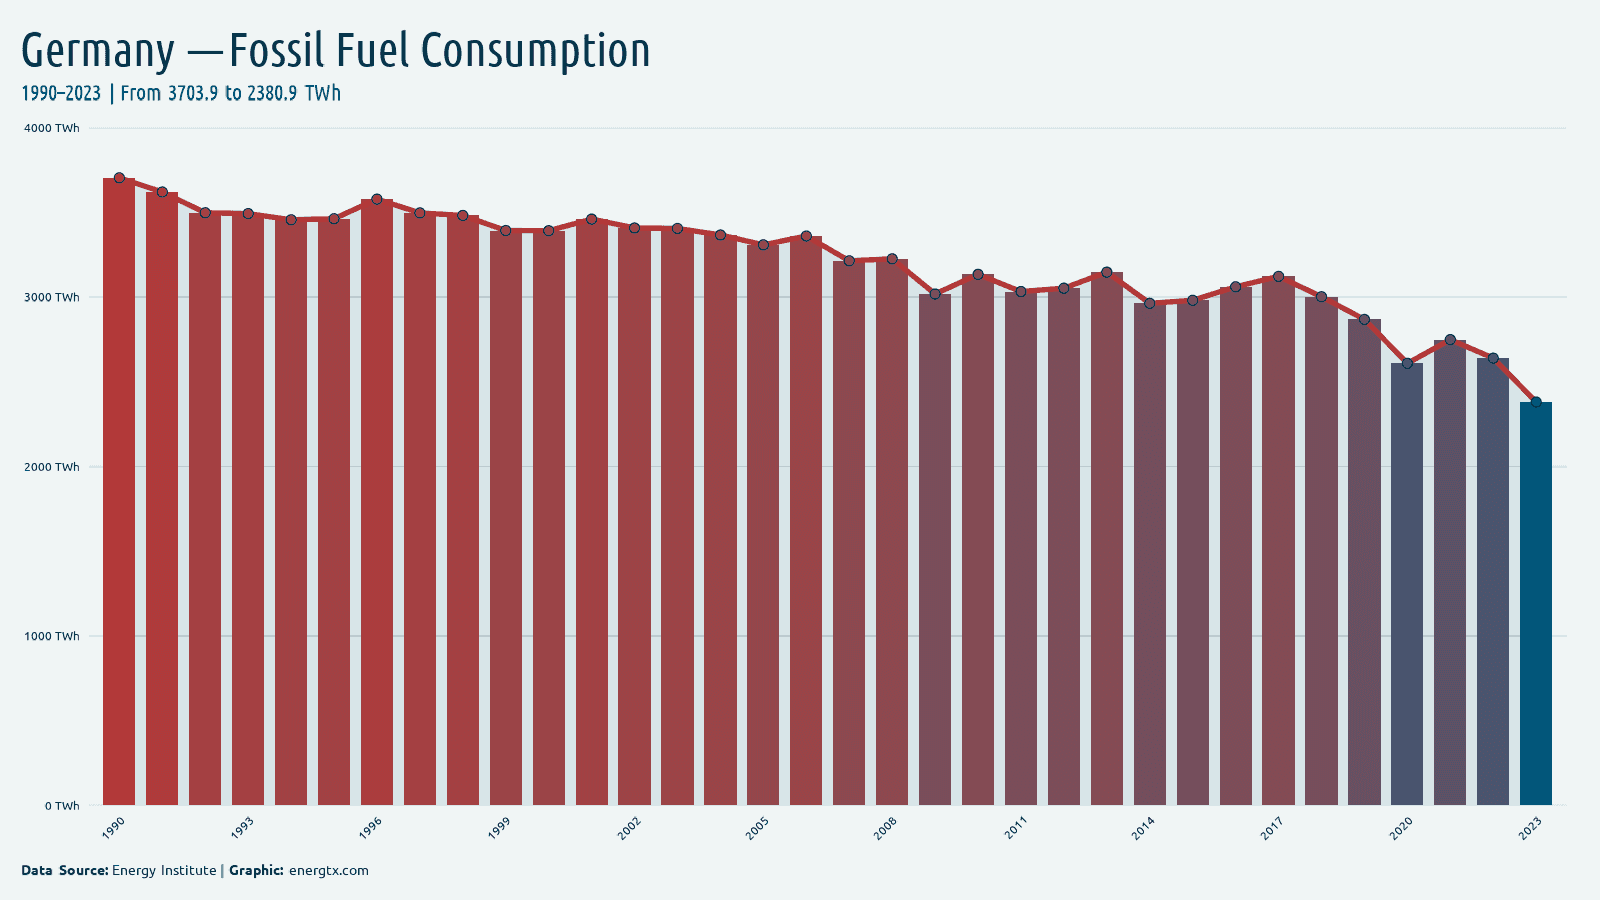
2023
Fossil Fuel Consumption
2.4k
TWh
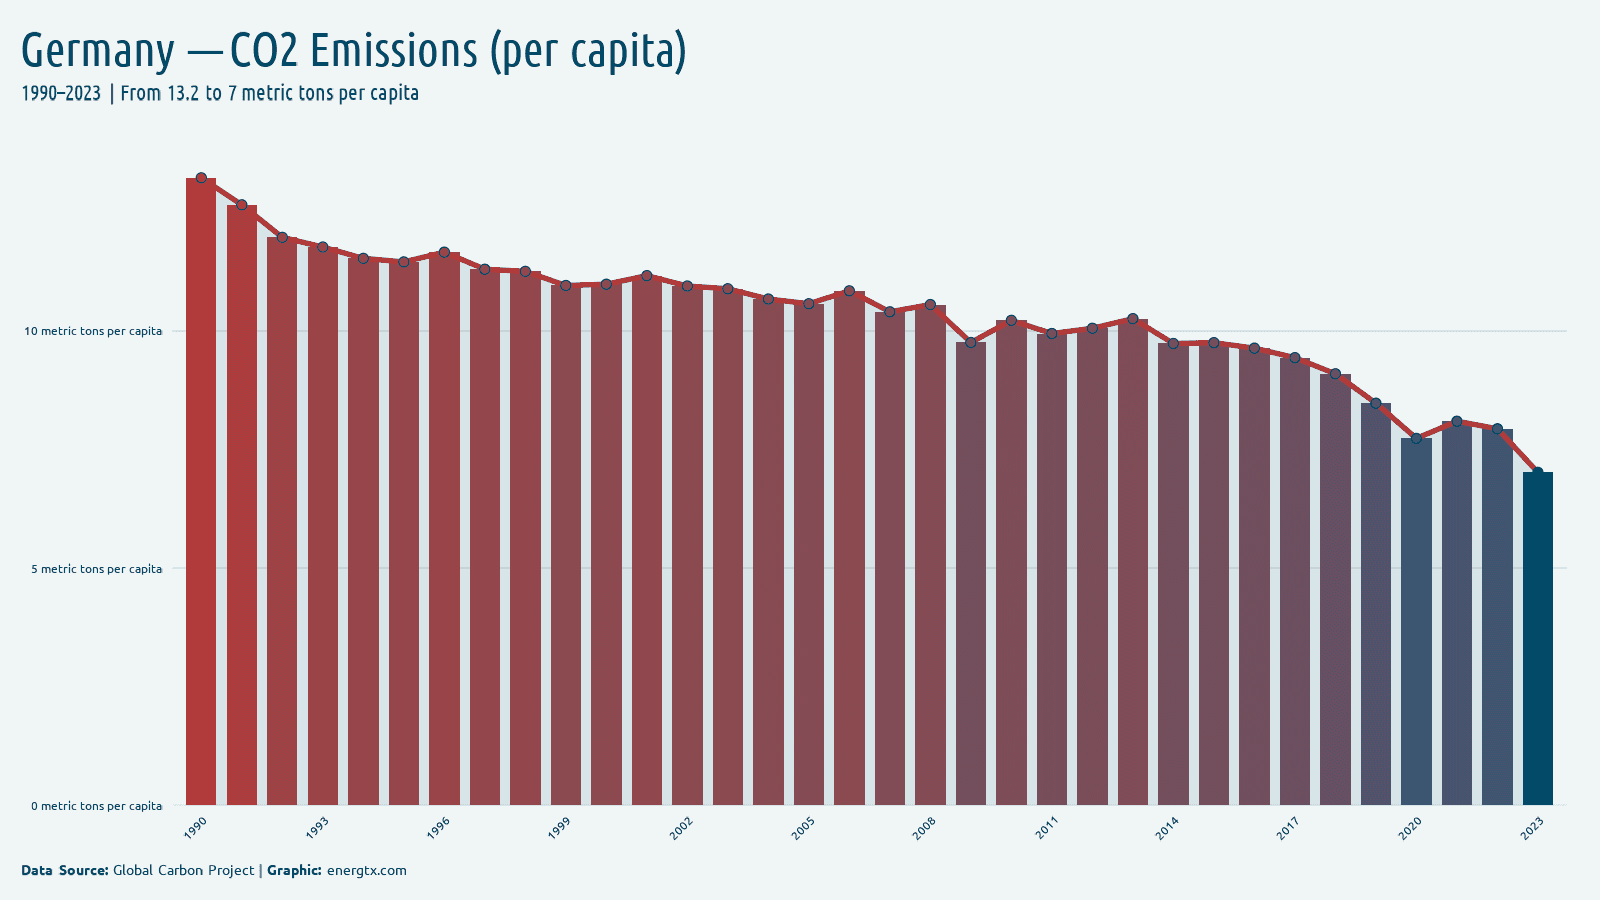
2023
CO2 Emissions (per capita)
7.0
metric tons/capita
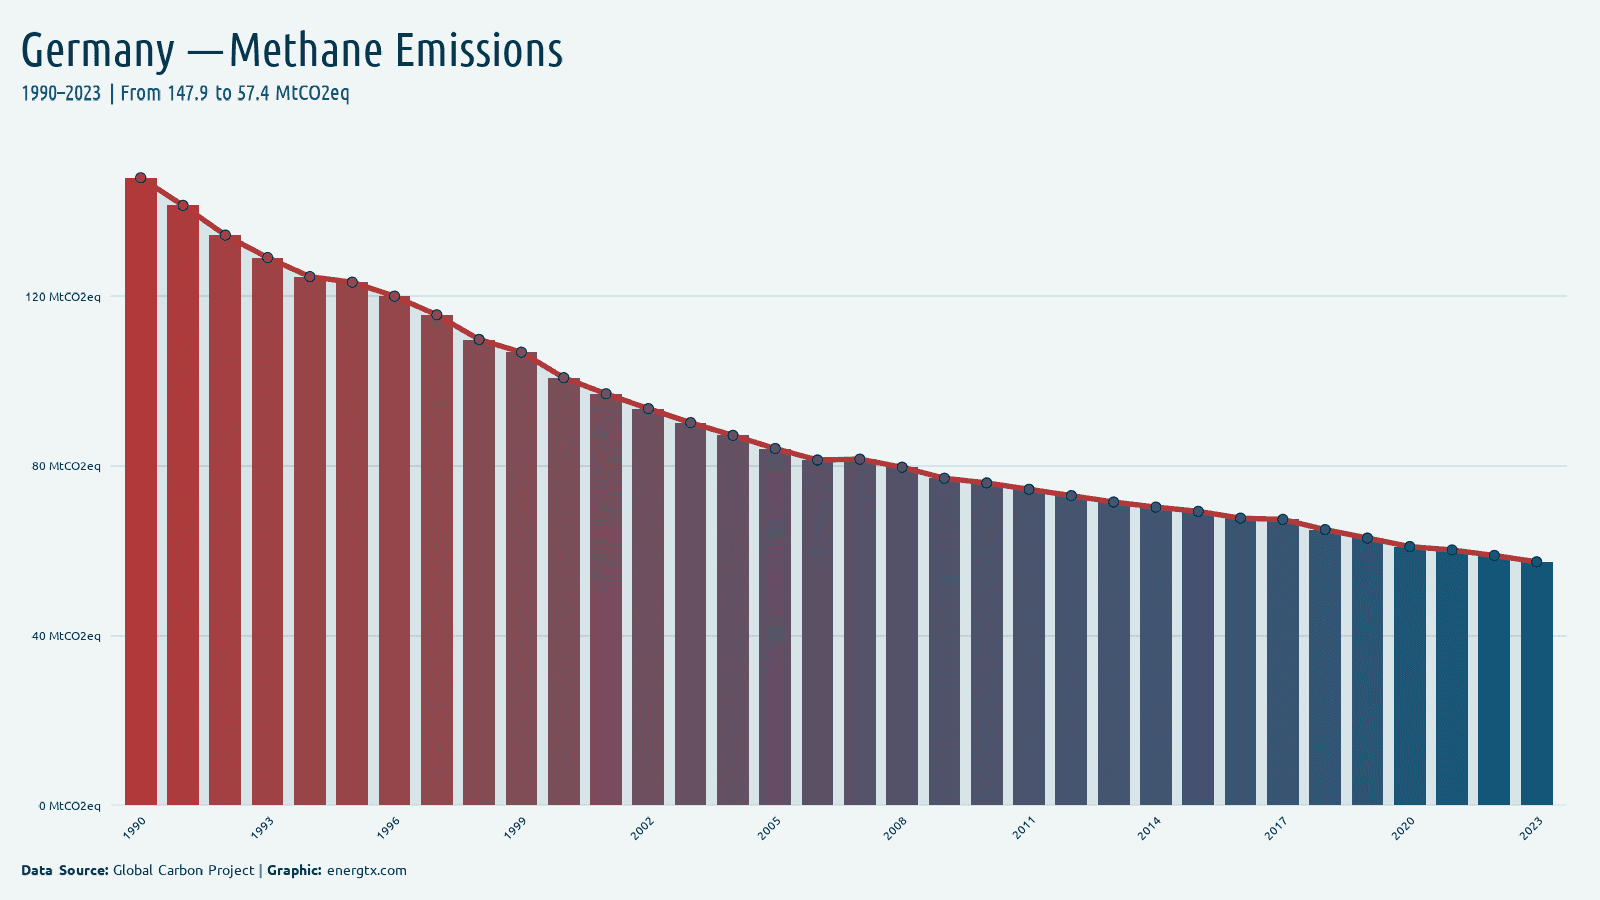
2023
Methane Emissions
57.4
MtCO2eq
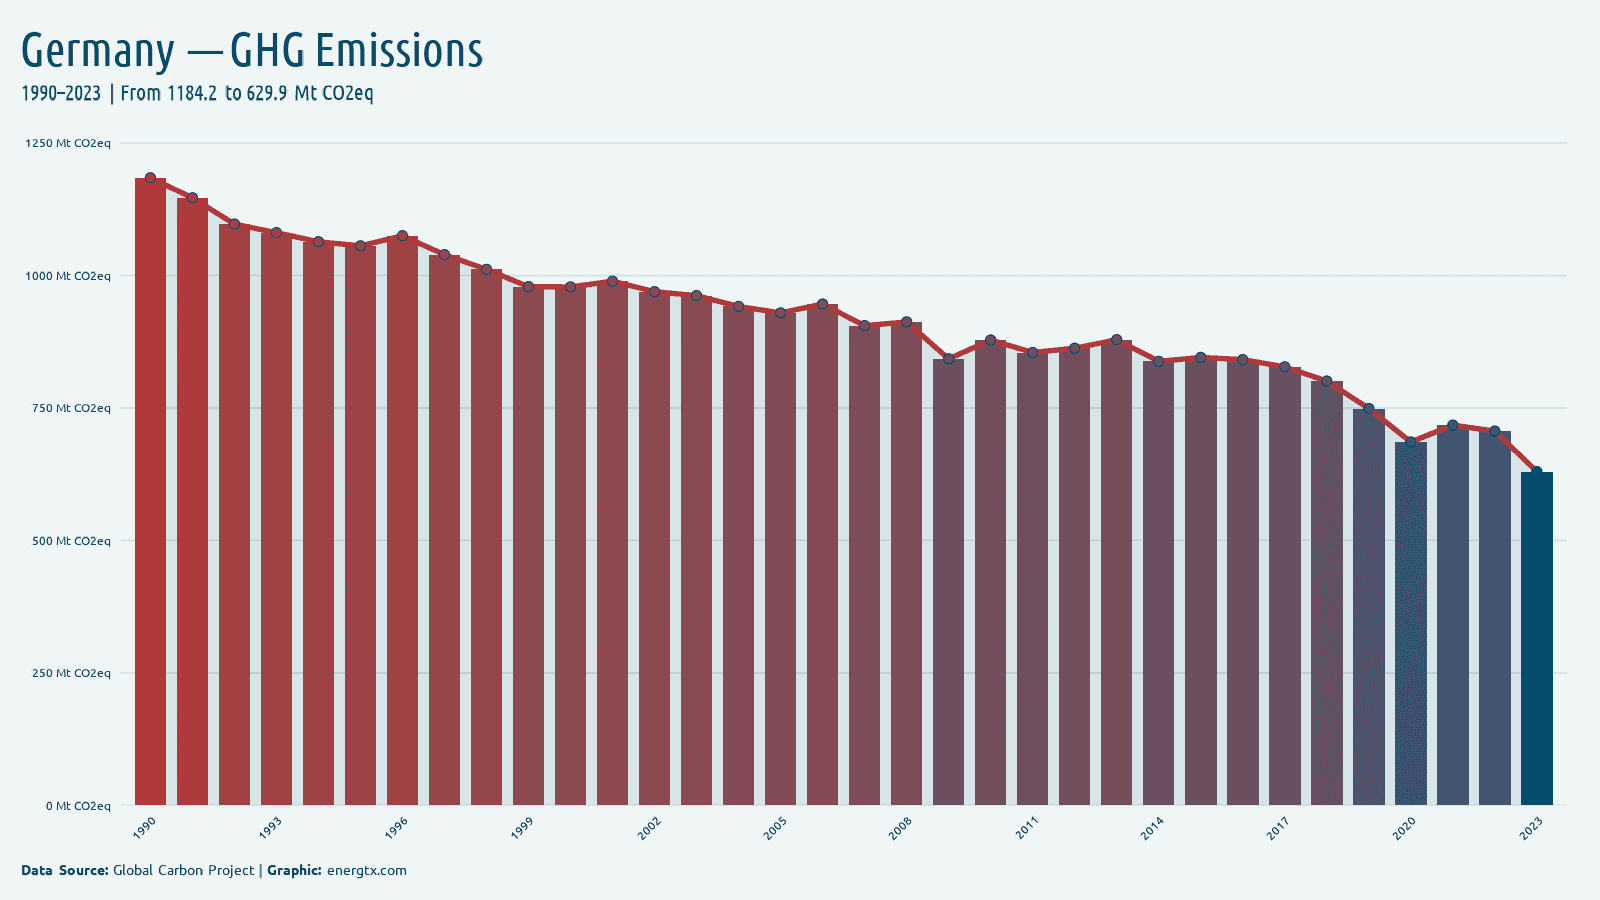
2023
GHG Emissions
629.9
MtCO2eq
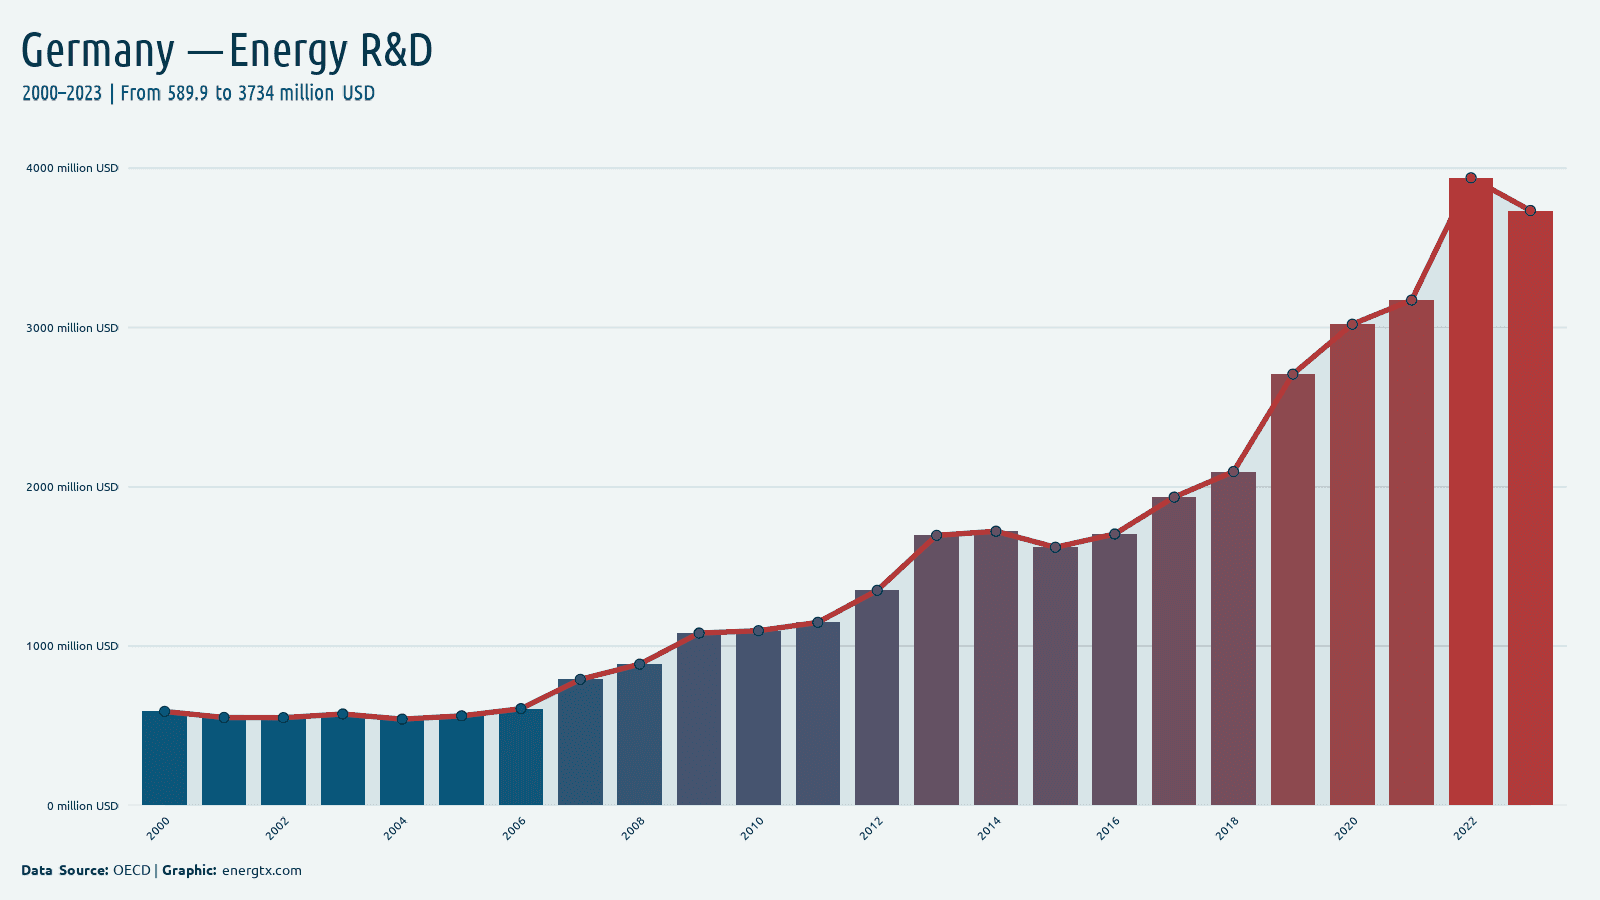
2023
Energy R&D
3.7k
million $
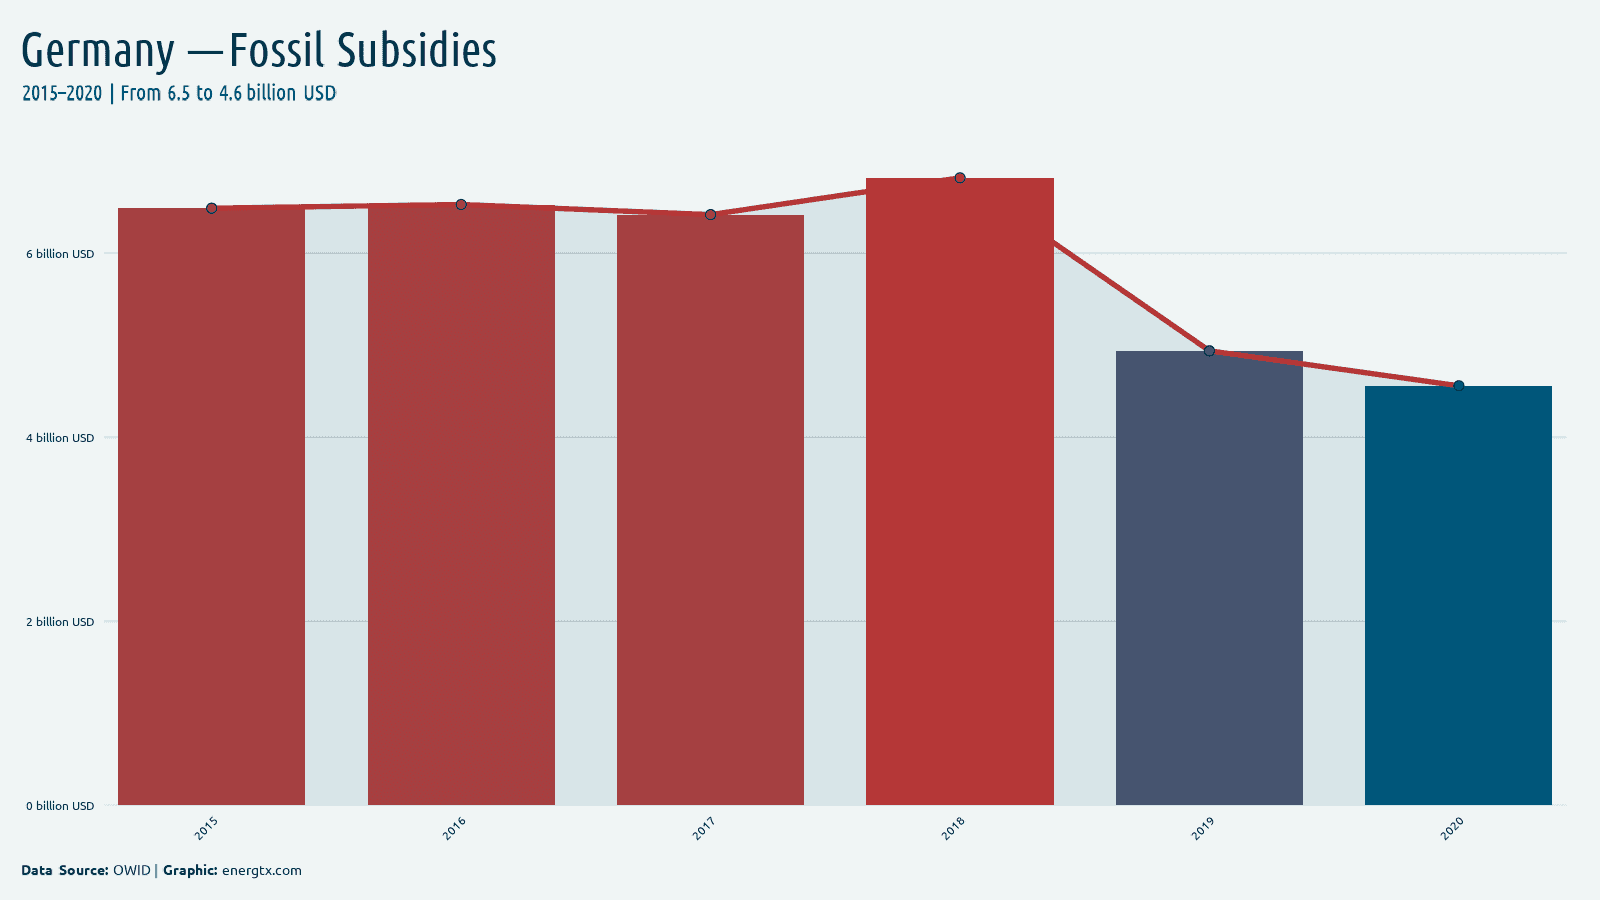
2020
Fossil Subsidies
4.6
billion $
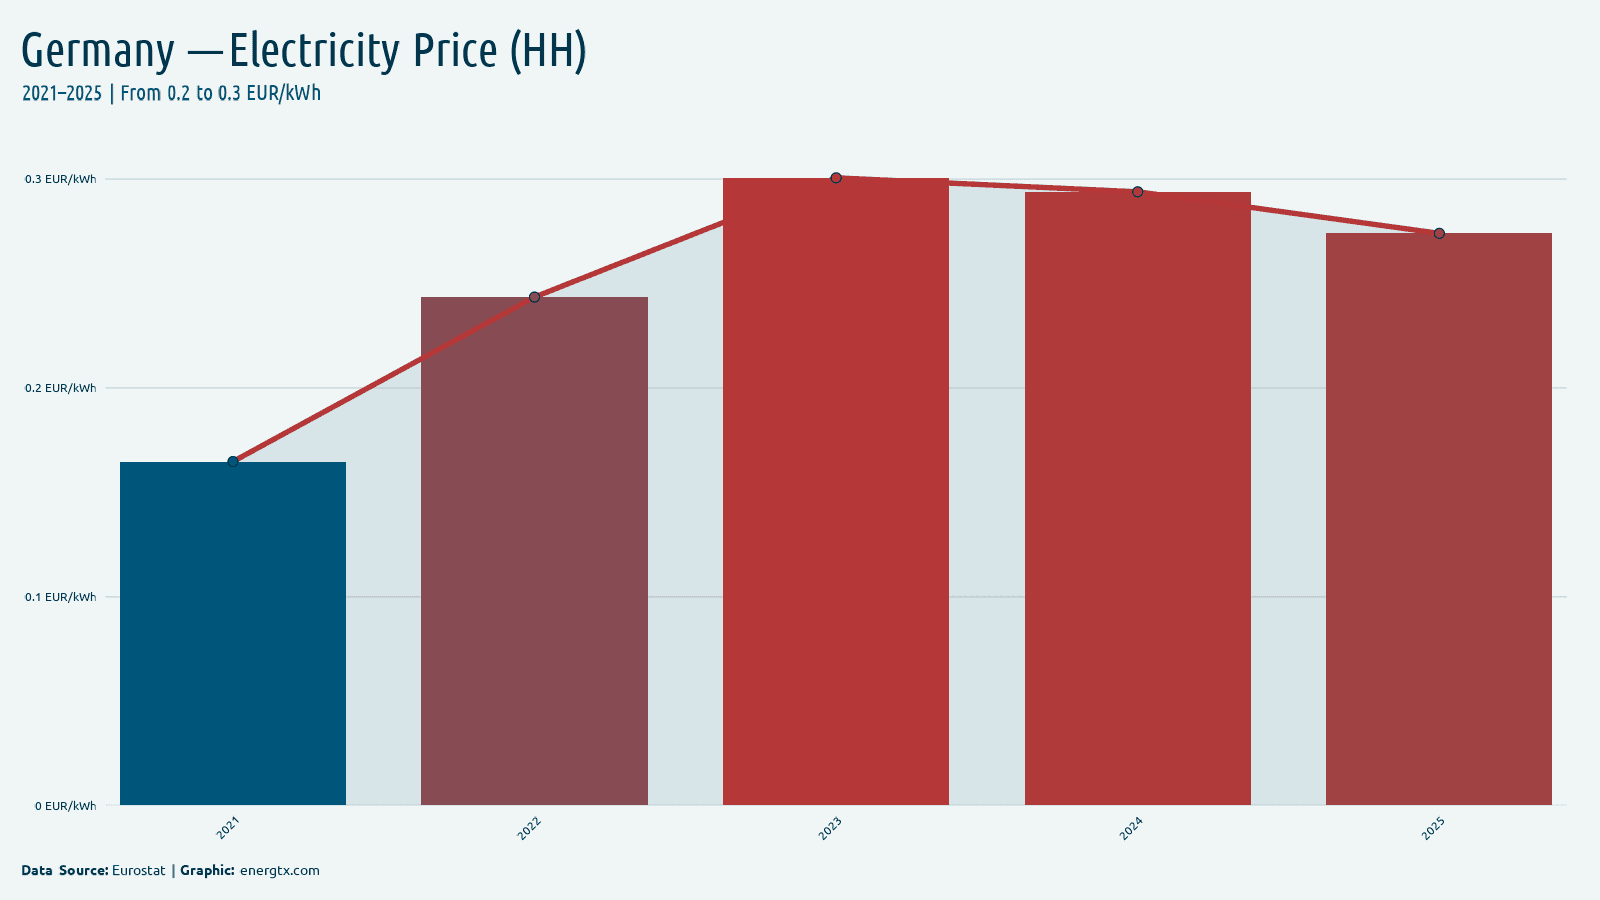
2025
Electricity Price (HH)
0.3
EUR/kWh
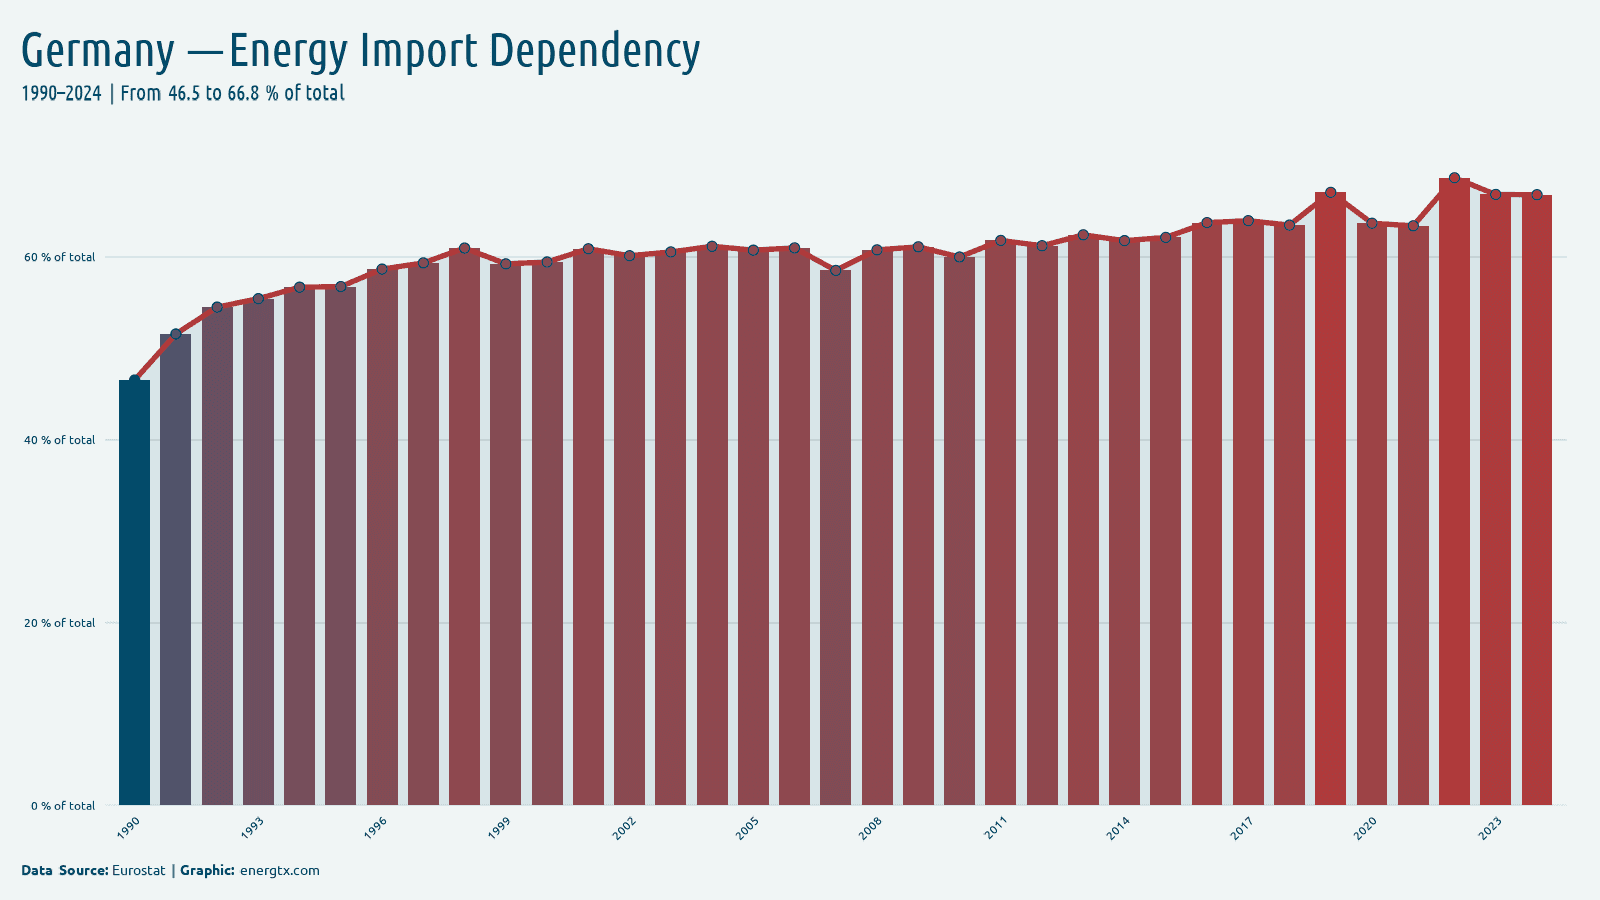
2024
Energy Import Dependency
66.8%
%
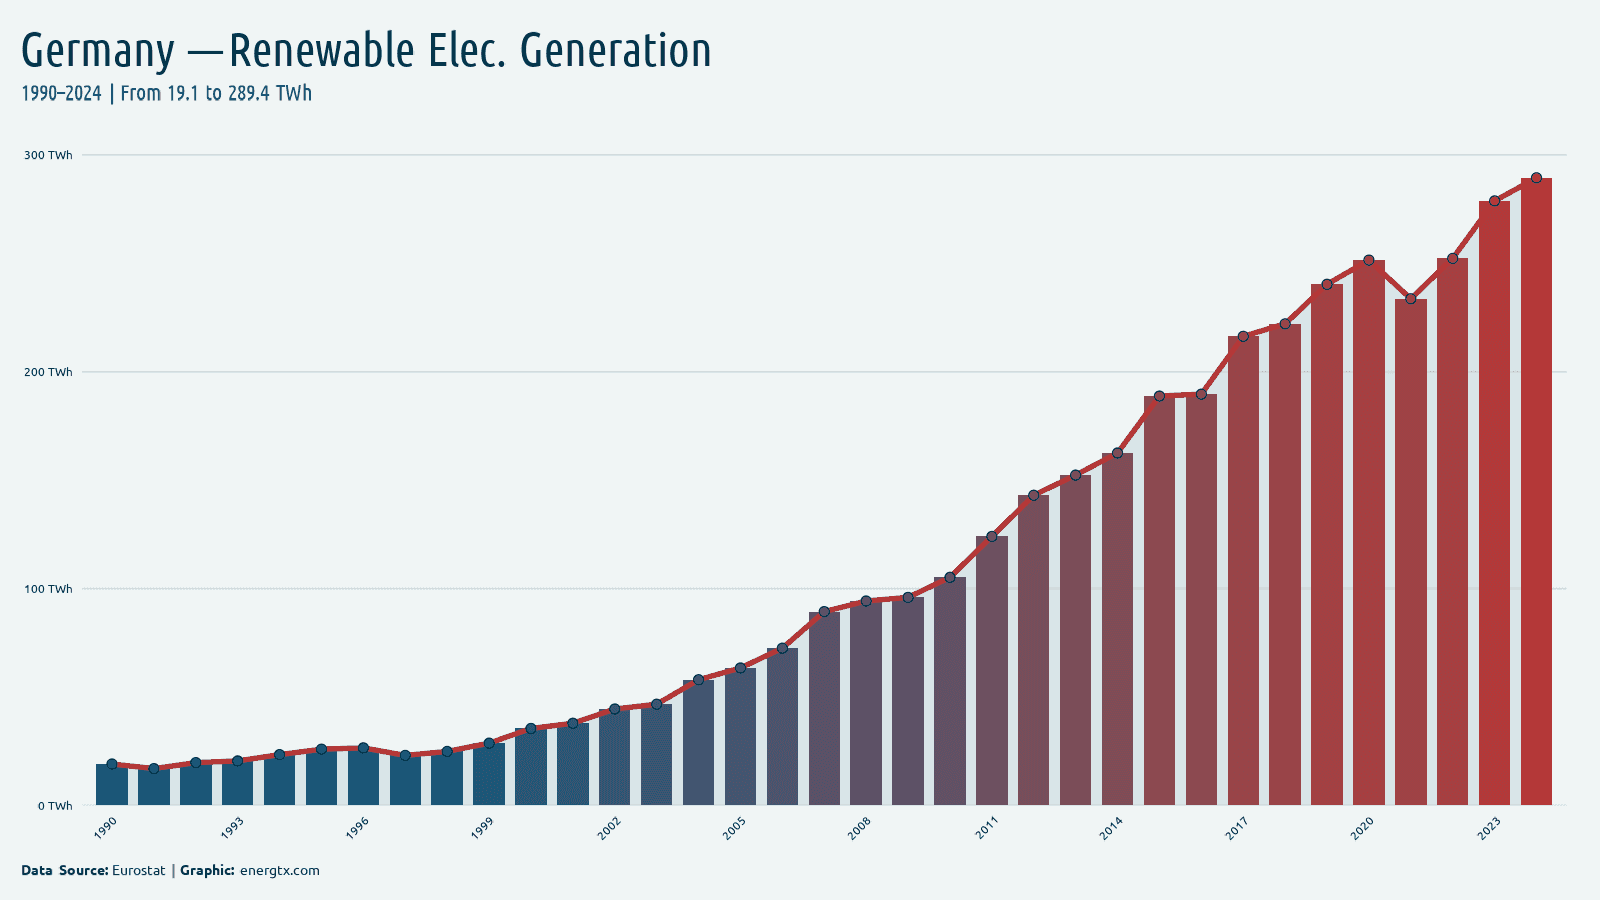
2024
Renewable Elec. Generation
289.4
TWh
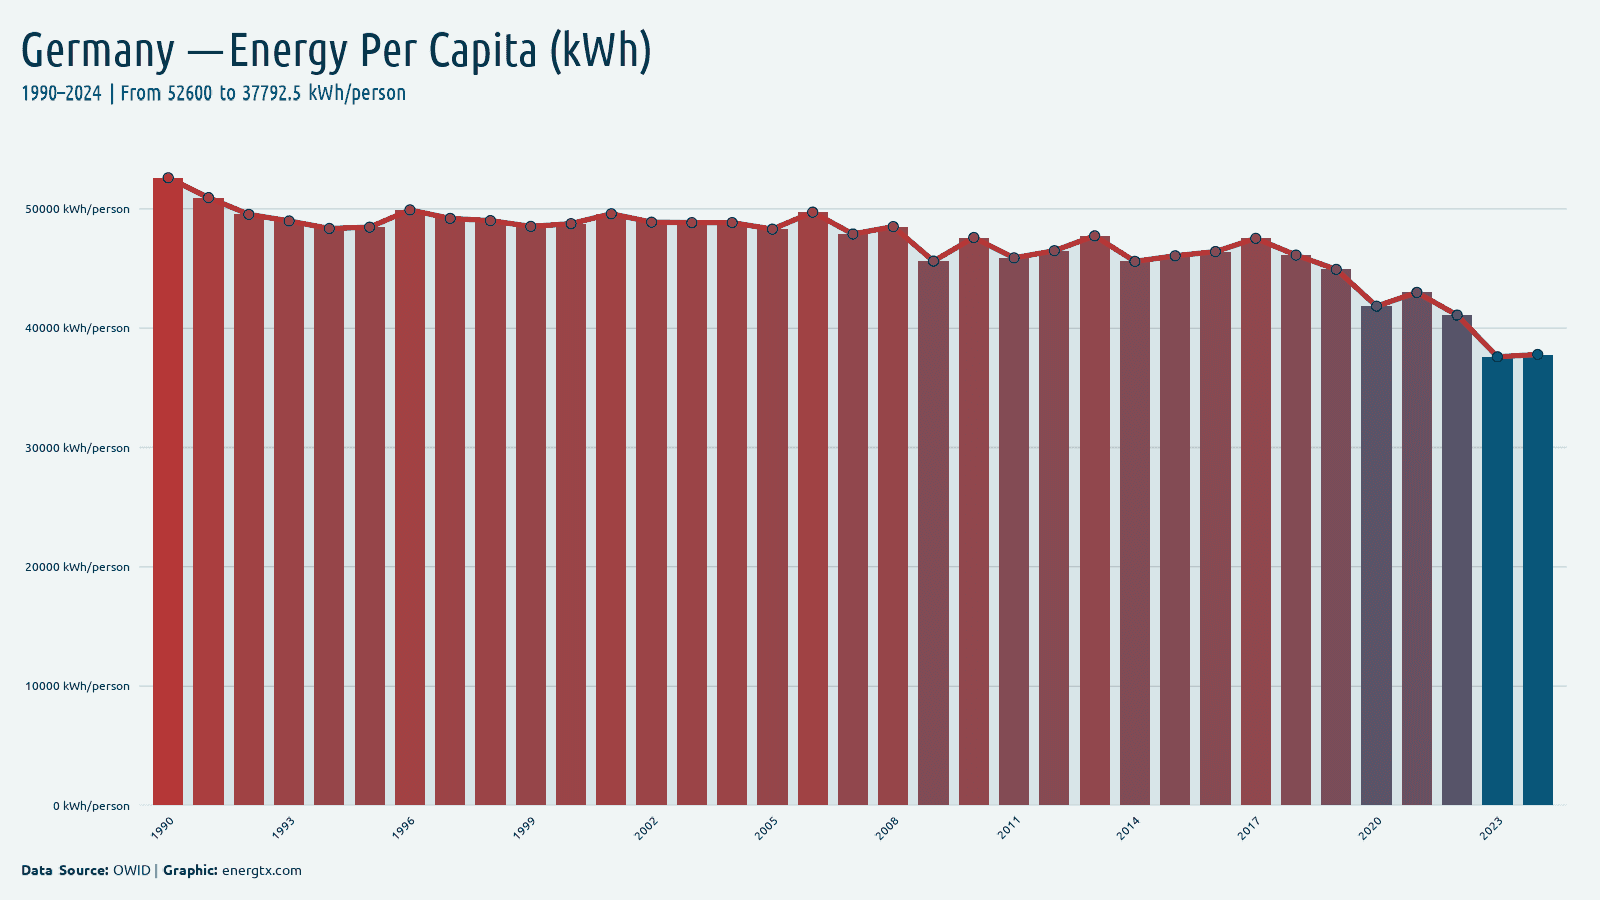
2024
Energy Use Per Capita (kWh)
37.8k
kWh/capita
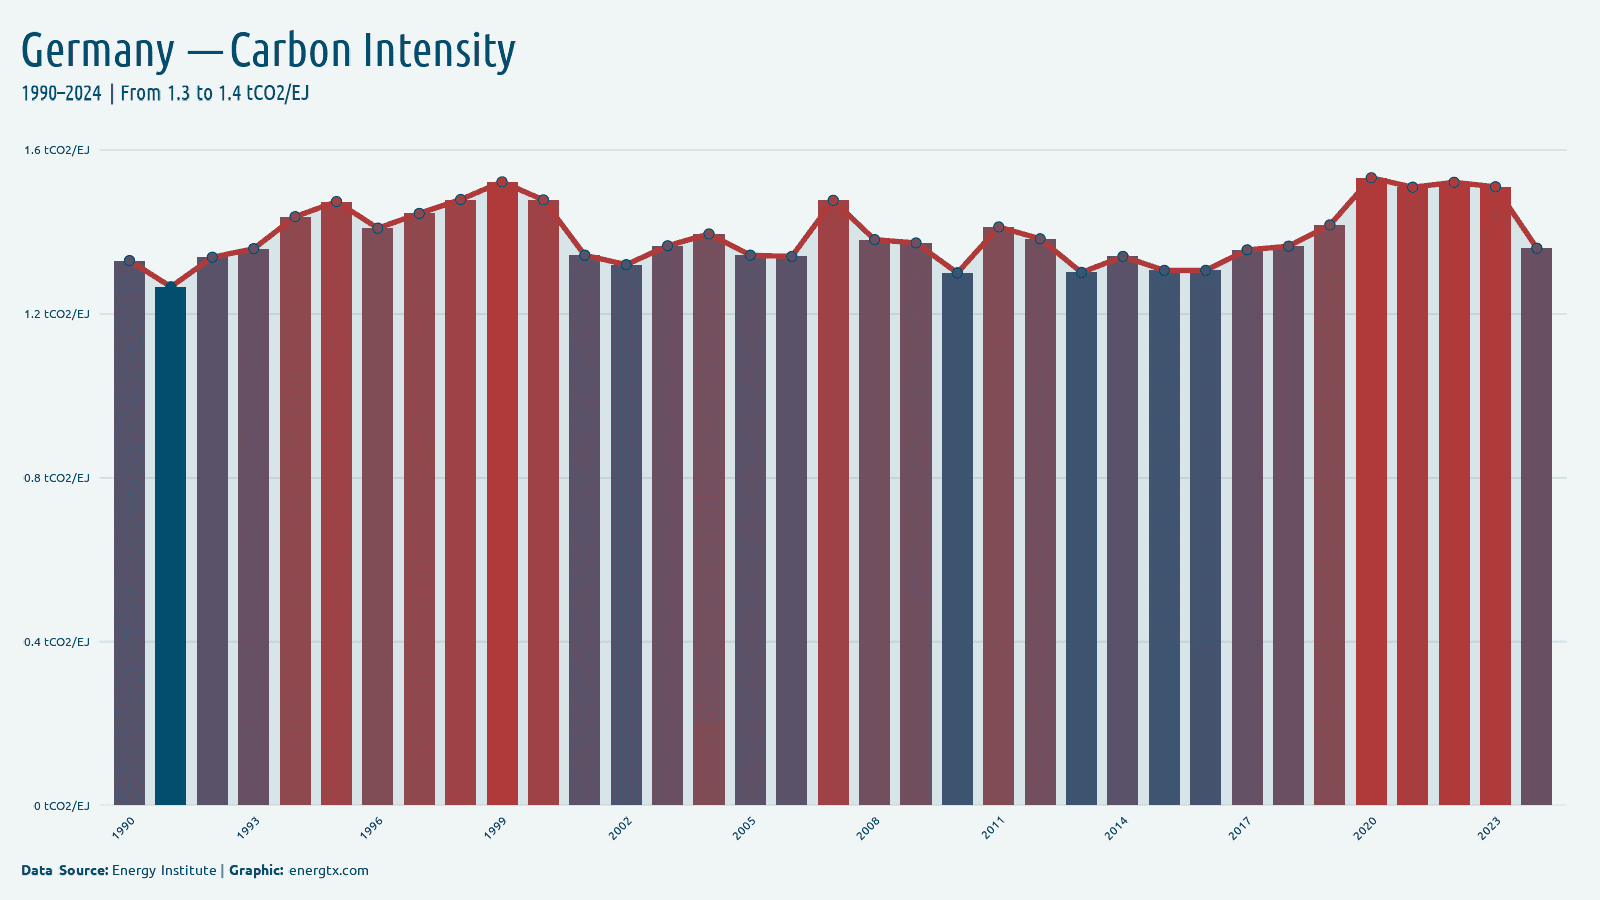
2024
Carbon Intensity
1.4
tCO2/EJ
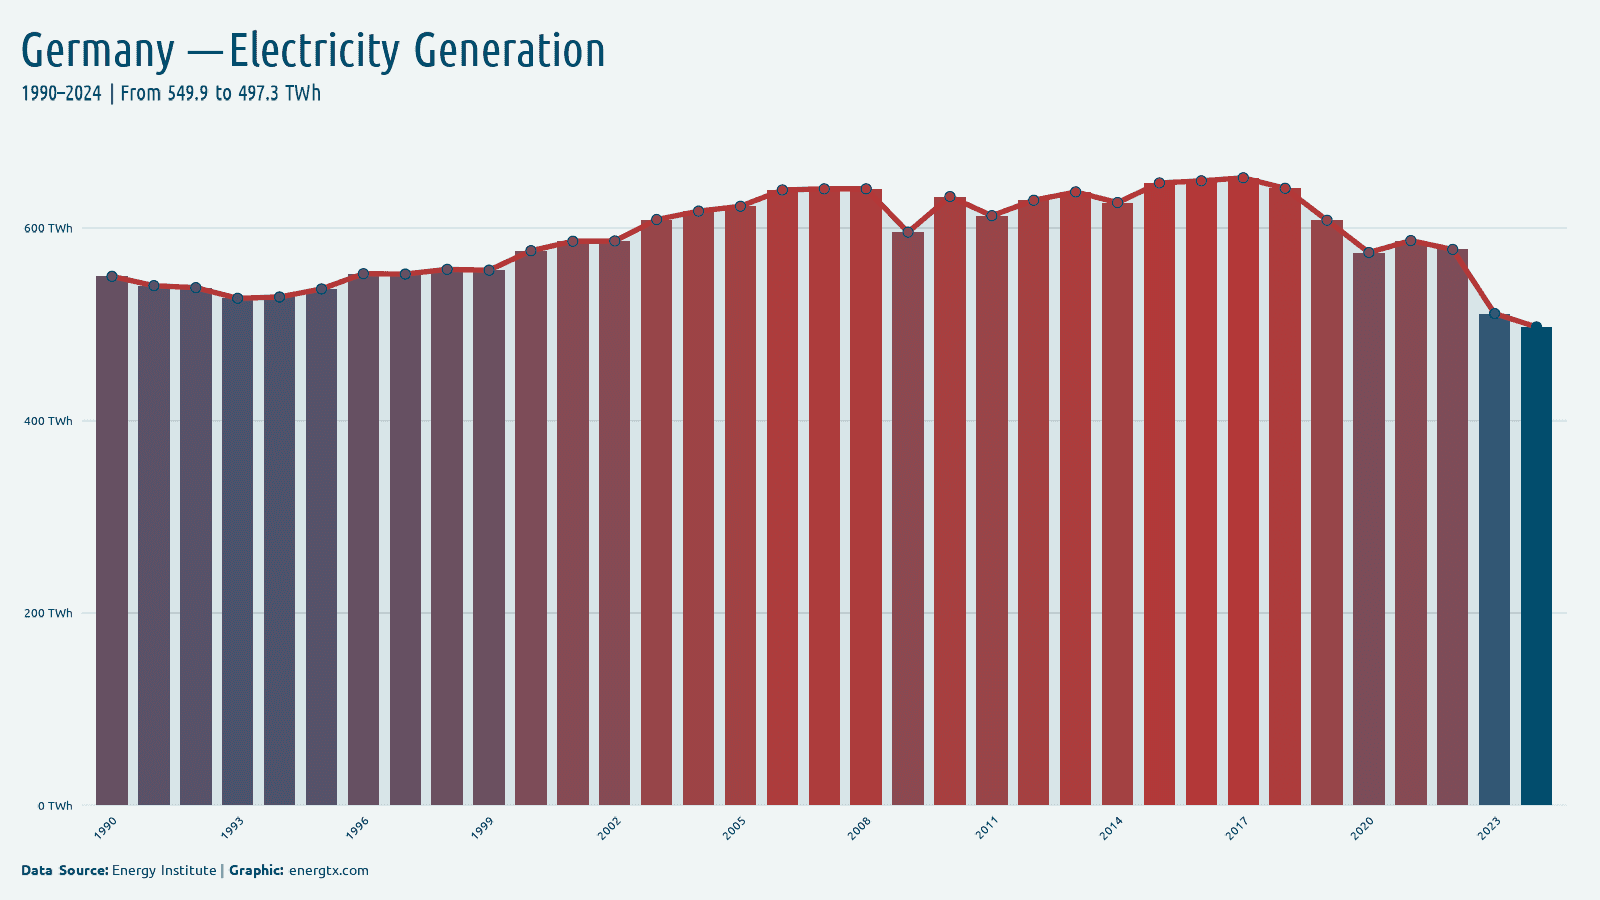
2024
Electricity Generation
497.3
TWh
2024
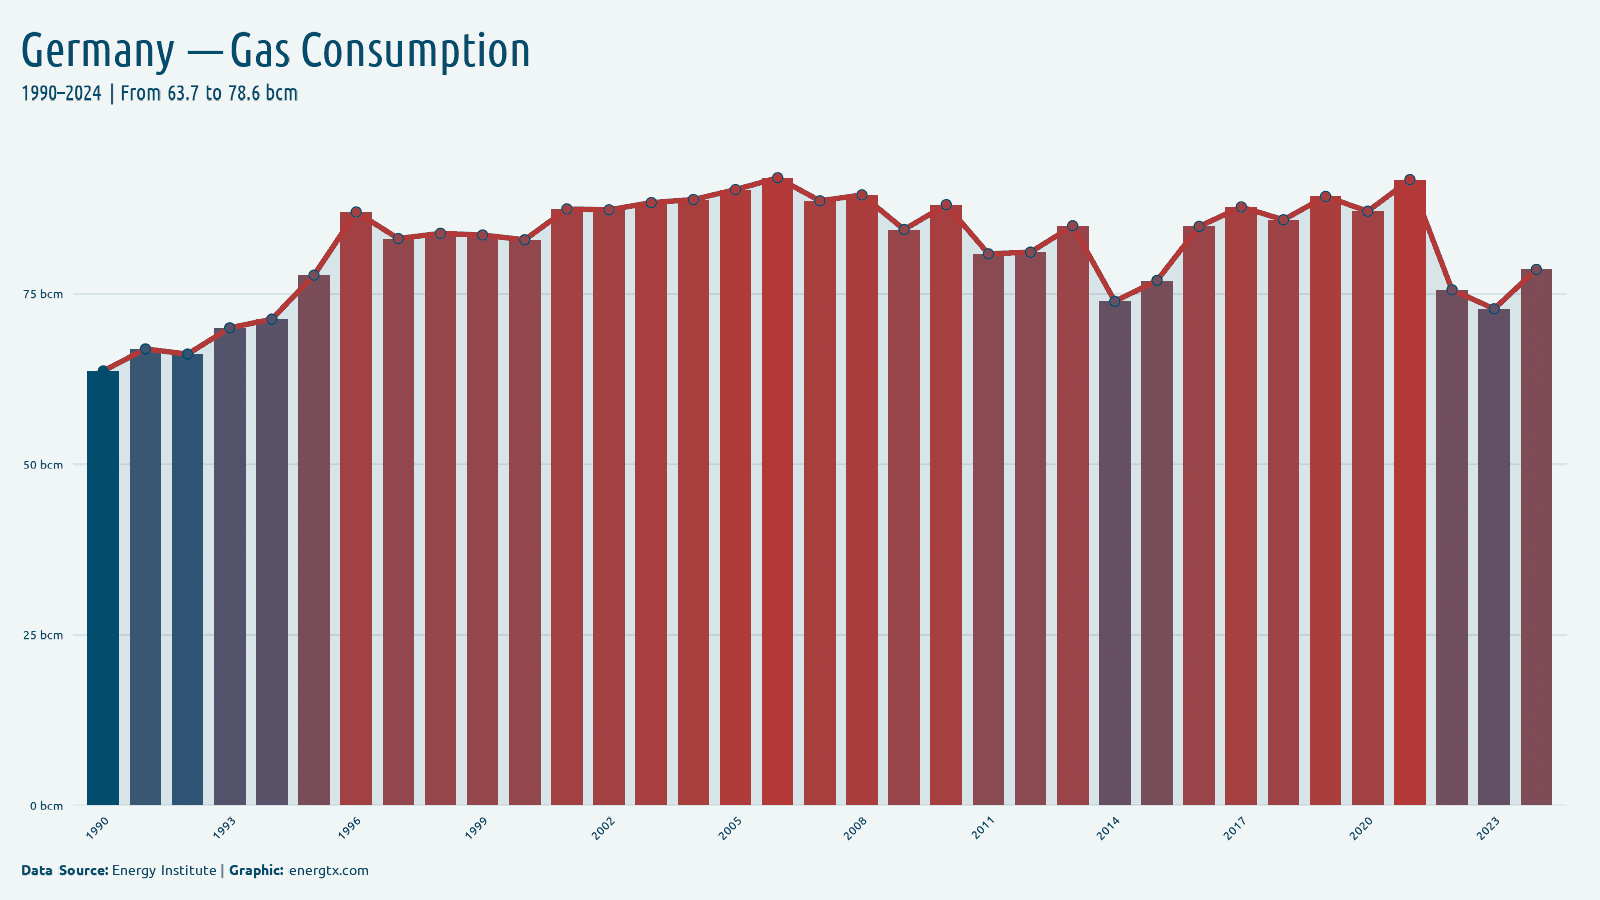
Gas Consumption
78.6
bcm
2024
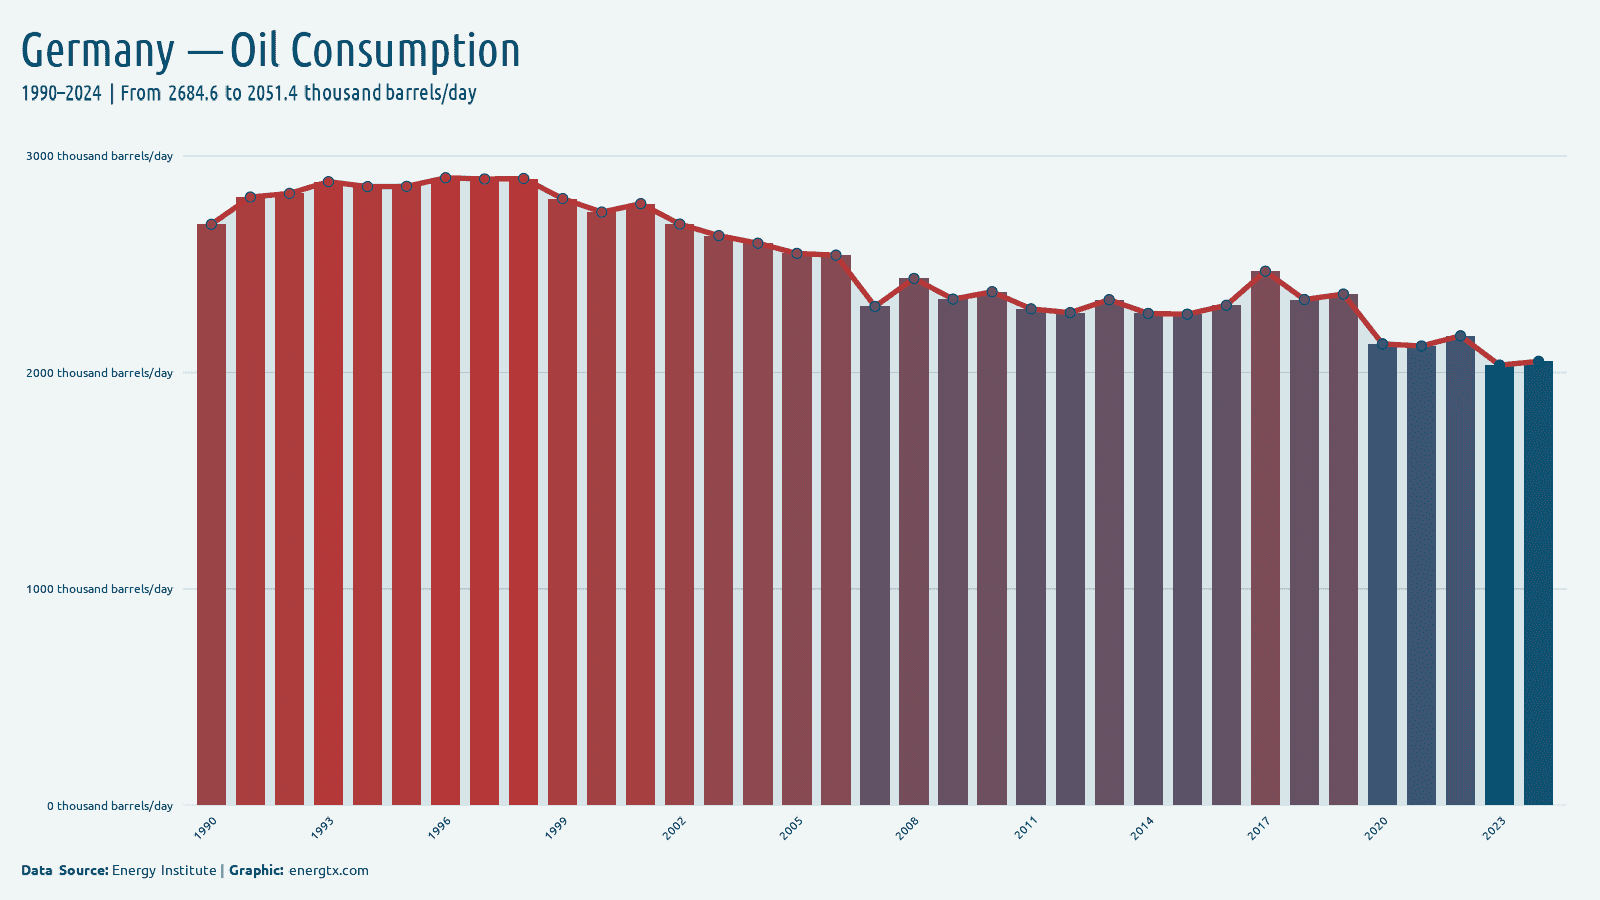
Oil Consumption
2.1k
k barrels/day
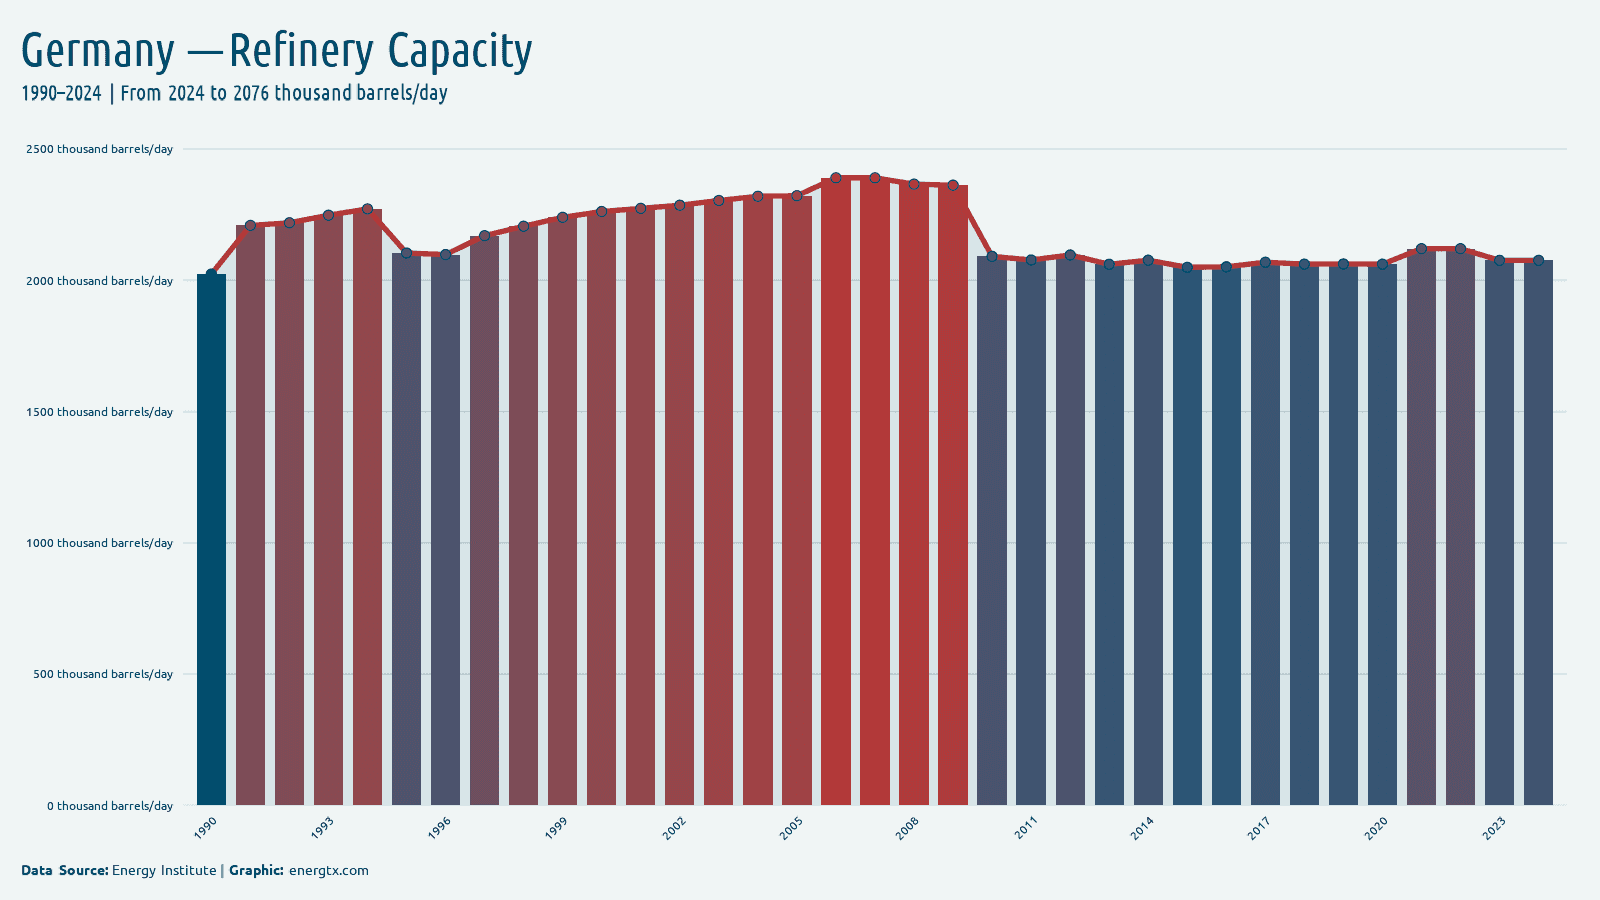
2024
Refinery Capacity
2.1k
k barrels/day
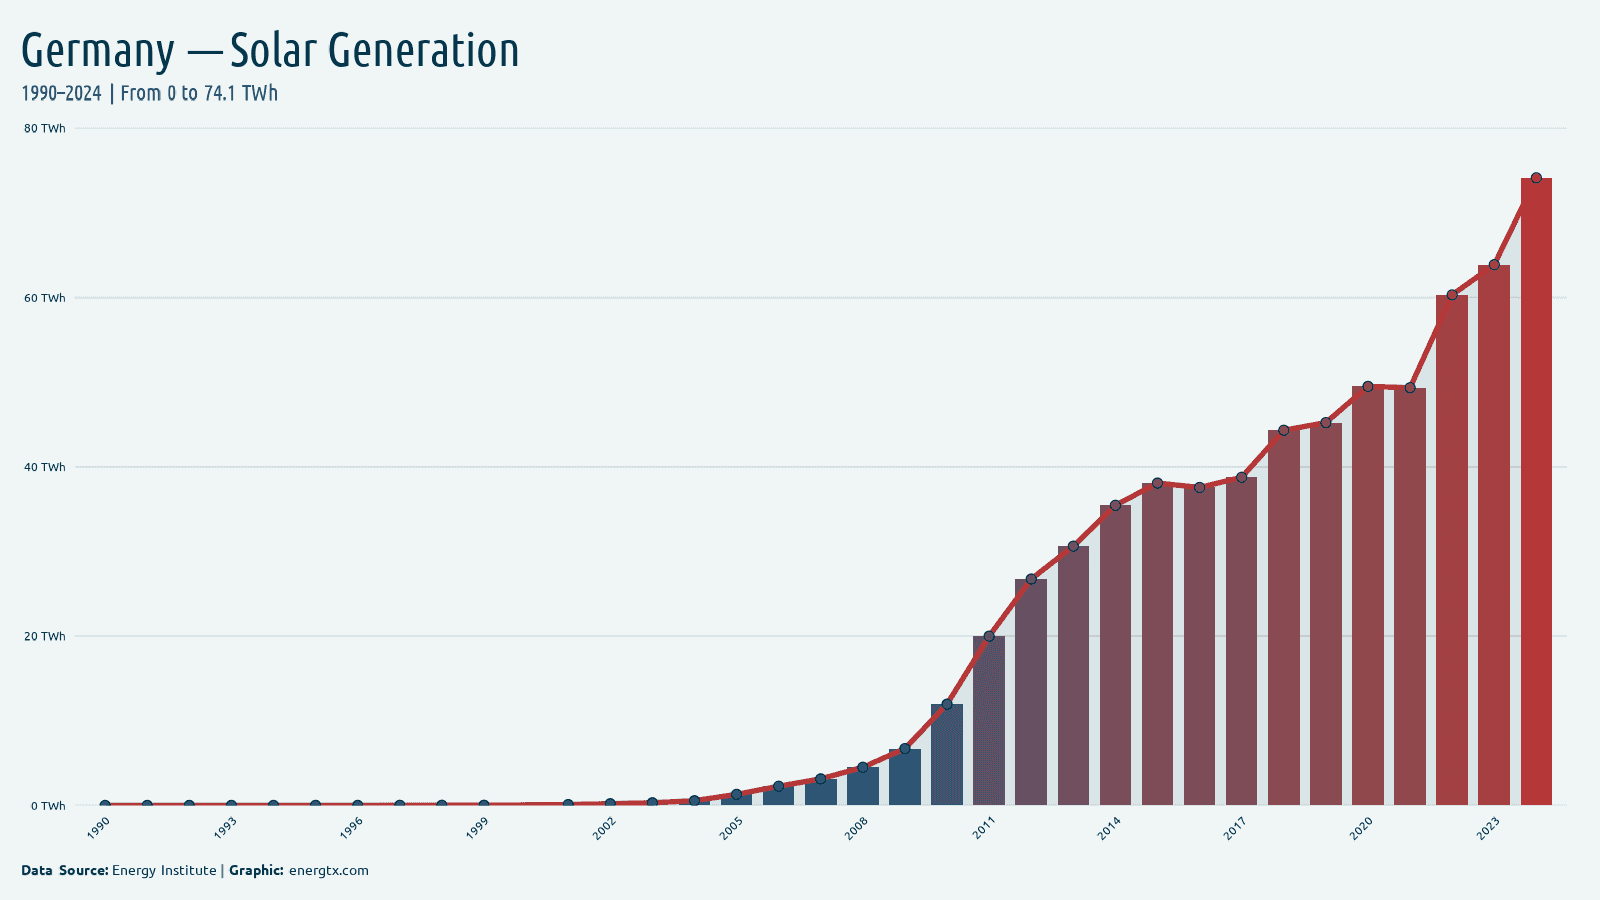
2024
Solar Generation
74.1
TWh
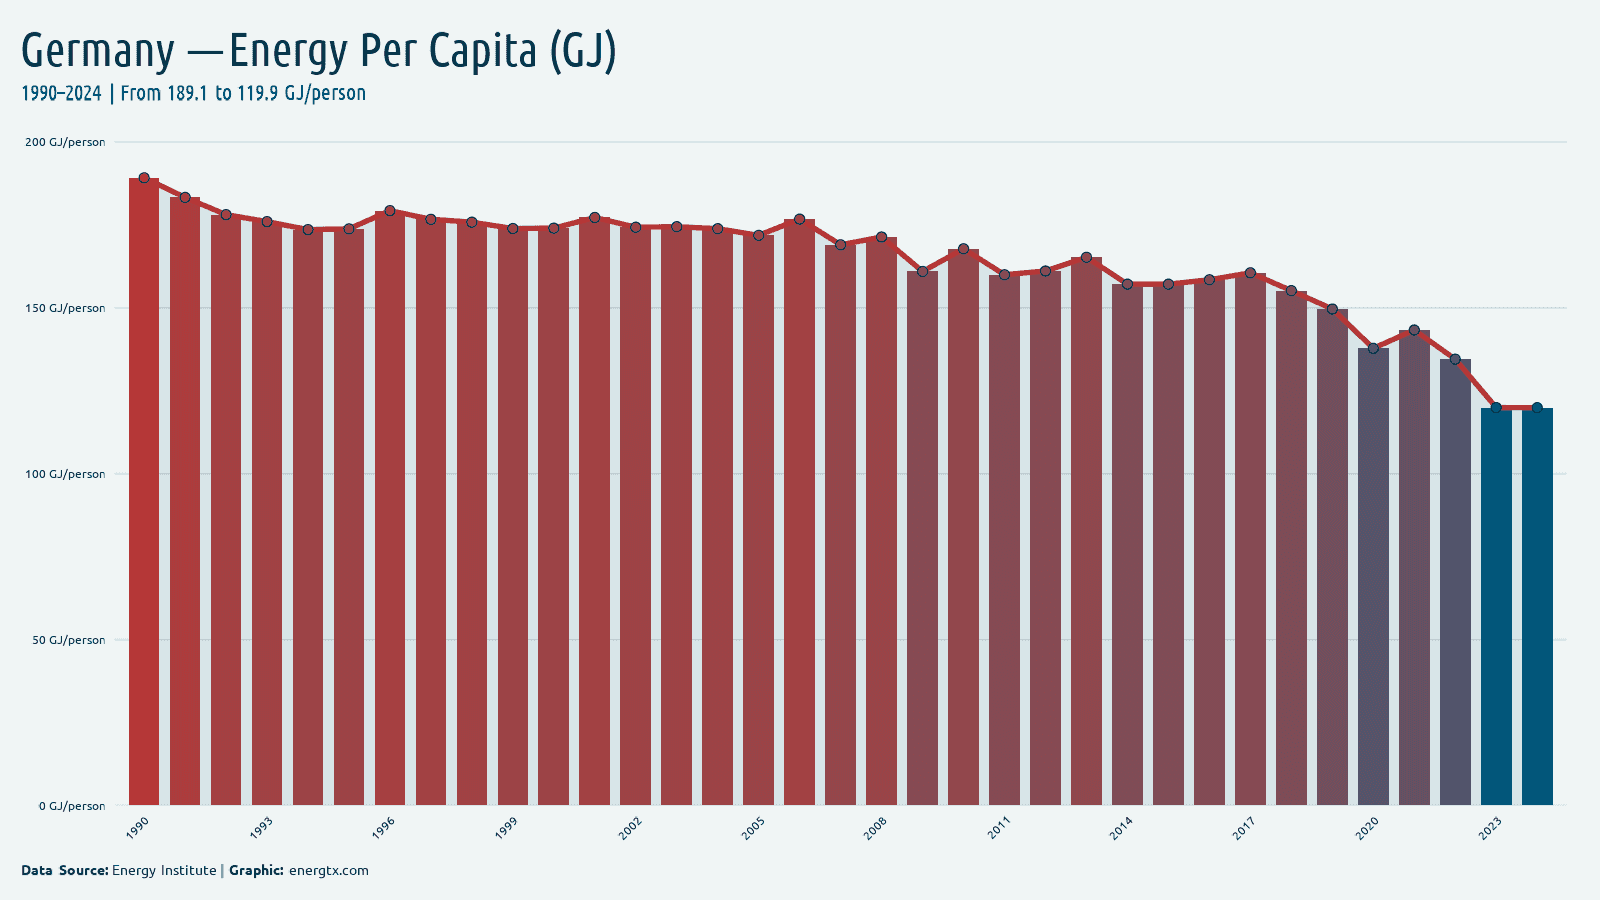
2024
Energy Per Capita (GJ)
119.9
GJ/person
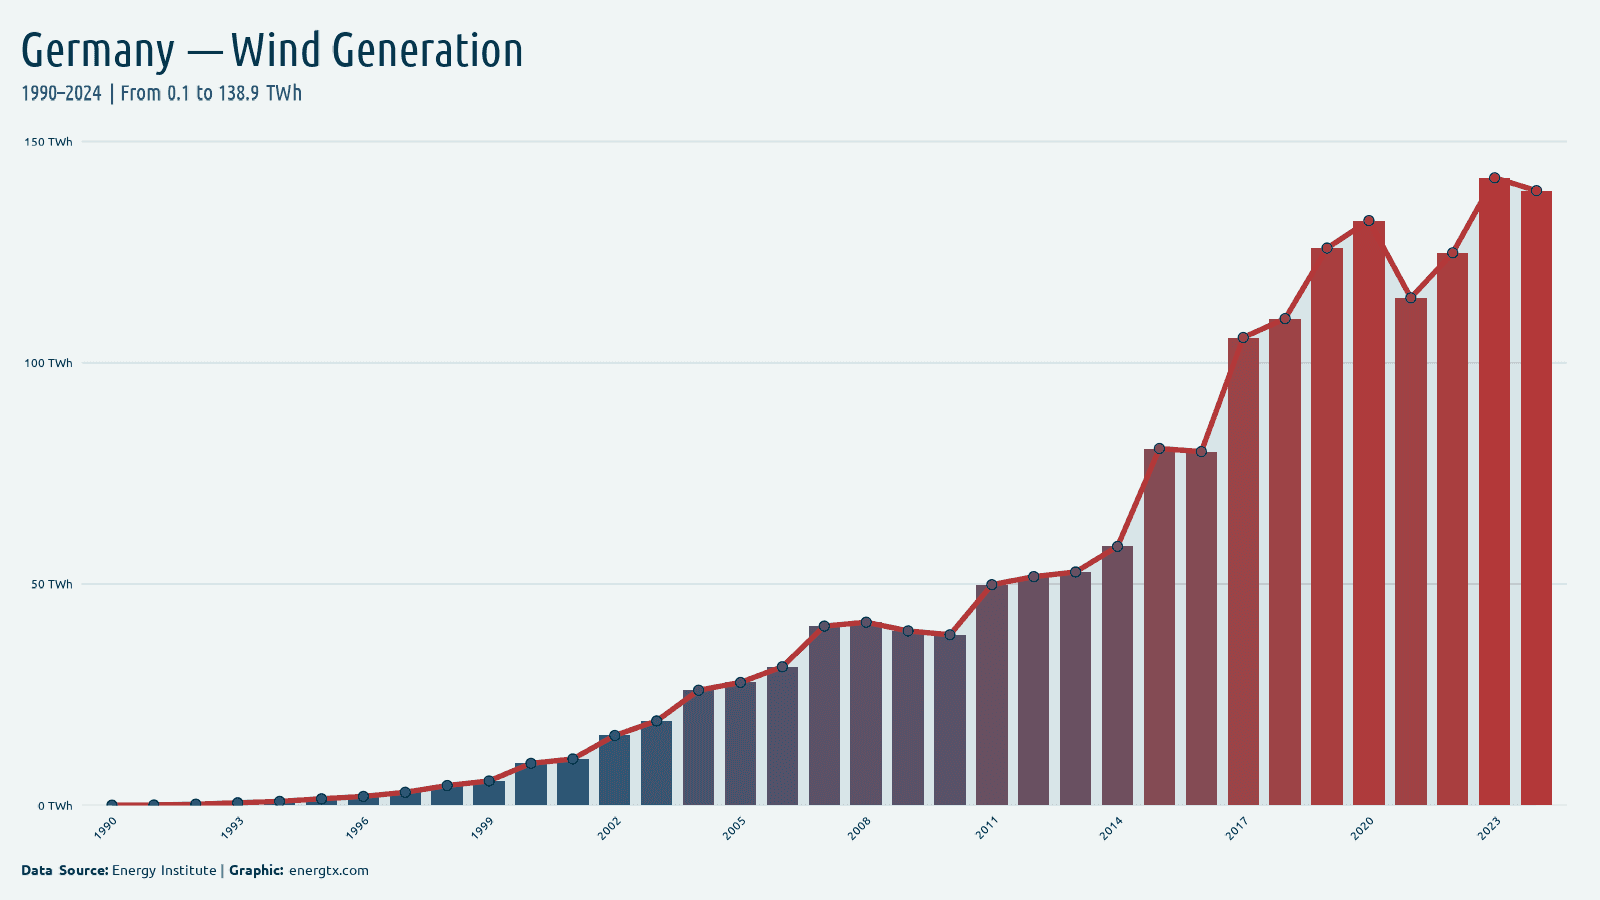
2024
Wind Generation
138.9
TWh
2024
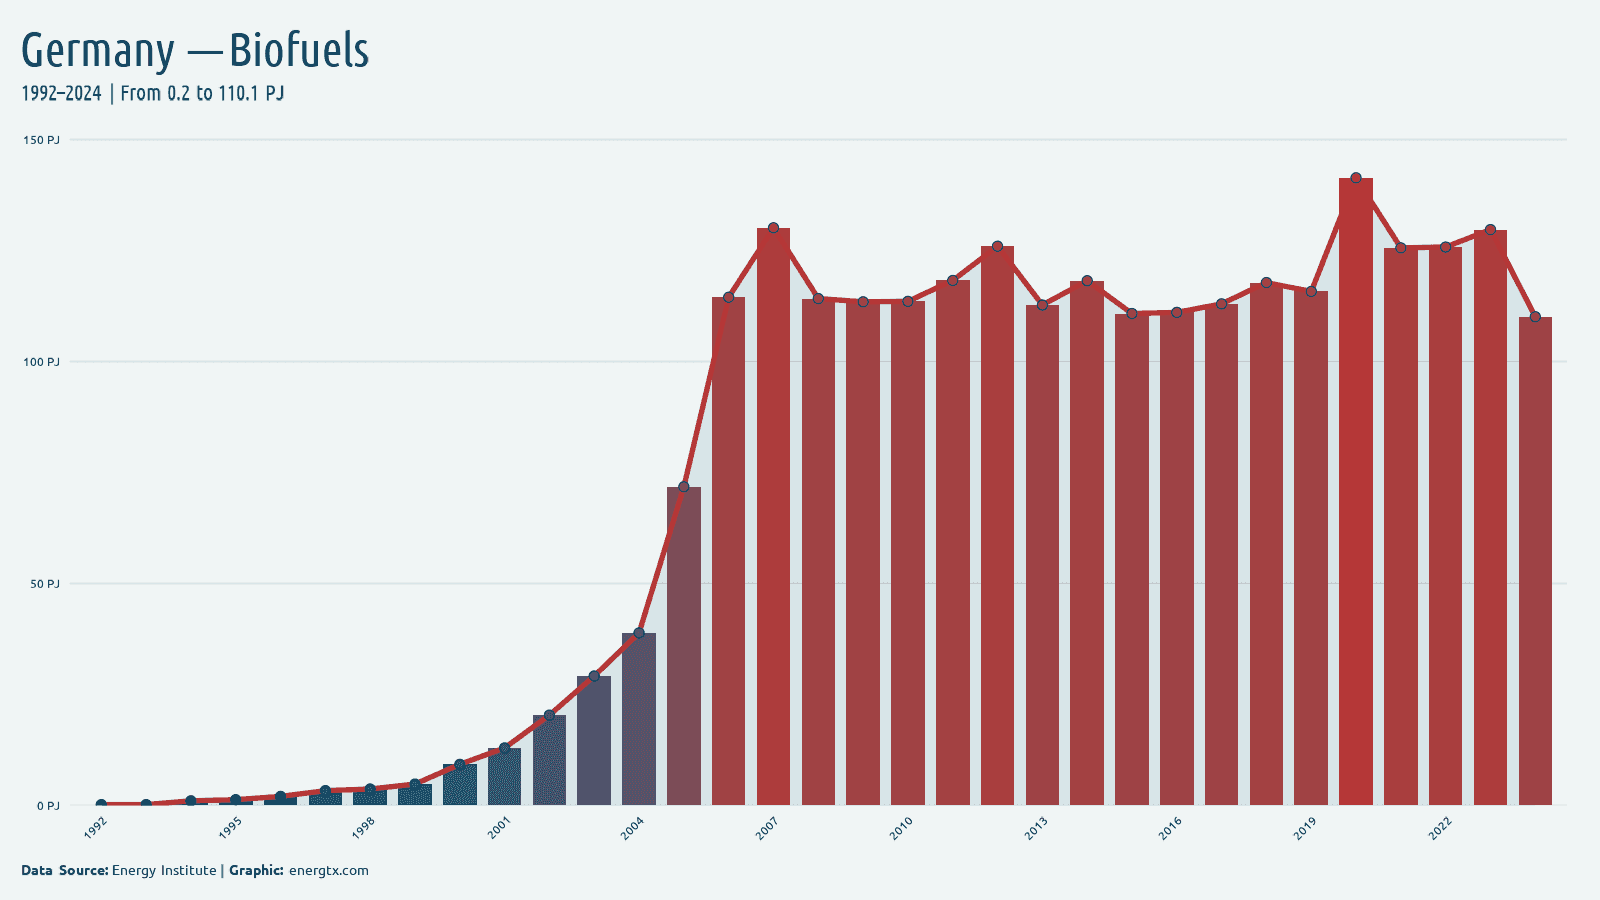
Biofuels Consumption
110.1
PJ
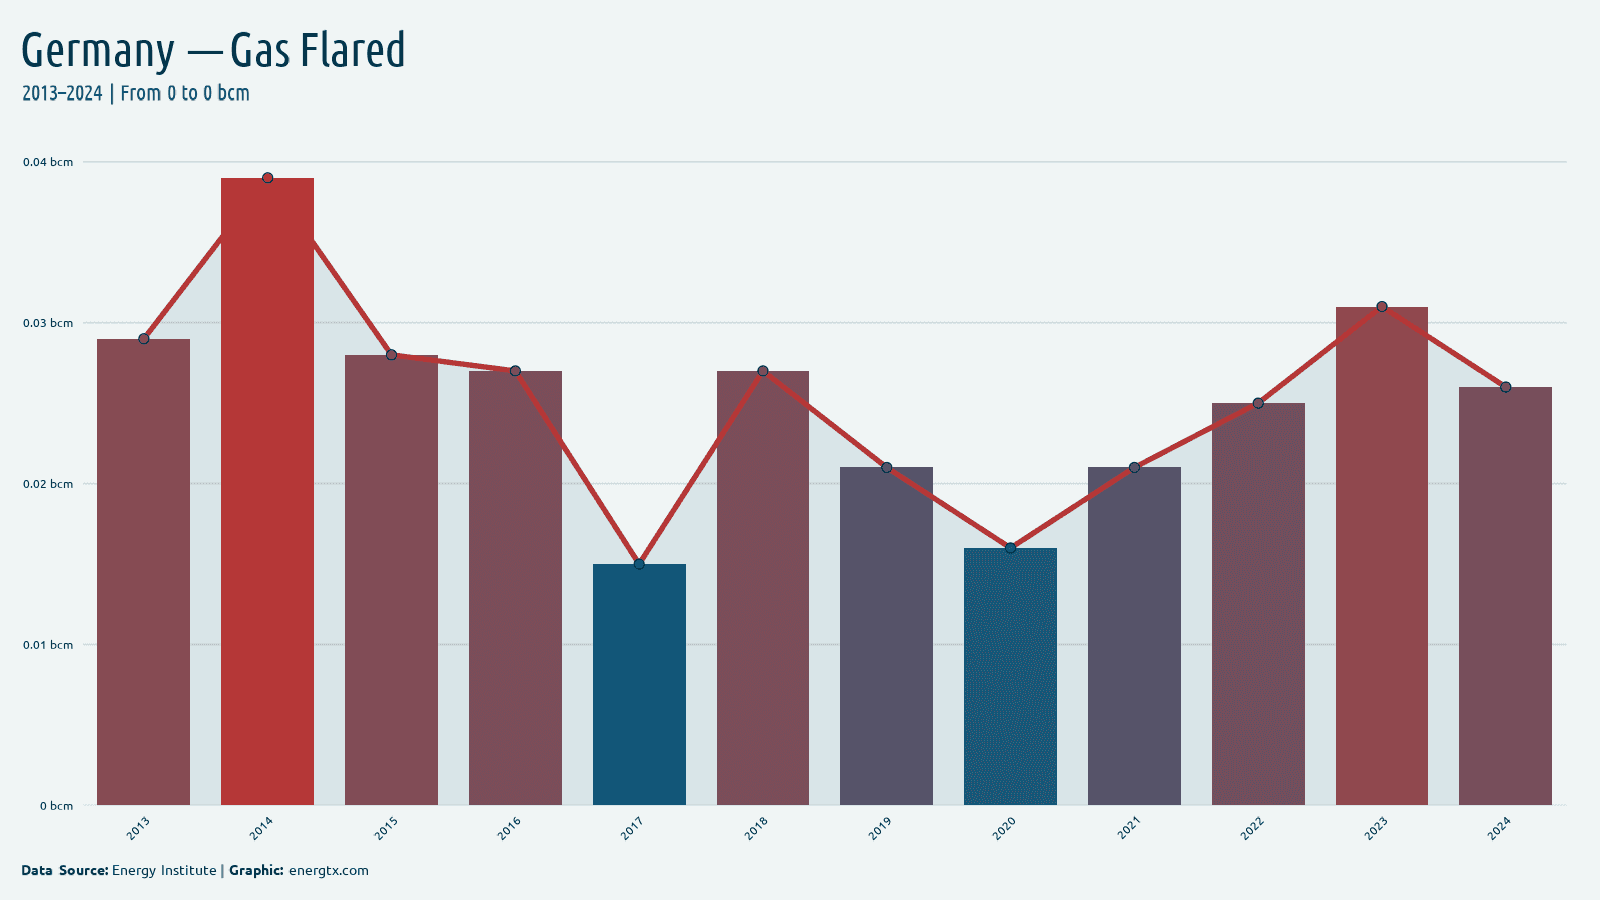
2024
Gas Flared
0.0
bcm
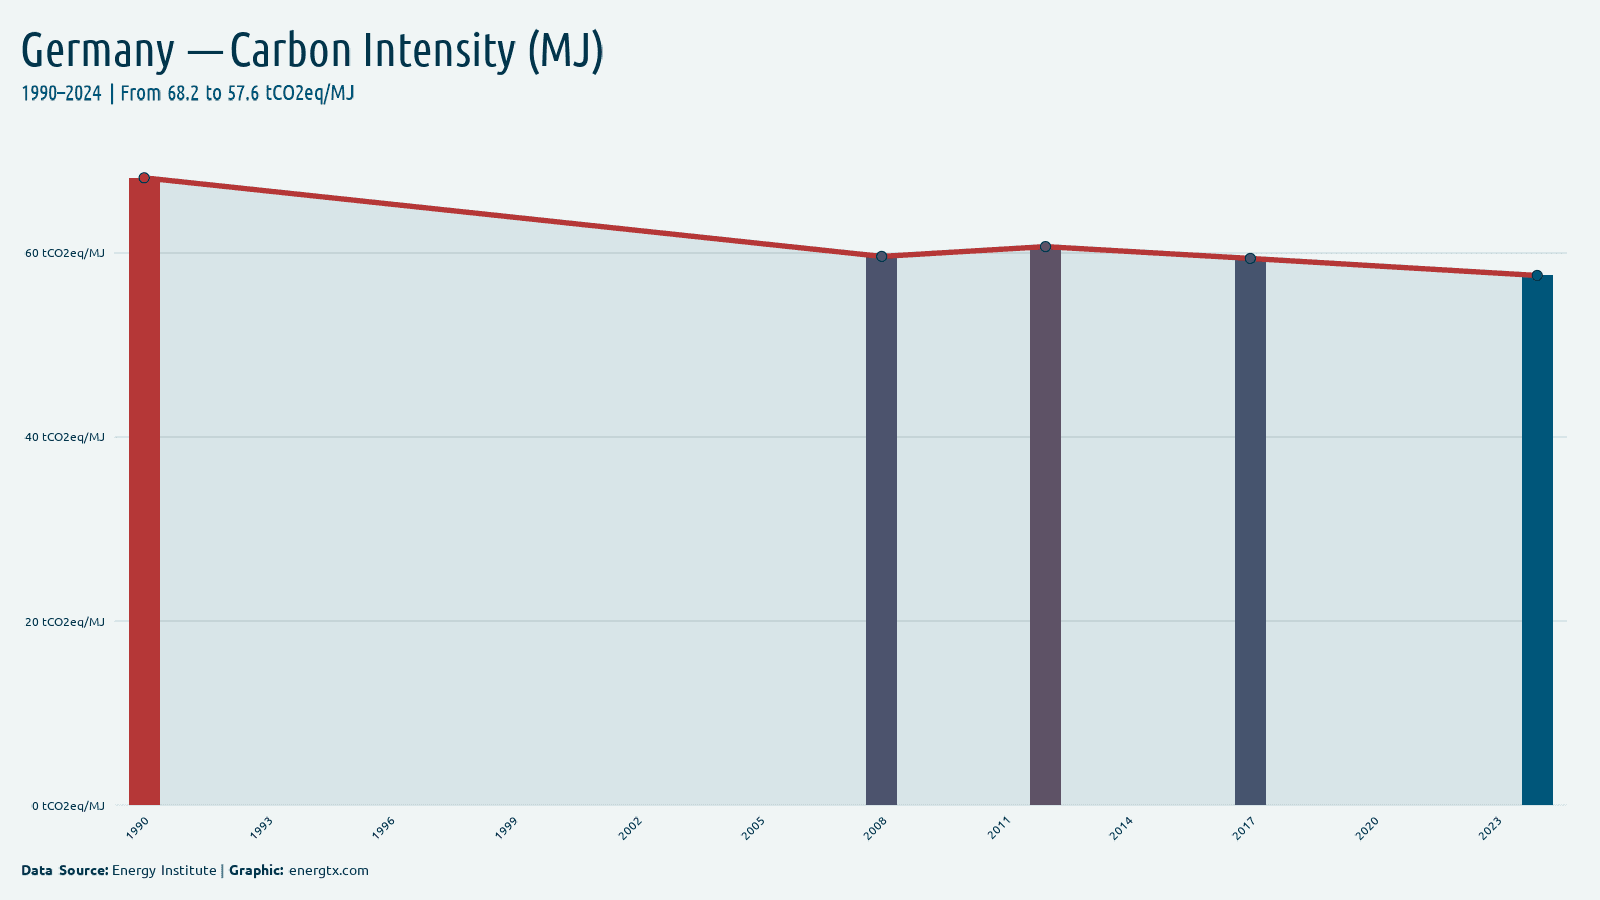
2024
Carbon Intensity (MJ)
57.6
tCO2eq/MJ
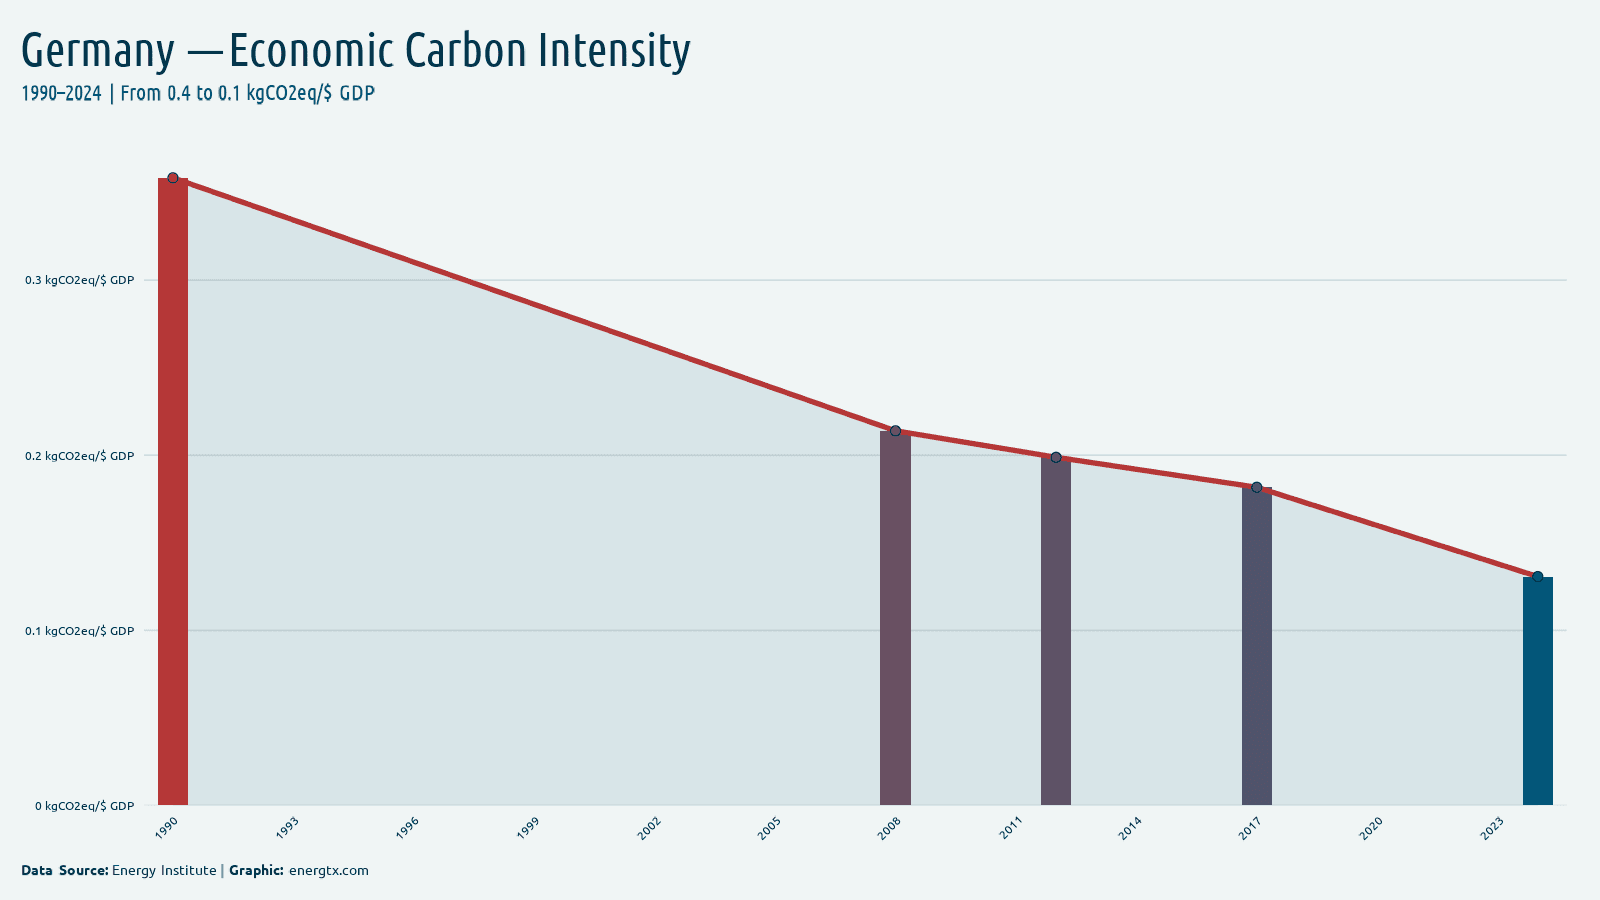
2024
Economic Carbon Intensity
0.1
kgCO2eq/$ GDP
2024
Petroleum Consumption
2.1k
k barrels/day
2024
Petroleum Production
182.2
k barrels/day
2024
Crude Oil Production
28.7
k barrels/day
2024
Motor Gasoline
475.1
k barrels/day
2024
Jet Fuel
194.6
k barrels/day
2024
Distillate Fuel
913.1
k barrels/day
2024
LPG
102.3
k barrels/day
2024
Gas Production (BCF)
145.8
billion cubic feet
2024
Gas Consumption (BCF)
2.7k
billion cubic feet
2024
Gas Imports
2.6k
billion cubic feet
2024
Gas Exports
0.0
billion cubic feet
2024
Coal Production (TST)
101.3k
thousand short tons
2024
Coal Consumption (TST)
132.9k
thousand short tons
2024
Coal Imports
33.6k
thousand short tons
2024
Coal Exports
2.1k
thousand short tons
2023
Coal Reserves
39.0k
million short tons
2024
Elec. Generation (EIA)
490.2
billion kWh
2024
Elec. Consumption (EIA)
490.4
billion kWh
2024
Elec. Capacity
287.4
GW
2024
Elec. Imports
81.7
billion kWh
2024
Elec. Exports
55.4
billion kWh
2024
Elec. Losses
26.1
billion kWh
2024
Nuclear Capacity
0.0
GW
2024
Nuclear Generation (EIA)
0.0
billion kWh
2024
Fossil Capacity
100.0
GW
2024
Fossil Generation
214.1
billion kWh
2024
Renewable Capacity
177.9
GW
2024
Renewable Generation (EIA)
279.3
billion kWh
2024
Hydro Capacity
5.1
GW
2024
Hydro Generation
23.1
billion kWh
2024
Solar Capacity (EIA)
89.9
GW
2024
Solar Generation (EIA)
72.4
billion kWh
2024
Wind Capacity (EIA)
72.8
GW
2024
Wind Generation (EIA)
134.3
billion kWh
2024
Geothermal Capacity
0.0
GW
2024
Geothermal Generation
0.1
billion kWh
2024
Biomass Capacity
10.0
GW
2024
Biomass Generation
49.4
billion kWh
2023
Primary Energy Production
76.9
Mtoe
2023
Primary Energy Consumption (EIA)
256.6
Mtoe
2023
CO2 from Coal
163.4
million metric tonnes CO2
2023
CO2 from Petroleum
277.7
million metric tonnes CO2
2023
Energy Per Capita (Btu)
122.2
million Btu/person
2023
Energy Intensity (Btu/USD)
2.3
thousand Btu/USD PPP
2023
Elec. from Oil
1.0%
%
2023
Elec. from Fossil
43.2%
%
2021
Elec. Renew. (excl. Hydro)
35.6%
%
2021
Renew. excl. Hydro (kWh)
211143200.0k
kWh/capita
2023
T&D Losses
5.0%
%
2023
Net Energy Imports
70.5%
%
2023
Fossil Fuel Share
0.0%
%
2023
Renewables & Waste
12.6%
%
2023
Alt. & Nuclear Energy
9.2%
%
2022
Energy Intensity (MJ/GDP)
2.5
MJ/$ GDP
2023
Elec. from Nuclear
1.4%
%
2021
Final Energy (PJ)
8.3k
PJ
2022
Renew. Capacity/Capita
1.8k
watts/capita
2025
Crude oil closing stocks — JODI (thousand barrels)
138.8k
KBBL
2025
Crude oil production — JODI (thousand barrels/day)
31.6
k barrels/day
2025
Refinery crude intake — JODI (thousand barrels/day)
1.7k
k barrels/day
2025
Crude oil exports — JODI (thousand barrels/day)
0.0
k barrels/day
2025
Crude oil imports — JODI (thousand barrels/day)
1.6k
k barrels/day
2025
Diesel demand — JODI (thousand barrels/day)
915.1
k barrels/day
2025
Gasoline demand — JODI (thousand barrels/day)
475.9
k barrels/day
2025
Kerosene demand — JODI (thousand barrels/day)
192.6
k barrels/day
2025
LPG demand — JODI (thousand barrels/day)
99.1
k barrels/day
2025
Fuel oil demand — JODI (thousand barrels/day)
50.0
k barrels/day
2025
Oil products closing stocks — JODI (thousand barrels)
117.6k
KBBL
2025
Refinery output — JODI (thousand barrels/day)
2.0k
k barrels/day
2025
Total oil products demand — JODI (thousand barrels/day)
2.2k
k barrels/day
2025
Oil products exports — JODI (thousand barrels/day)
543.4
k barrels/day
2025
Oil products imports — JODI (thousand barrels/day)
700.0
k barrels/day
2025
Bioenergy Share
10.1%
%
2025
Coal Share
20.6%
%
2025
Gas Share
16.5%
%
2025
Hydro Share
3.9%
%
2025
Nuclear Share
0.0%
%
2025
Other Fossil Share
3.8%
%
2025
Other Renewables Share
0.0%
%
2025
Solar Share
17.9%
%
2025
Wind Share
27.2%
%
2025
GHG Emissions (Total)
818.5
Mt CO2e
2025
GHG Per Capita
9.8
t CO2e/person
2025
Global GHG Share
1.1%
%
2025
GHG from Power
187.5
Mt CO2e
2025
GHG from Transport
147.5
Mt CO2e
2025
GHG from Manufacturing
140.9
Mt CO2e
2025
GHG from Buildings
129.8
Mt CO2e
2025
GHG from Agriculture
83.7
Mt CO2e
2025
GHG from Fossil Ops
40.6
Mt CO2e
2025
GHG from Waste
16.0
Mt CO2e
2025
GHG from Land Use
62.0
Mt CO2e
2023
Effective carbon rate (€/tCO2)
109.1
€/tCO2
2023
Net effective carbon rate (€/tCO2)
100.2
€/tCO2
Charts


Trends Over Time
Electricity Consumption (per capita)kWh/capita
Dataset
| Indicator | Year | Value | Unit | Source |
|---|---|---|---|---|
| Electricity Access | 2023 | 100.0% | % | World Bank |
| Electricity Access | 2022 | 100.0% | % | World Bank |
| Electricity Access | 2021 | 100.0% | % | World Bank |
| Electricity Access | 2020 | 100.0% | % | World Bank |
| Electricity Access | 2019 | 100.0% | % | World Bank |
| Electricity Access | 2018 | 100.0% | % | World Bank |
| Electricity Access | 2017 | 100.0% | % | World Bank |
| Electricity Access | 2016 | 100.0% | % | World Bank |
| Electricity Access | 2015 | 100.0% | % | World Bank |
| Electricity Access | 2014 | 100.0% | % | World Bank |
| Electricity Access | 2013 | 100.0% | % | World Bank |
| Electricity Access | 2012 | 100.0% | % | World Bank |
| Electricity Access | 2011 | 100.0% | % | World Bank |
| Electricity Access | 2010 | 100.0% | % | World Bank |
| Electricity Access | 2009 | 100.0% | % | World Bank |
| Electricity Access | 2008 | 100.0% | % | World Bank |
| Electricity Access | 2007 | 100.0% | % | World Bank |
| Electricity Access | 2006 | 100.0% | % | World Bank |
| Electricity Access | 2005 | 100.0% | % | World Bank |
| Electricity Access | 2004 | 100.0% | % | World Bank |
| Electricity Access | 2003 | 100.0% | % | World Bank |
| Electricity Access | 2002 | 100.0% | % | World Bank |
| Electricity Access | 2001 | 100.0% | % | World Bank |
| Electricity Access | 2000 | 100.0% | % | World Bank |
| Electricity Access | 1999 | 100.0% | % | World Bank |
| Electricity Access | 1998 | 100.0% | % | World Bank |
| Electricity Access | 1997 | 100.0% | % | World Bank |
| Electricity Access | 1996 | 100.0% | % | World Bank |
| Electricity Access | 1995 | 100.0% | % | World Bank |
| Electricity Access | 1994 | 100.0% | % | World Bank |
| Electricity Access | 1993 | 100.0% | % | World Bank |
| Electricity Access | 1992 | 100.0% | % | World Bank |
| Electricity Access | 1991 | 100.0% | % | World Bank |
| Electricity Access | 1990 | 100.0% | % | World Bank |
| Alt. & Nuclear Energy | 2023 | 9.2% | % | World Bank |
| Alt. & Nuclear Energy | 2022 | 10.2% | % | World Bank |
| Alt. & Nuclear Energy | 2021 | 12.1% | % | World Bank |
| Alt. & Nuclear Energy | 2020 | 12.6% | % | World Bank |
| Alt. & Nuclear Energy | 2019 | 12.5% | % | World Bank |
| Alt. & Nuclear Energy | 2018 | 11.7% | % | World Bank |
| Alt. & Nuclear Energy | 2017 | 11.3% | % | World Bank |
| Alt. & Nuclear Energy | 2016 | 11.3% | % | World Bank |
| Alt. & Nuclear Energy | 2015 | 11.9% | % | World Bank |
| Alt. & Nuclear Energy | 2014 | 11.7% | % | World Bank |
| Alt. & Nuclear Energy | 2013 | 11.0% | % | World Bank |
| Alt. & Nuclear Energy | 2012 | 11.2% | % | World Bank |
| Alt. & Nuclear Energy | 2011 | 11.6% | % | World Bank |
| Alt. & Nuclear Energy | 2010 | 13.1% | % | World Bank |
| Alt. & Nuclear Energy | 2009 | 13.2% | % | World Bank |
| Alt. & Nuclear Energy | 2008 | 13.4% | % | World Bank |
| Alt. & Nuclear Energy | 2007 | 12.9% | % | World Bank |
| Alt. & Nuclear Energy | 2006 | 13.9% | % | World Bank |
| Alt. & Nuclear Energy | 2005 | 13.9% | % | World Bank |
| Alt. & Nuclear Energy | 2004 | 14.0% | % | World Bank |
| Alt. & Nuclear Energy | 2003 | 13.8% | % | World Bank |
| Alt. & Nuclear Energy | 2002 | 13.7% | % | World Bank |
| Alt. & Nuclear Energy | 2001 | 13.7% | % | World Bank |
| Alt. & Nuclear Energy | 2000 | 14.0% | % | World Bank |
| Alt. & Nuclear Energy | 1999 | 13.9% | % | World Bank |
| Alt. & Nuclear Energy | 1998 | 12.9% | % | World Bank |
| Alt. & Nuclear Energy | 1997 | 13.4% | % | World Bank |
| Alt. & Nuclear Energy | 1996 | 12.6% | % | World Bank |
| Alt. & Nuclear Energy | 1995 | 12.5% | % | World Bank |
| Alt. & Nuclear Energy | 1994 | 12.4% | % | World Bank |
| Alt. & Nuclear Energy | 1993 | 12.4% | % | World Bank |
| Alt. & Nuclear Energy | 1992 | 12.7% | % | World Bank |
| Alt. & Nuclear Energy | 1991 | 11.5% | % | World Bank |
| Alt. & Nuclear Energy | 1990 | 11.8% | % | World Bank |
| Biofuels Consumption | 2024 | 110.1 | PJ | Energy Institute |
| Biofuels Consumption | 2023 | 129.7 | PJ | Energy Institute |
| Biofuels Consumption | 2022 | 125.8 | PJ | Energy Institute |
| Biofuels Consumption | 2021 | 125.6 | PJ | Energy Institute |
| Biofuels Consumption | 2020 | 141.4 | PJ | Energy Institute |
| Biofuels Consumption | 2019 | 115.8 | PJ | Energy Institute |
| Biofuels Consumption | 2018 | 117.8 | PJ | Energy Institute |
| Biofuels Consumption | 2017 | 113.0 | PJ | Energy Institute |
| Biofuels Consumption | 2016 | 111.1 | PJ | Energy Institute |
| Biofuels Consumption | 2015 | 110.8 | PJ | Energy Institute |
| Biofuels Consumption | 2014 | 118.2 | PJ | Energy Institute |
| Biofuels Consumption | 2013 | 112.7 | PJ | Energy Institute |
| Biofuels Consumption | 2012 | 126.0 | PJ | Energy Institute |
| Biofuels Consumption | 2011 | 118.3 | PJ | Energy Institute |
| Biofuels Consumption | 2010 | 113.6 | PJ | Energy Institute |
| Biofuels Consumption | 2009 | 113.4 | PJ | Energy Institute |
| Biofuels Consumption | 2008 | 114.2 | PJ | Energy Institute |
| Biofuels Consumption | 2007 | 130.1 | PJ | Energy Institute |
| Biofuels Consumption | 2006 | 114.5 | PJ | Energy Institute |
| Biofuels Consumption | 2005 | 71.8 | PJ | Energy Institute |
| Biofuels Consumption | 2004 | 38.9 | PJ | Energy Institute |
| Biofuels Consumption | 2003 | 29.2 | PJ | Energy Institute |
| Biofuels Consumption | 2002 | 20.3 | PJ | Energy Institute |
| Biofuels Consumption | 2001 | 12.9 | PJ | Energy Institute |
| Biofuels Consumption | 2000 | 9.2 | PJ | Energy Institute |
| Biofuels Consumption | 1999 | 4.8 | PJ | Energy Institute |
| Biofuels Consumption | 1998 | 3.7 | PJ | Energy Institute |
| Biofuels Consumption | 1997 | 3.3 | PJ | Energy Institute |
| Biofuels Consumption | 1996 | 2.0 | PJ | Energy Institute |
| Biofuels Consumption | 1995 | 1.3 | PJ | Energy Institute |
| Biofuels Consumption | 1994 | 1.0 | PJ | Energy Institute |
| Biofuels Consumption | 1993 | 0.2 | PJ | Energy Institute |
| Biofuels Consumption | 1992 | 0.2 | PJ | Energy Institute |
| Biomass Capacity | 2024 | 10.0 | GW | EIA |
| Biomass Capacity | 2023 | 9.9 | GW | EIA |
| Biomass Capacity | 2022 | 9.8 | GW | EIA |
| Biomass Capacity | 2021 | 9.8 | GW | EIA |
| Biomass Capacity | 2020 | 10.3 | GW | EIA |
| Biomass Capacity | 2019 | 10.0 | GW | EIA |
| Biomass Capacity | 2018 | 9.7 | GW | EIA |
| Biomass Capacity | 2017 | 9.0 | GW | EIA |
| Biomass Capacity | 2016 | 8.7 | GW | EIA |
| Biomass Capacity | 2015 | 8.4 | GW | EIA |
| Biomass Capacity | 2014 | 8.2 | GW | EIA |
| Biomass Capacity | 2013 | 8.0 | GW | EIA |
| Biomass Capacity | 2012 | 7.5 | GW | EIA |
| Biomass Capacity | 2011 | 7.2 | GW | EIA |
| Biomass Capacity | 2010 | 6.2 | GW | EIA |
| Biomass Capacity | 2009 | 5.6 | GW | EIA |
| Biomass Capacity | 2008 | 4.4 | GW | EIA |
| Biomass Capacity | 2007 | 4.0 | GW | EIA |
| Biomass Capacity | 2006 | 3.6 | GW | EIA |
| Biomass Capacity | 2005 | 3.0 | GW | EIA |
| Biomass Capacity | 2004 | 2.2 | GW | EIA |
| Biomass Capacity | 2003 | 1.9 | GW | EIA |
| Biomass Capacity | 2002 | 1.2 | GW | EIA |
| Biomass Capacity | 2001 | 1.1 | GW | EIA |
| Biomass Capacity | 2000 | 0.8 | GW | EIA |
| Biomass Generation | 2024 | 49.4 | billion kWh | EIA |
| Biomass Generation | 2023 | 50.6 | billion kWh | EIA |
| Biomass Generation | 2022 | 58.8 | billion kWh | EIA |
| Biomass Generation | 2021 | 57.1 | billion kWh | EIA |
| Biomass Generation | 2020 | 57.4 | billion kWh | EIA |
| Biomass Generation | 2019 | 56.9 | billion kWh | EIA |
| Biomass Generation | 2018 | 57.9 | billion kWh | EIA |
| Biomass Generation | 2017 | 58.2 | billion kWh | EIA |
| Biomass Generation | 2016 | 58.3 | billion kWh | EIA |
| Biomass Generation | 2015 | 57.4 | billion kWh | EIA |
| Biomass Generation | 2014 | 55.7 | billion kWh | EIA |
| Biomass Generation | 2013 | 52.1 | billion kWh | EIA |
| Biomass Generation | 2012 | 49.8 | billion kWh | EIA |
| Biomass Generation | 2011 | 43.3 | billion kWh | EIA |
| Biomass Generation | 2010 | 40.3 | billion kWh | EIA |
| Biomass Generation | 2009 | 36.2 | billion kWh | EIA |
| Biomass Generation | 2008 | 32.8 | billion kWh | EIA |
| Biomass Generation | 2007 | 28.9 | billion kWh | EIA |
| Biomass Generation | 2006 | 22.6 | billion kWh | EIA |
| Biomass Generation | 2005 | 17.6 | billion kWh | EIA |
| Biomass Generation | 2004 | 12.7 | billion kWh | EIA |
| Biomass Generation | 2003 | 11.1 | billion kWh | EIA |
| Biomass Generation | 2002 | 12.5 | billion kWh | EIA |
| Biomass Generation | 2001 | 12.4 | billion kWh | EIA |
| Biomass Generation | 2000 | 10.1 | billion kWh | EIA |
| Biomass Generation | 1999 | 8.3 | billion kWh | EIA |
| Biomass Generation | 1998 | 9.7 | billion kWh | EIA |
| Biomass Generation | 1997 | 8.3 | billion kWh | EIA |
| Biomass Generation | 1996 | 8.0 | billion kWh | EIA |
| Biomass Generation | 1995 | 7.7 | billion kWh | EIA |
| Biomass Generation | 1994 | 7.2 | billion kWh | EIA |
| Biomass Generation | 1993 | 6.2 | billion kWh | EIA |
| Biomass Generation | 1992 | 6.2 | billion kWh | EIA |
| Biomass Generation | 1991 | 5.7 | billion kWh | EIA |
| Carbon Intensity (MJ) | 2024 | 57.6 | tCO2eq/MJ | Energy Institute |
| Carbon Intensity (MJ) | 2017 | 59.4 | tCO2eq/MJ | Energy Institute |
| Carbon Intensity (MJ) | 2012 | 60.7 | tCO2eq/MJ | Energy Institute |
| Carbon Intensity (MJ) | 2008 | 59.6 | tCO2eq/MJ | Energy Institute |
| Carbon Intensity (MJ) | 1990 | 68.2 | tCO2eq/MJ | Energy Institute |
| Carbon Intensity | 2024 | 1.4 | tCO2/EJ | Energy Institute |
| Carbon Intensity | 2023 | 1.5 | tCO2/EJ | Energy Institute |
| Carbon Intensity | 2022 | 1.5 | tCO2/EJ | Energy Institute |
| Carbon Intensity | 2021 | 1.5 | tCO2/EJ | Energy Institute |
| Carbon Intensity | 2020 | 1.5 | tCO2/EJ | Energy Institute |
| Carbon Intensity | 2019 | 1.4 | tCO2/EJ | Energy Institute |
| Carbon Intensity | 2018 | 1.4 | tCO2/EJ | Energy Institute |
| Carbon Intensity | 2017 | 1.4 | tCO2/EJ | Energy Institute |
| Carbon Intensity | 2016 | 1.3 | tCO2/EJ | Energy Institute |
| Carbon Intensity | 2015 | 1.3 | tCO2/EJ | Energy Institute |
| Carbon Intensity | 2014 | 1.3 | tCO2/EJ | Energy Institute |
| Carbon Intensity | 2013 | 1.3 | tCO2/EJ | Energy Institute |
| Carbon Intensity | 2012 | 1.4 | tCO2/EJ | Energy Institute |
| Carbon Intensity | 2011 | 1.4 | tCO2/EJ | Energy Institute |
| Carbon Intensity | 2010 | 1.3 | tCO2/EJ | Energy Institute |
| Carbon Intensity | 2009 | 1.4 | tCO2/EJ | Energy Institute |
| Carbon Intensity | 2008 | 1.4 | tCO2/EJ | Energy Institute |
| Carbon Intensity | 2007 | 1.5 | tCO2/EJ | Energy Institute |
| Carbon Intensity | 2006 | 1.3 | tCO2/EJ | Energy Institute |
| Carbon Intensity | 2005 | 1.3 | tCO2/EJ | Energy Institute |
| Carbon Intensity | 2004 | 1.4 | tCO2/EJ | Energy Institute |
| Carbon Intensity | 2003 | 1.4 | tCO2/EJ | Energy Institute |
| Carbon Intensity | 2002 | 1.3 | tCO2/EJ | Energy Institute |
| Carbon Intensity | 2001 | 1.3 | tCO2/EJ | Energy Institute |
| Carbon Intensity | 2000 | 1.5 | tCO2/EJ | Energy Institute |
| Carbon Intensity | 1999 | 1.5 | tCO2/EJ | Energy Institute |
| Carbon Intensity | 1998 | 1.5 | tCO2/EJ | Energy Institute |
| Carbon Intensity | 1997 | 1.4 | tCO2/EJ | Energy Institute |
| Carbon Intensity | 1996 | 1.4 | tCO2/EJ | Energy Institute |
| Carbon Intensity | 1995 | 1.5 | tCO2/EJ | Energy Institute |
| Carbon Intensity | 1994 | 1.4 | tCO2/EJ | Energy Institute |
| Carbon Intensity | 1993 | 1.4 | tCO2/EJ | Energy Institute |
| Carbon Intensity | 1992 | 1.3 | tCO2/EJ | Energy Institute |
| Carbon Intensity | 1991 | 1.3 | tCO2/EJ | Energy Institute |
| Carbon Intensity | 1990 | 1.3 | tCO2/EJ | Energy Institute |
Showing 200 of 3753 records. Download for the full dataset.
Download Germany Data
Found a data error?
Our data is sourced from World Bank, Energy Institute, OWID, OECD, IAEA, GCP, and Eurostat. If you notice an incorrect value, missing data, or any discrepancy for Germany, please let us know so we can investigate and correct it. Include the indicator name, year, and a brief description of the issue.
Report a data error