🇺🇸
United States
11736 records · 152 indicators · 1990–2025
11,736
Data Records
152
Indicators
1990–2025
Time Range
USA
ISO Code
Latest Indicator Values
2023
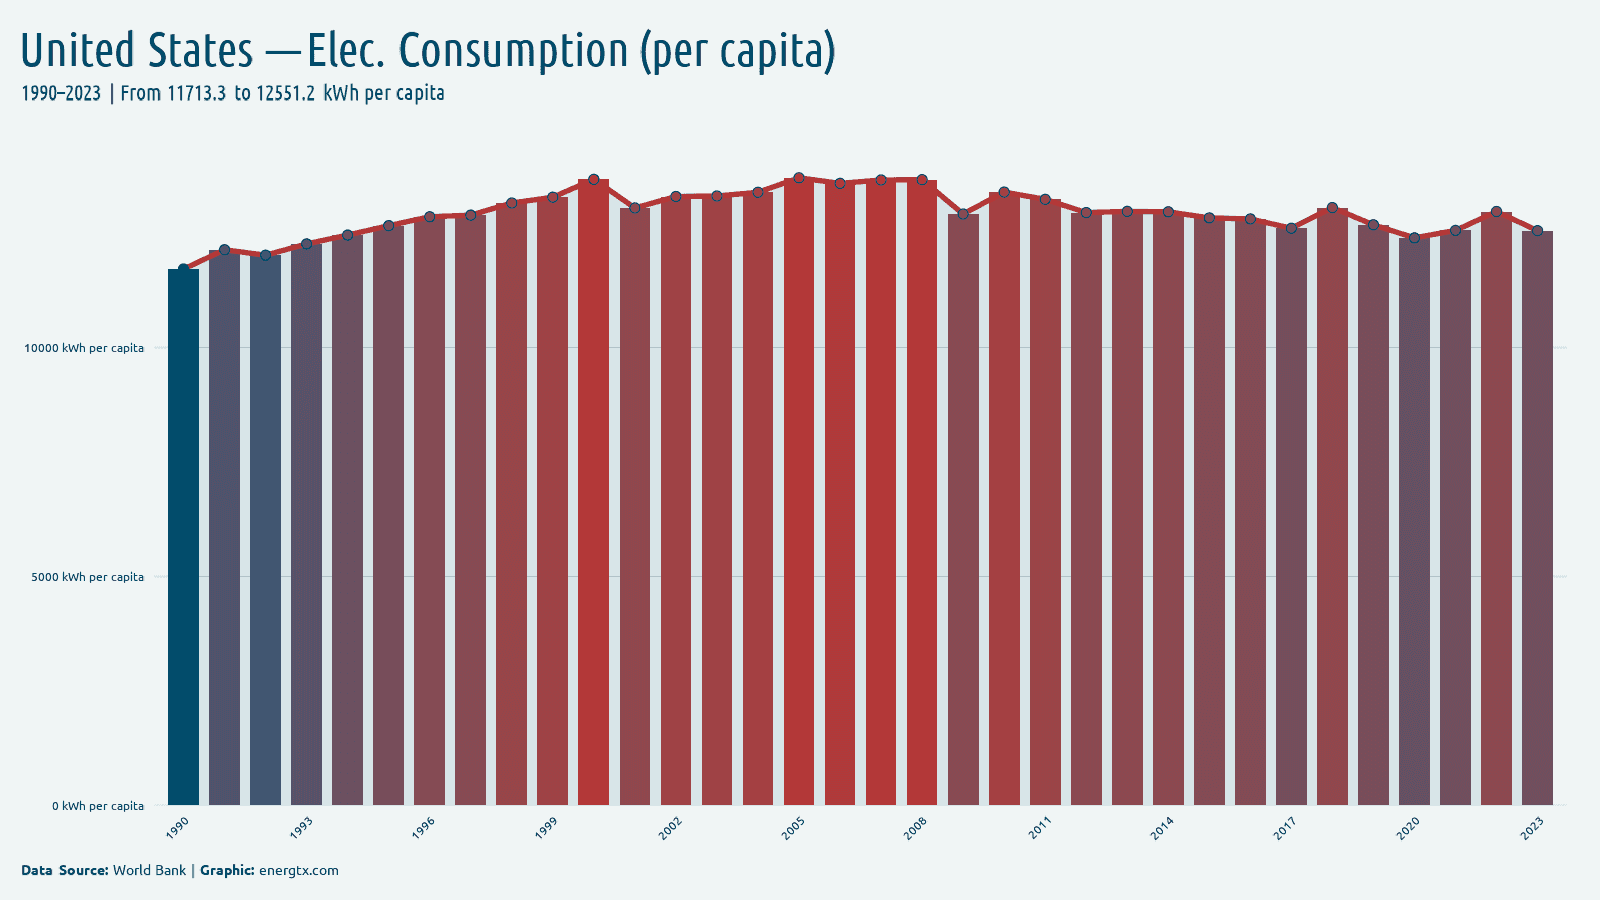
Electricity Consumption (per capita)
12.6k
kWh/capita
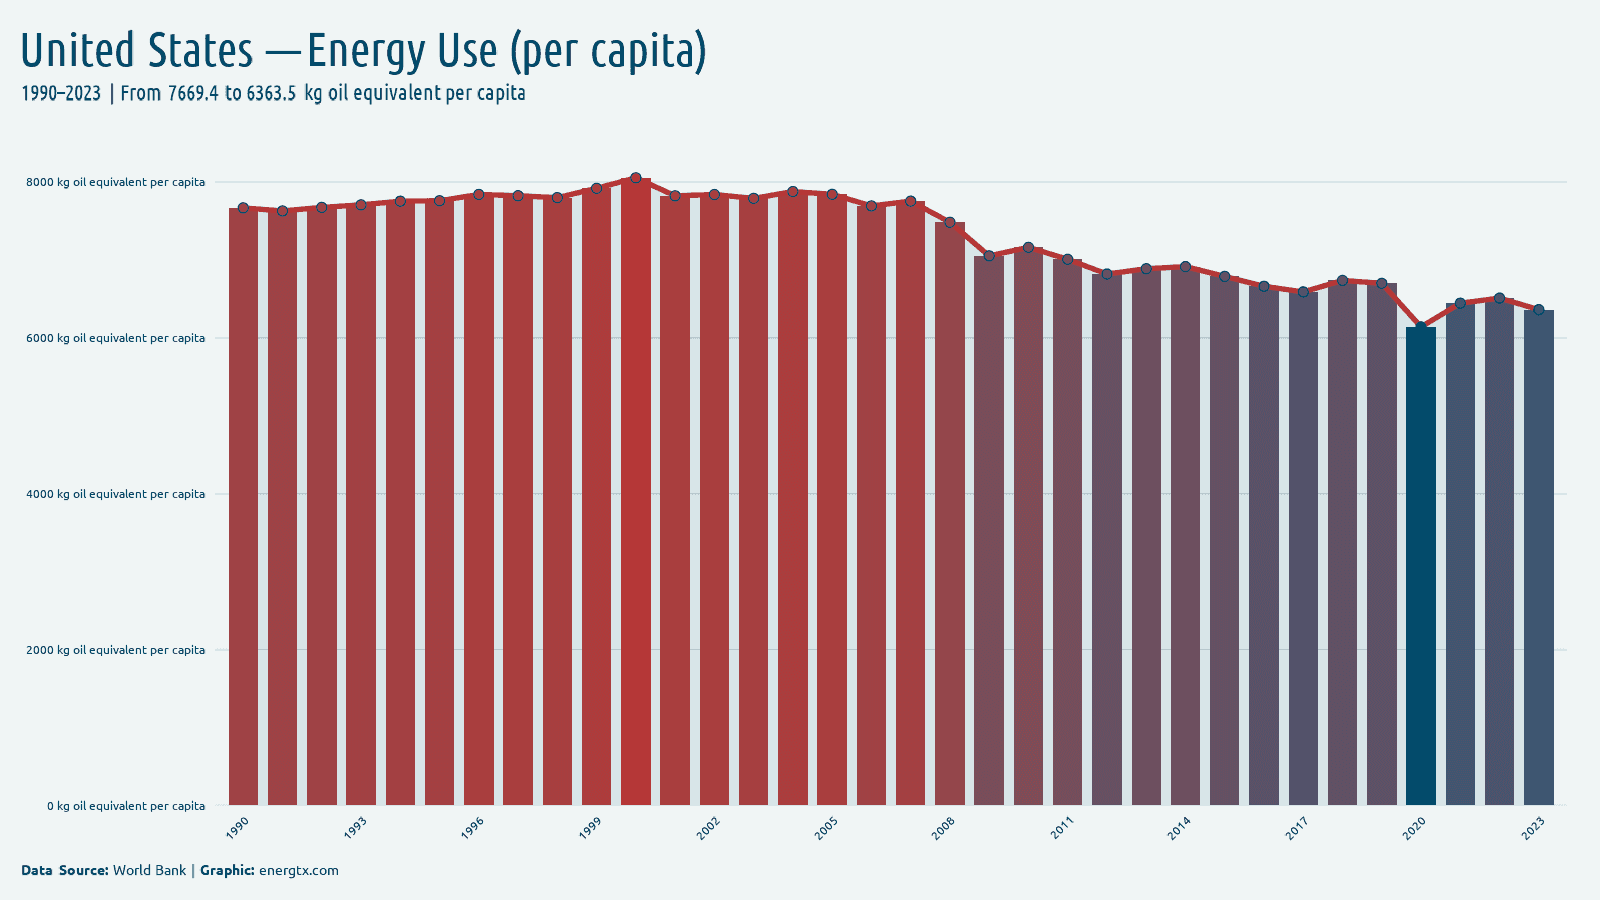
2023
Energy Use (per capita)
6.4k
kg oil eq./capita
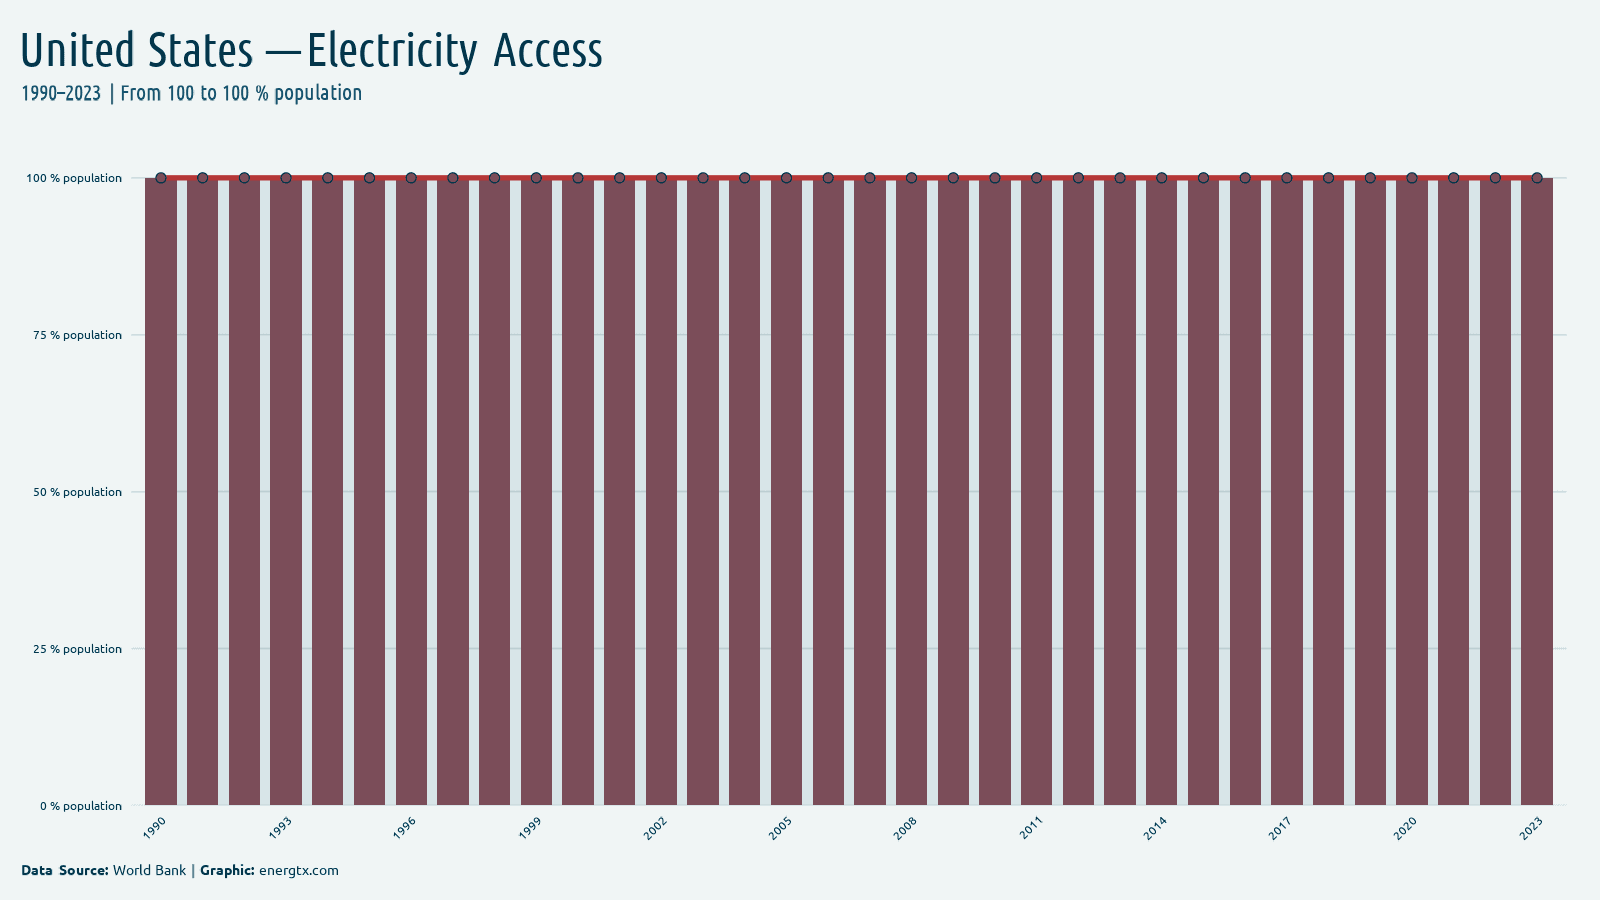
2023
Electricity Access
100.0%
%
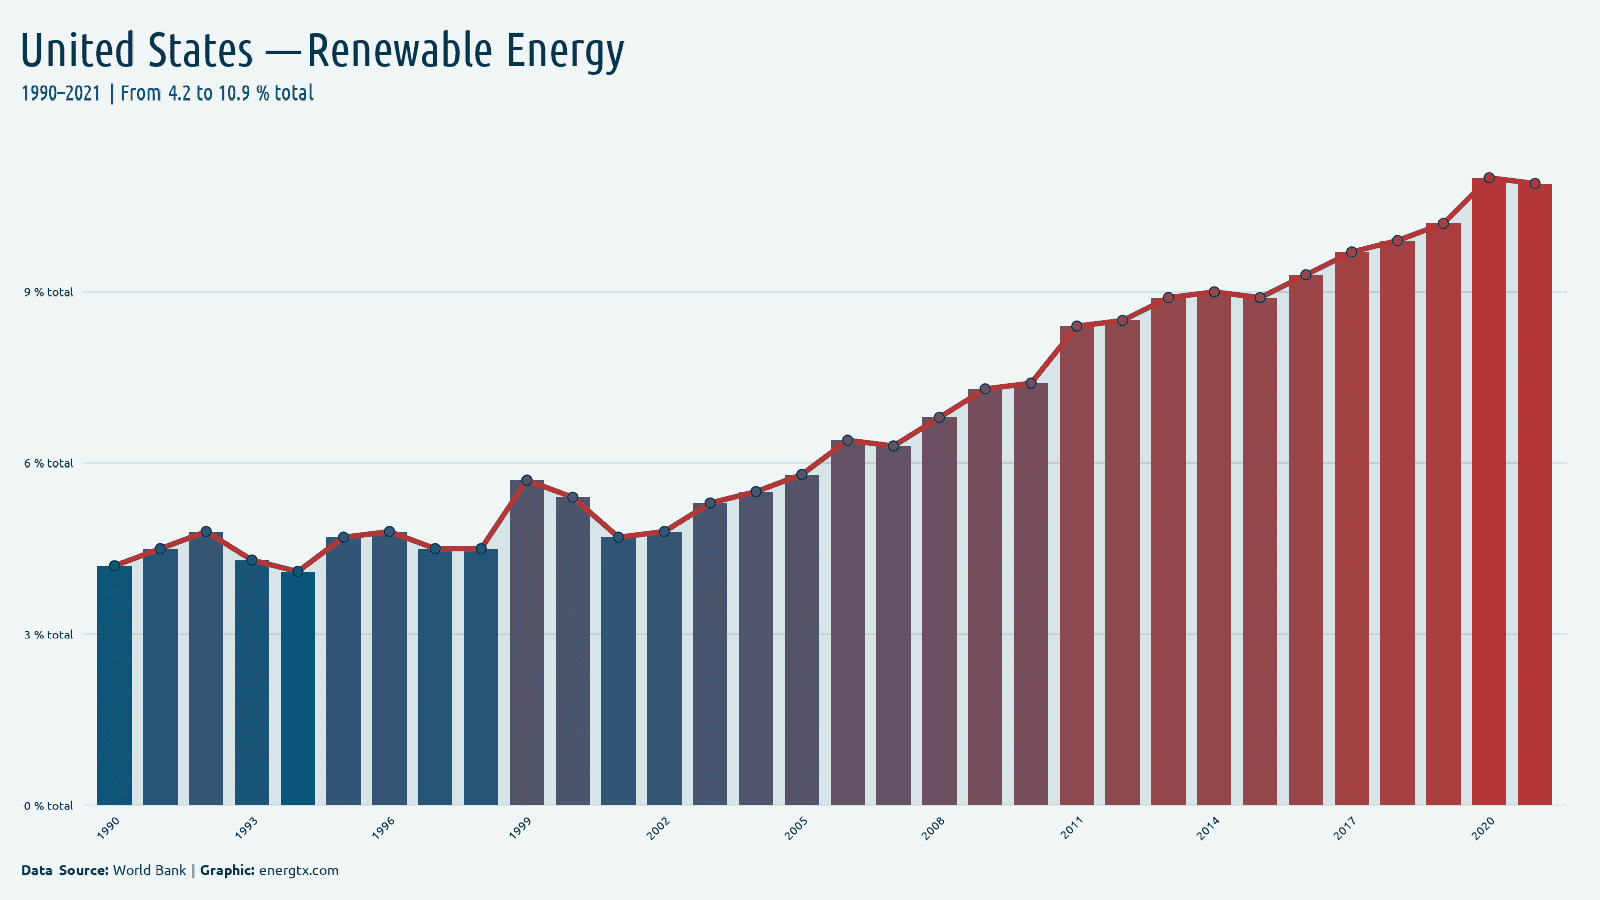
2021
Renewable Energy
10.9%
%
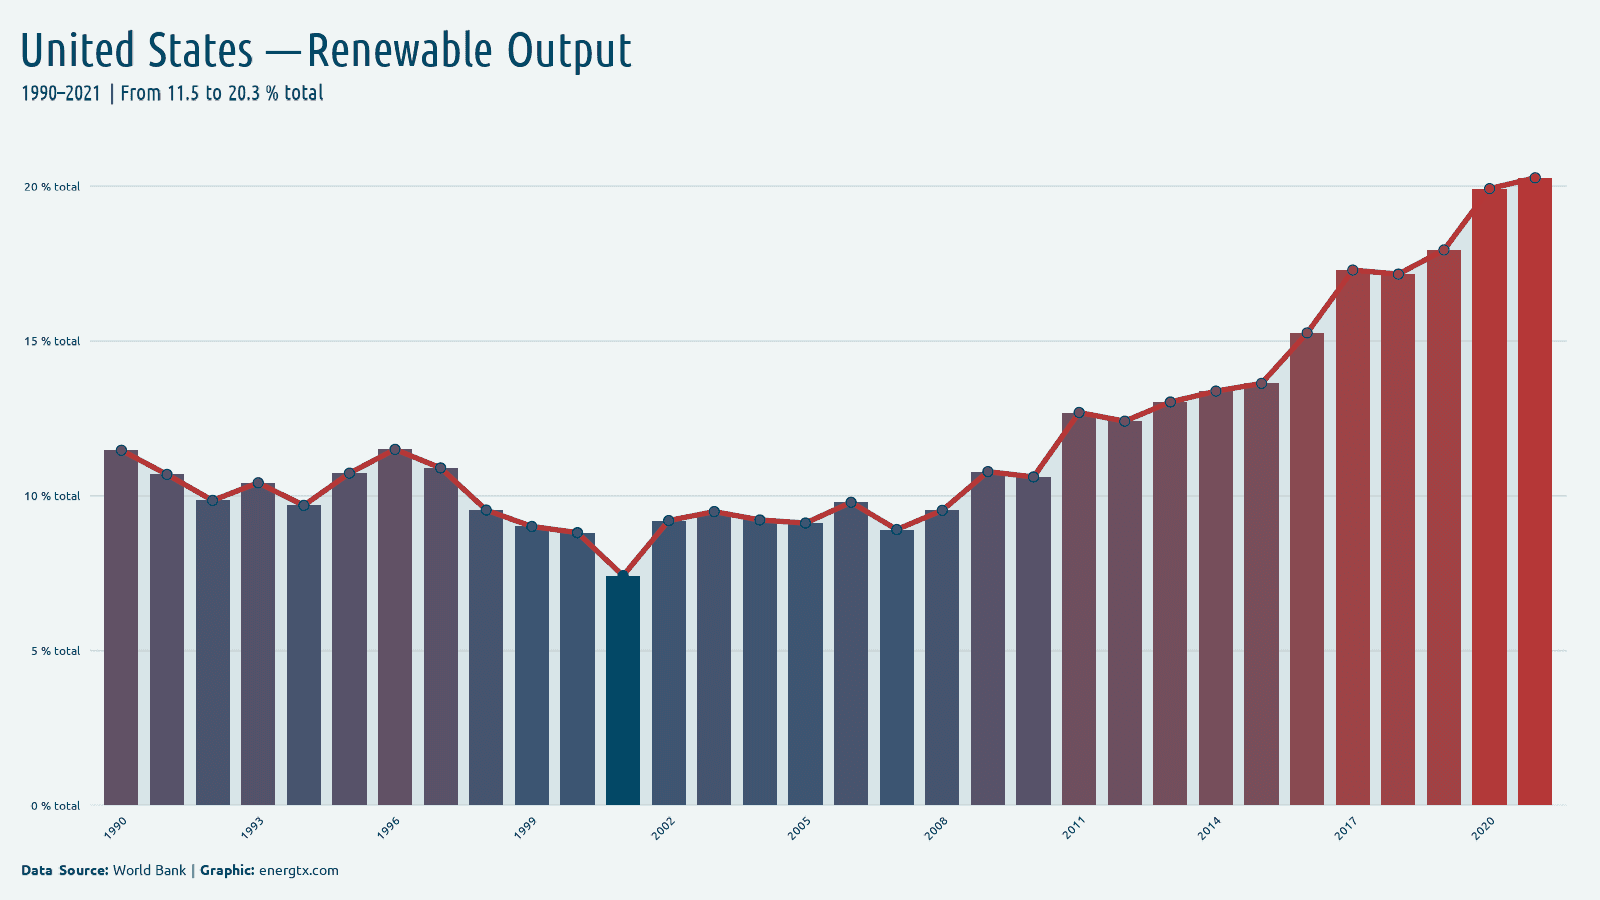
2021
Renewable Output
20.3%
%
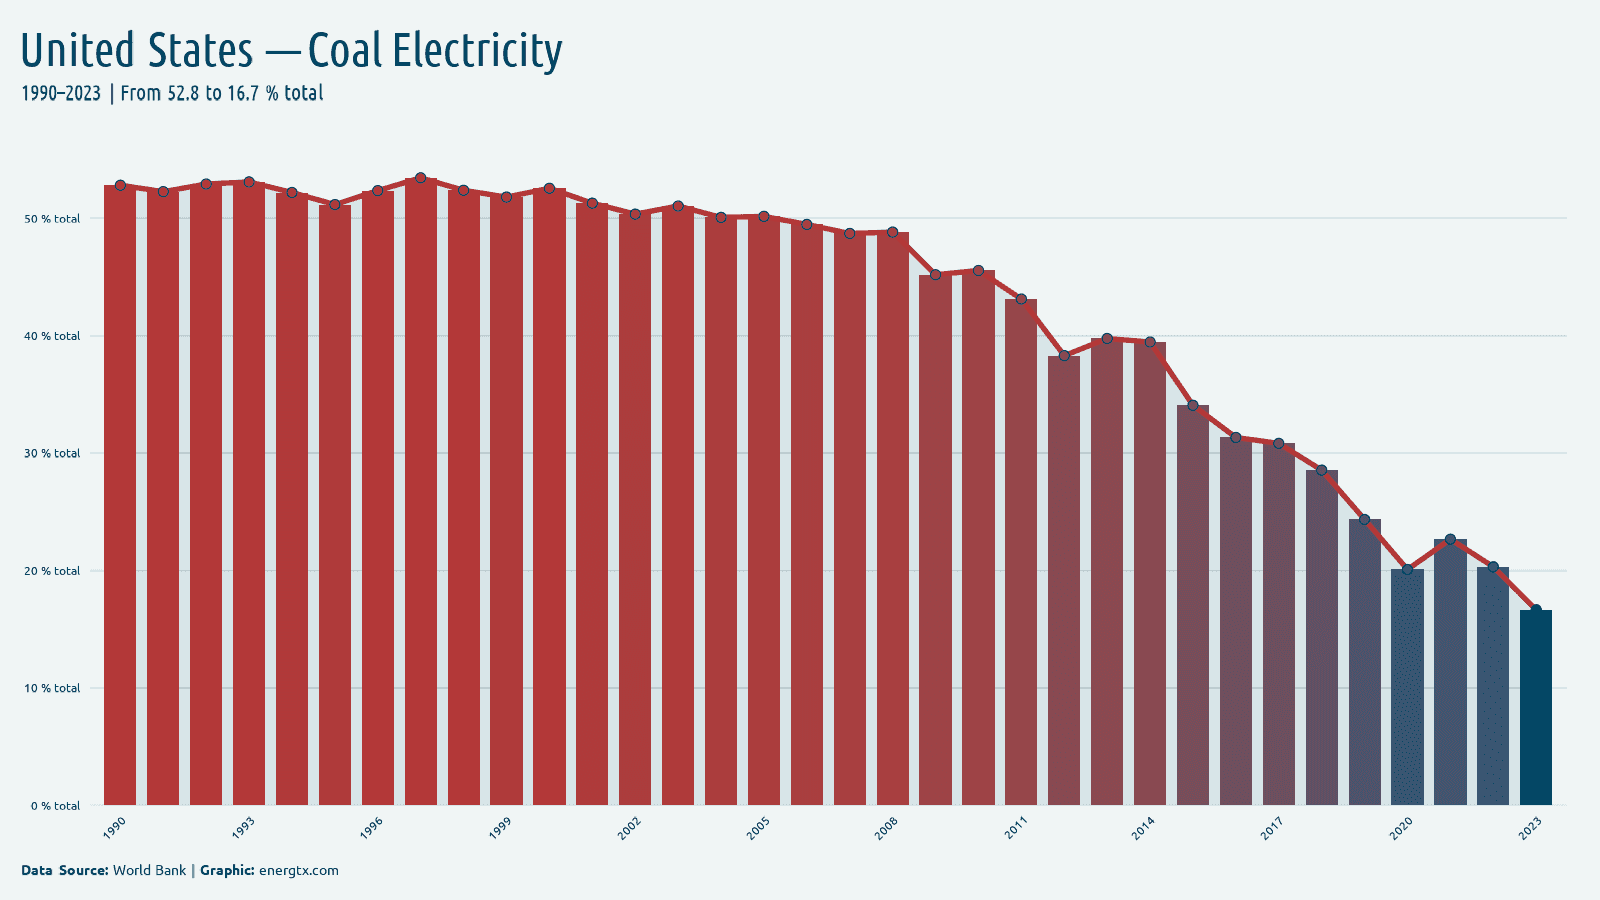
2023
Coal Electricity
16.7%
%
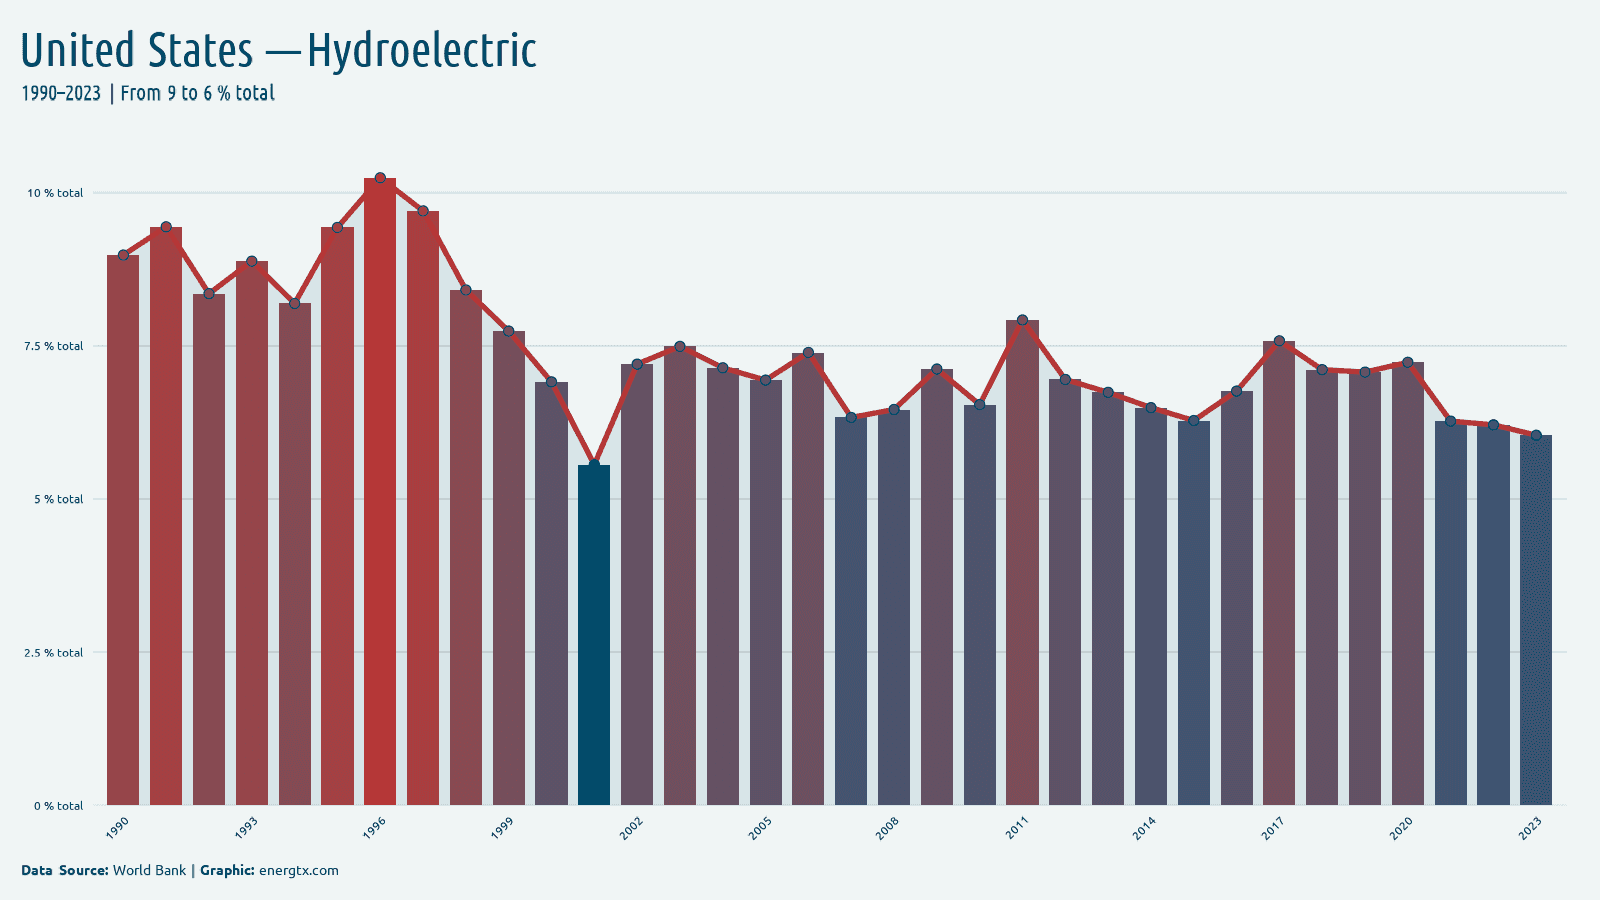
2023
Hydroelectric
6.0%
%
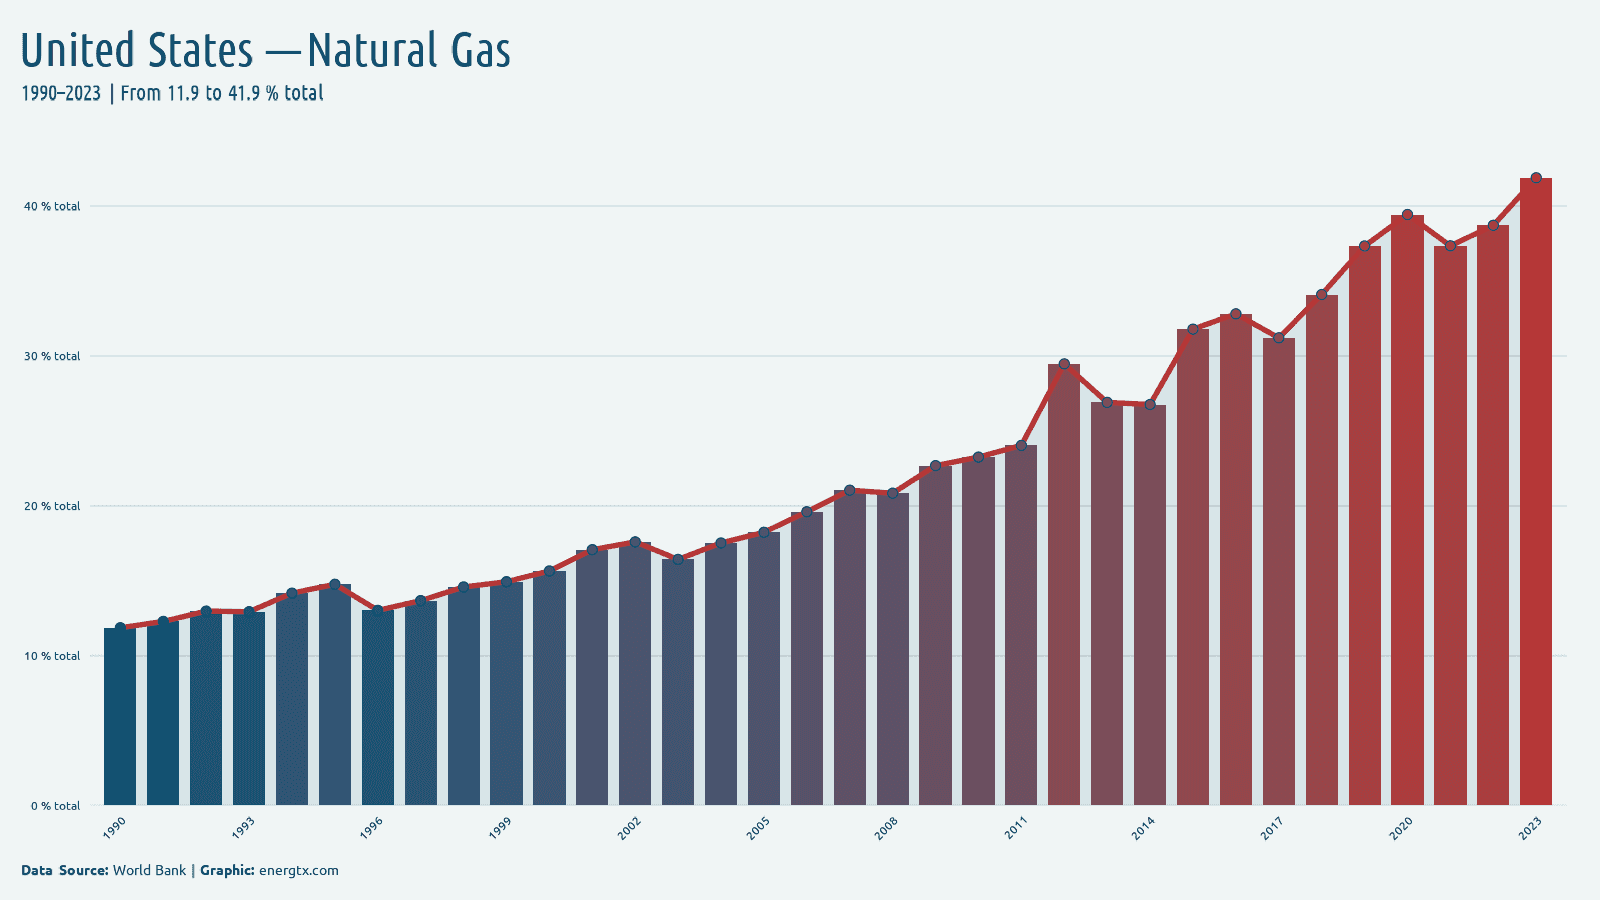
2023
Natural Gas
41.9%
%
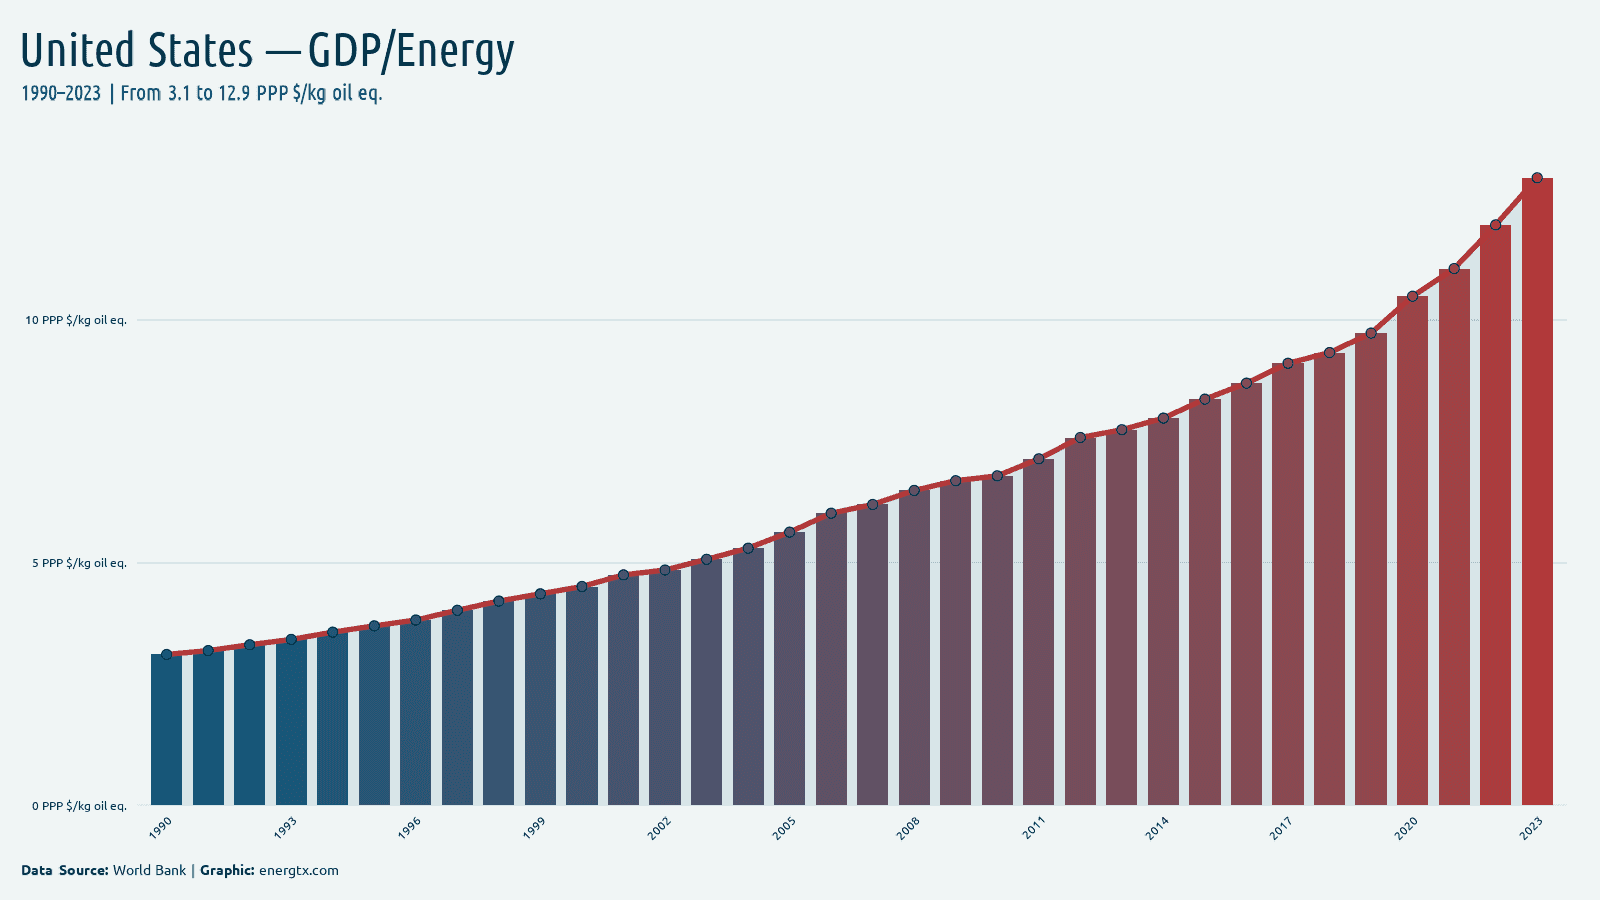
2023
GDP/Energy
12.9
PPP $/kg oil eq.
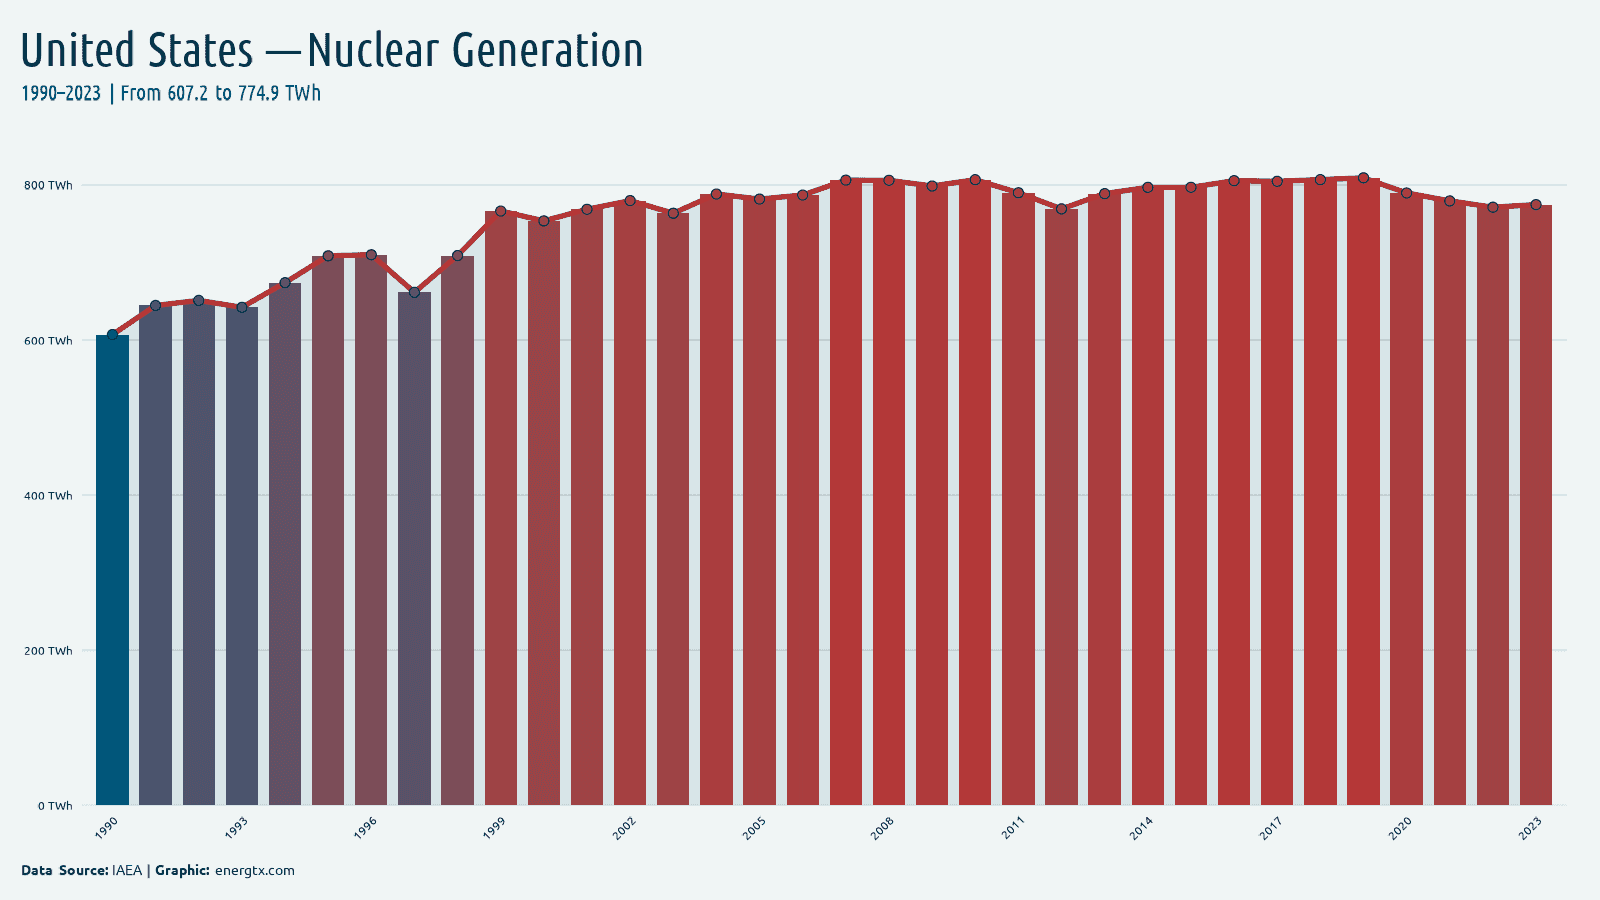
2023
Nuclear Generation
774.9
TWh
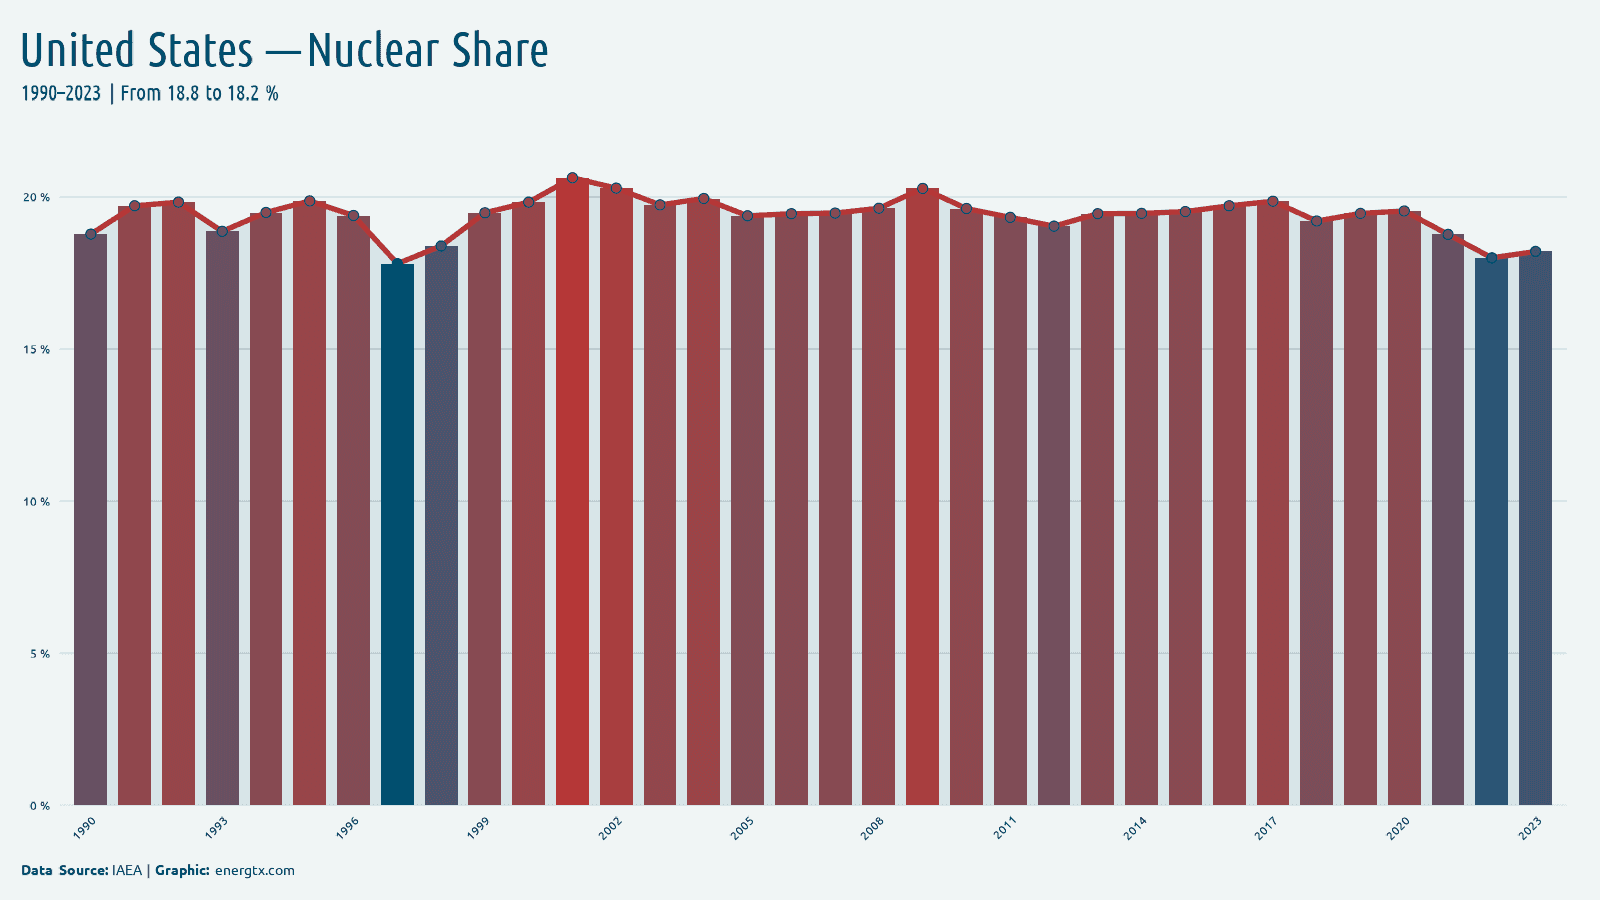
2023
Nuclear Share
18.2%
%
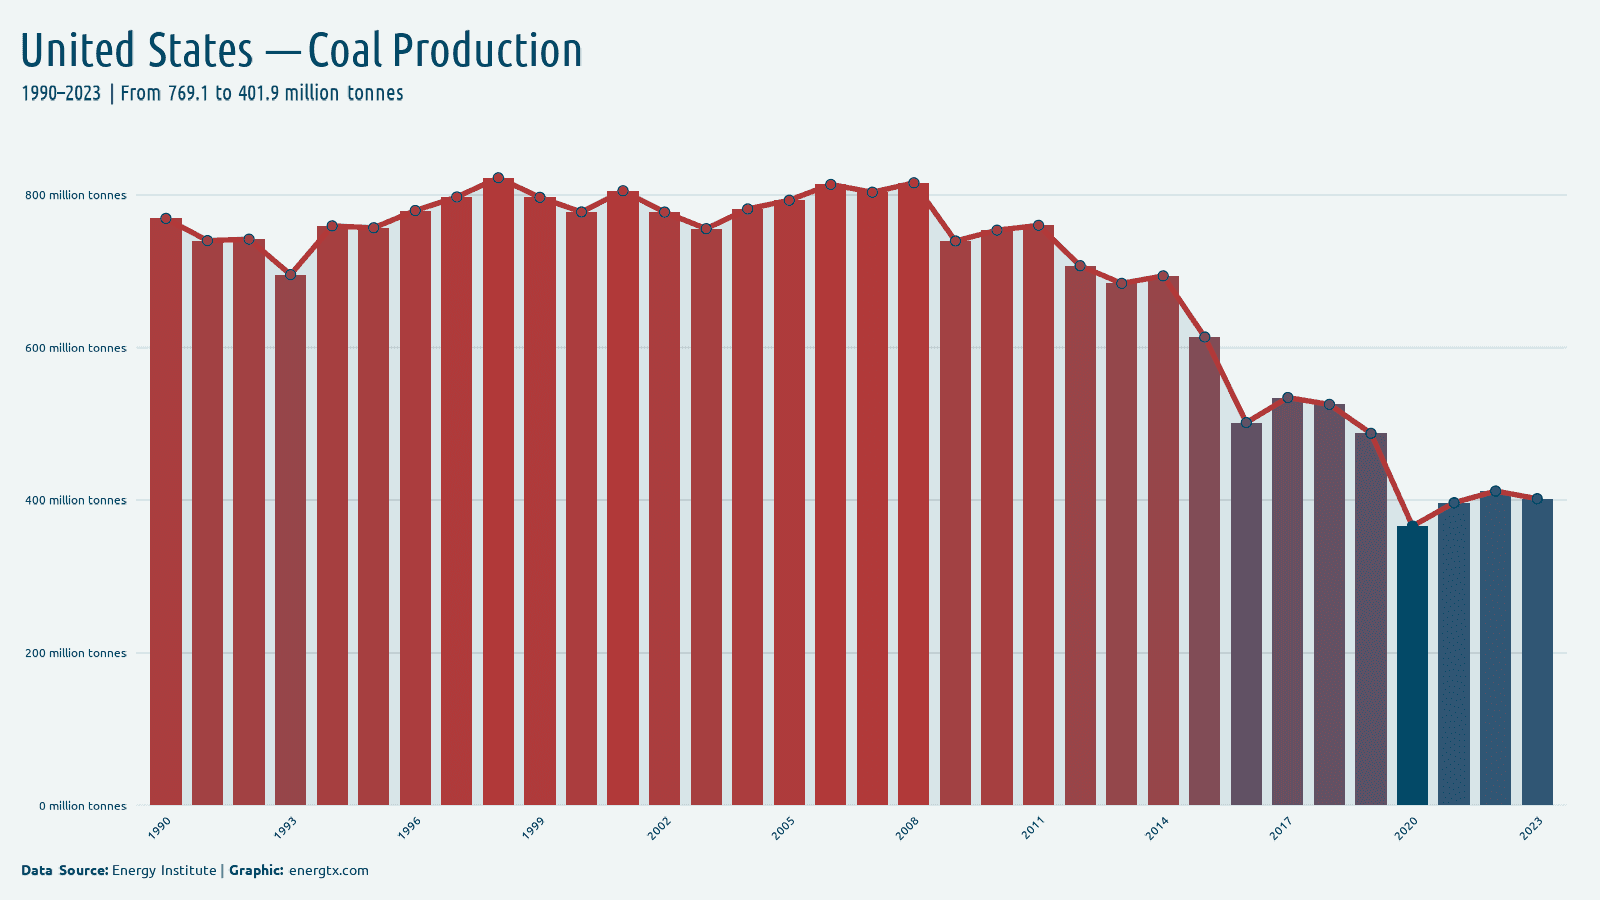
2023
Coal Production
401.9
Mt
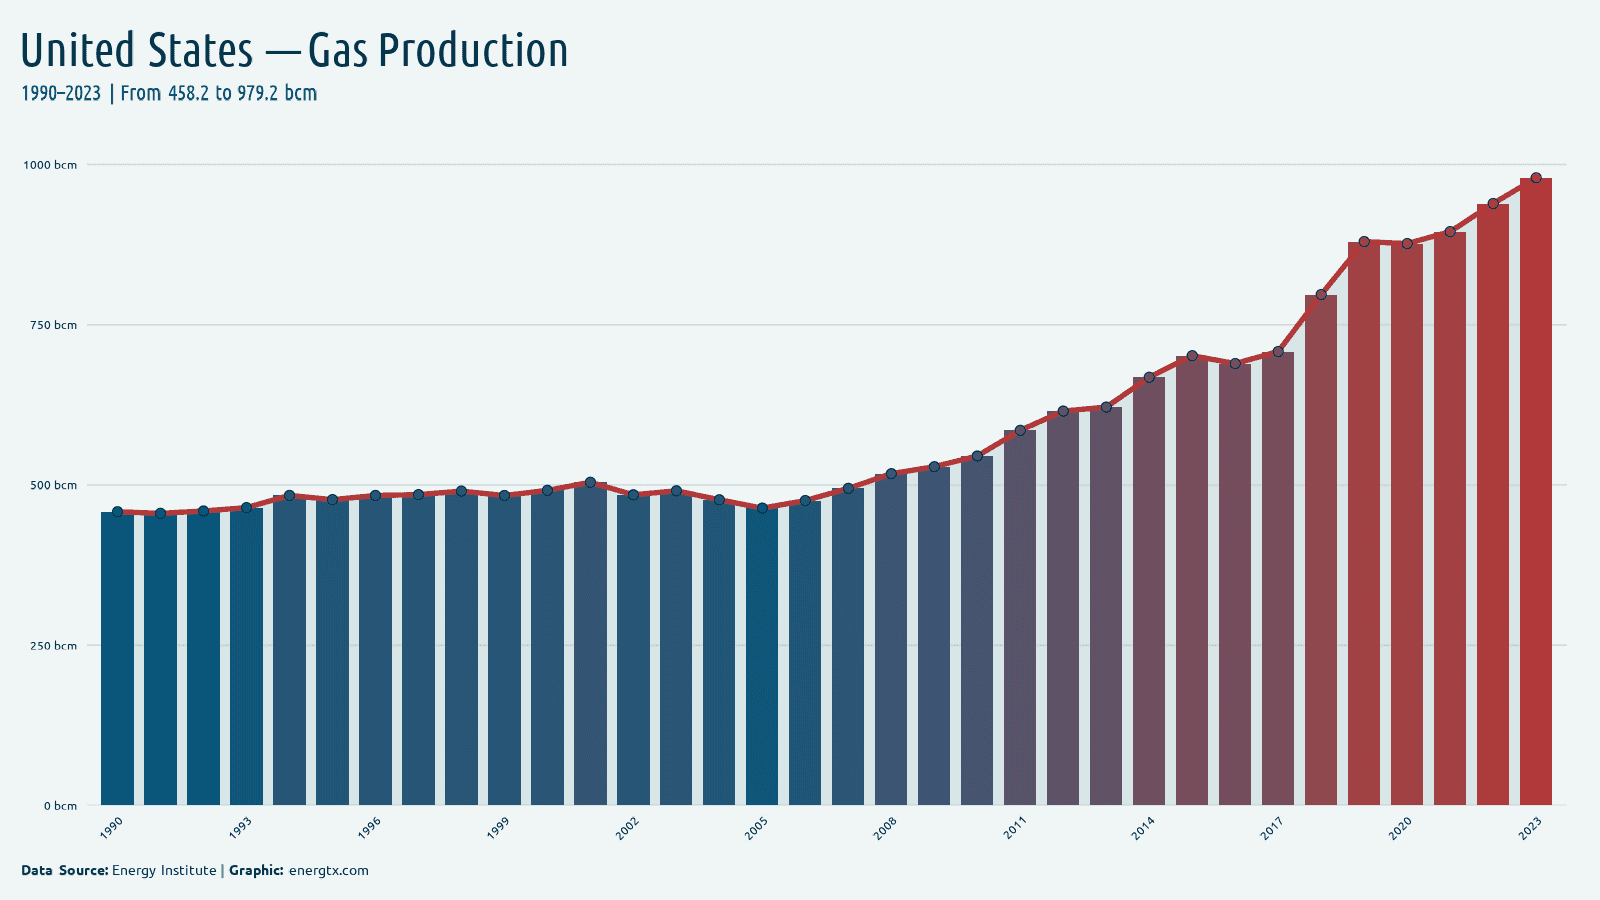
2023
Gas Production
979.2
bcm
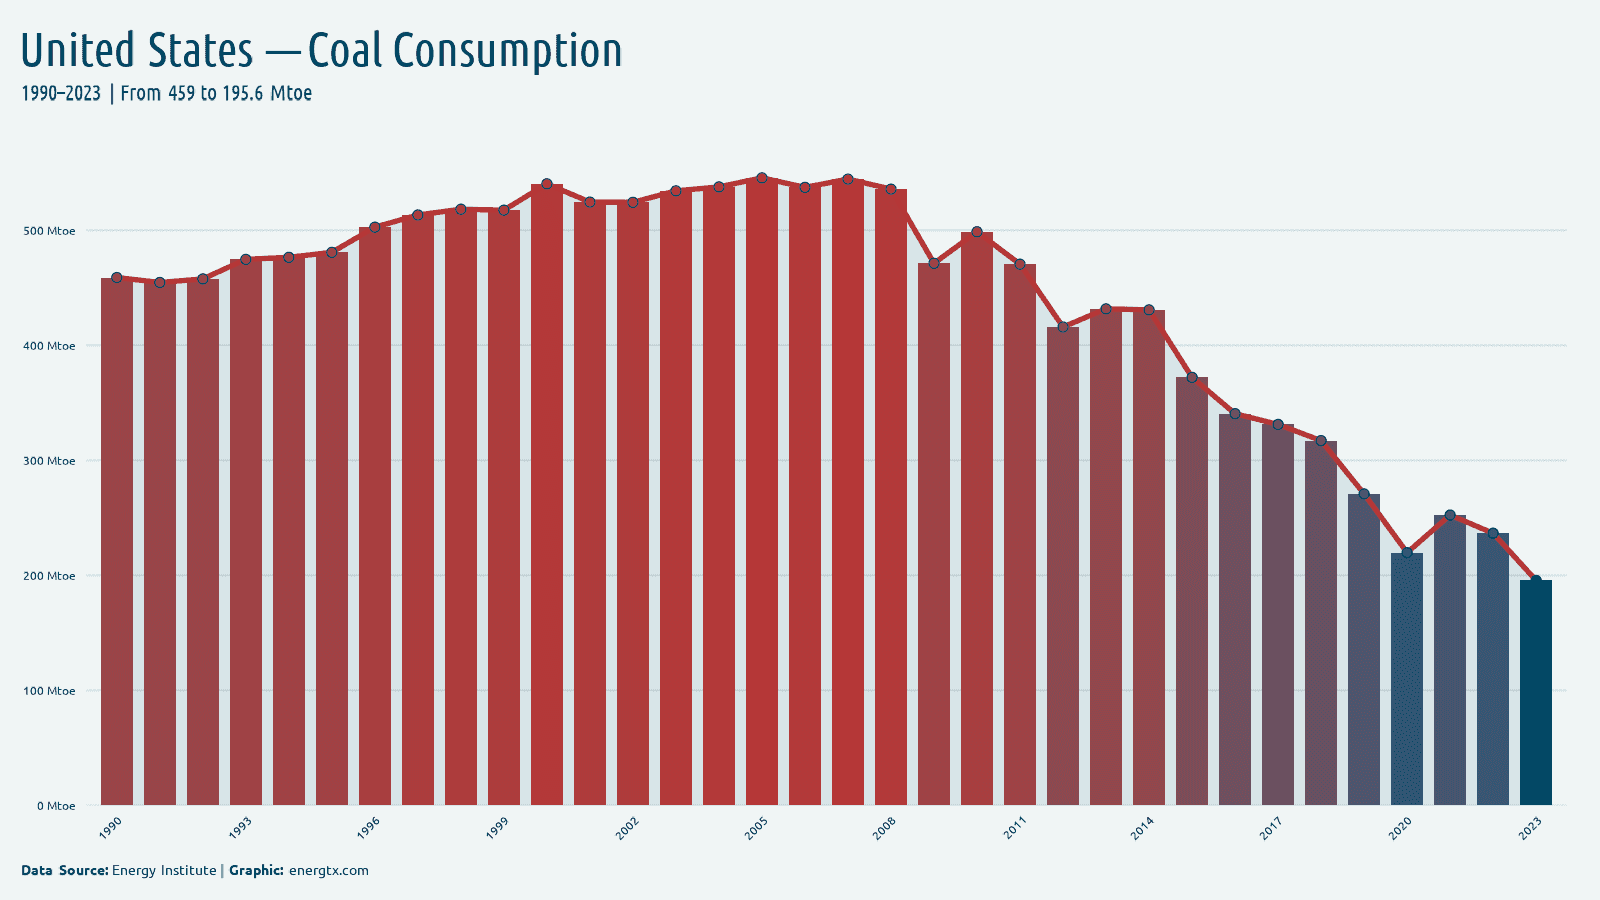
2023
Coal Consumption
195.6
Mtoe
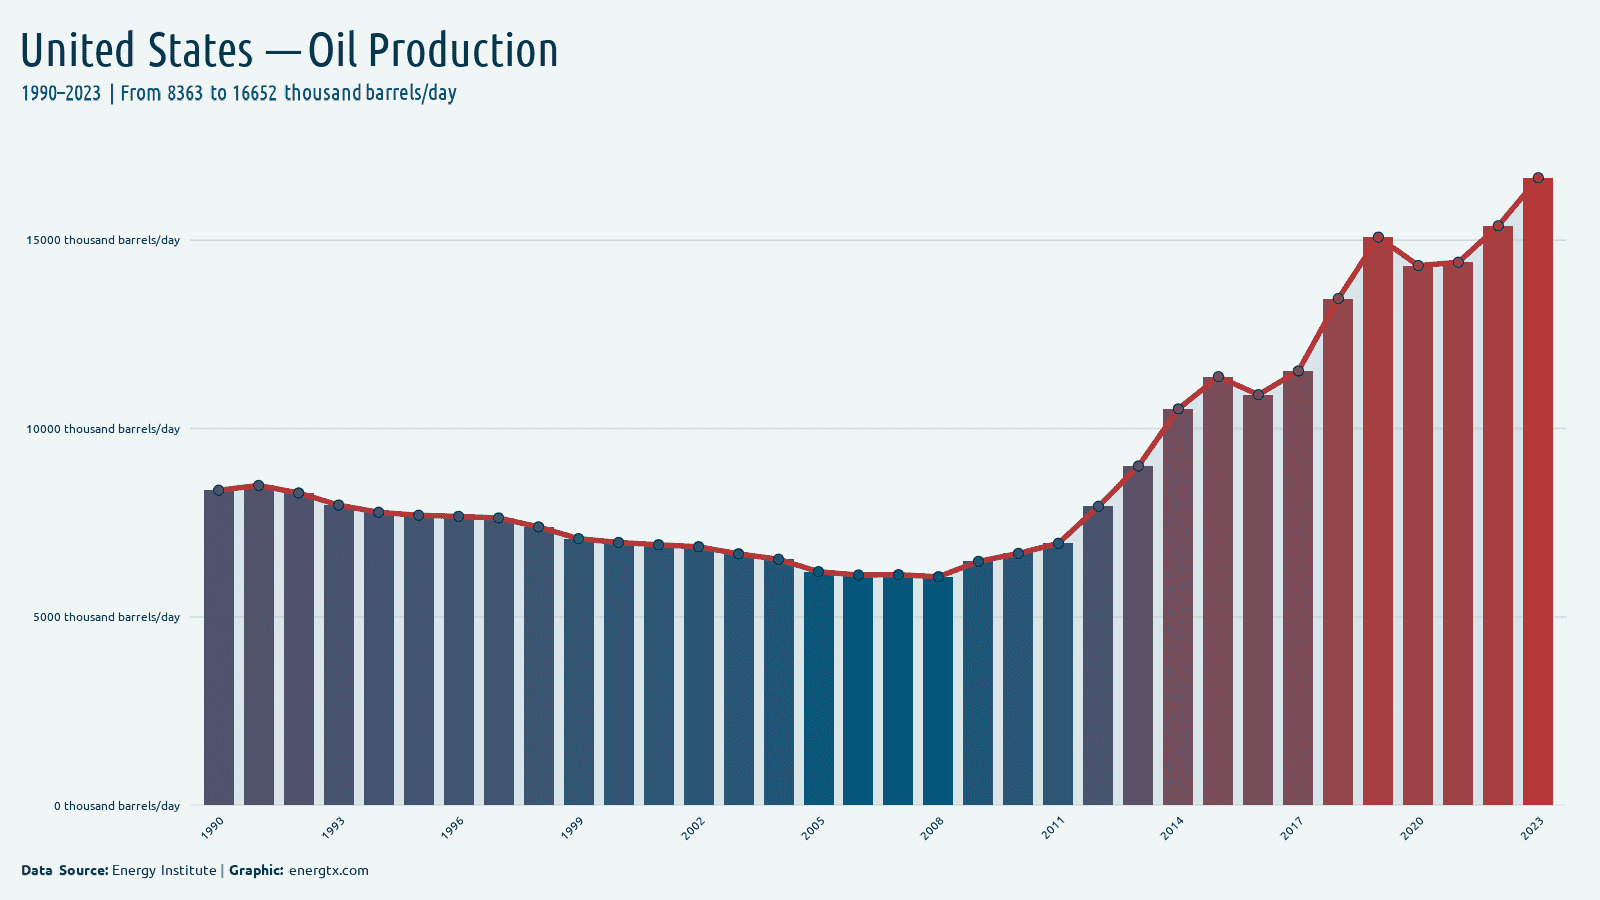
2023
Oil Production
16.7k
k barrels/day
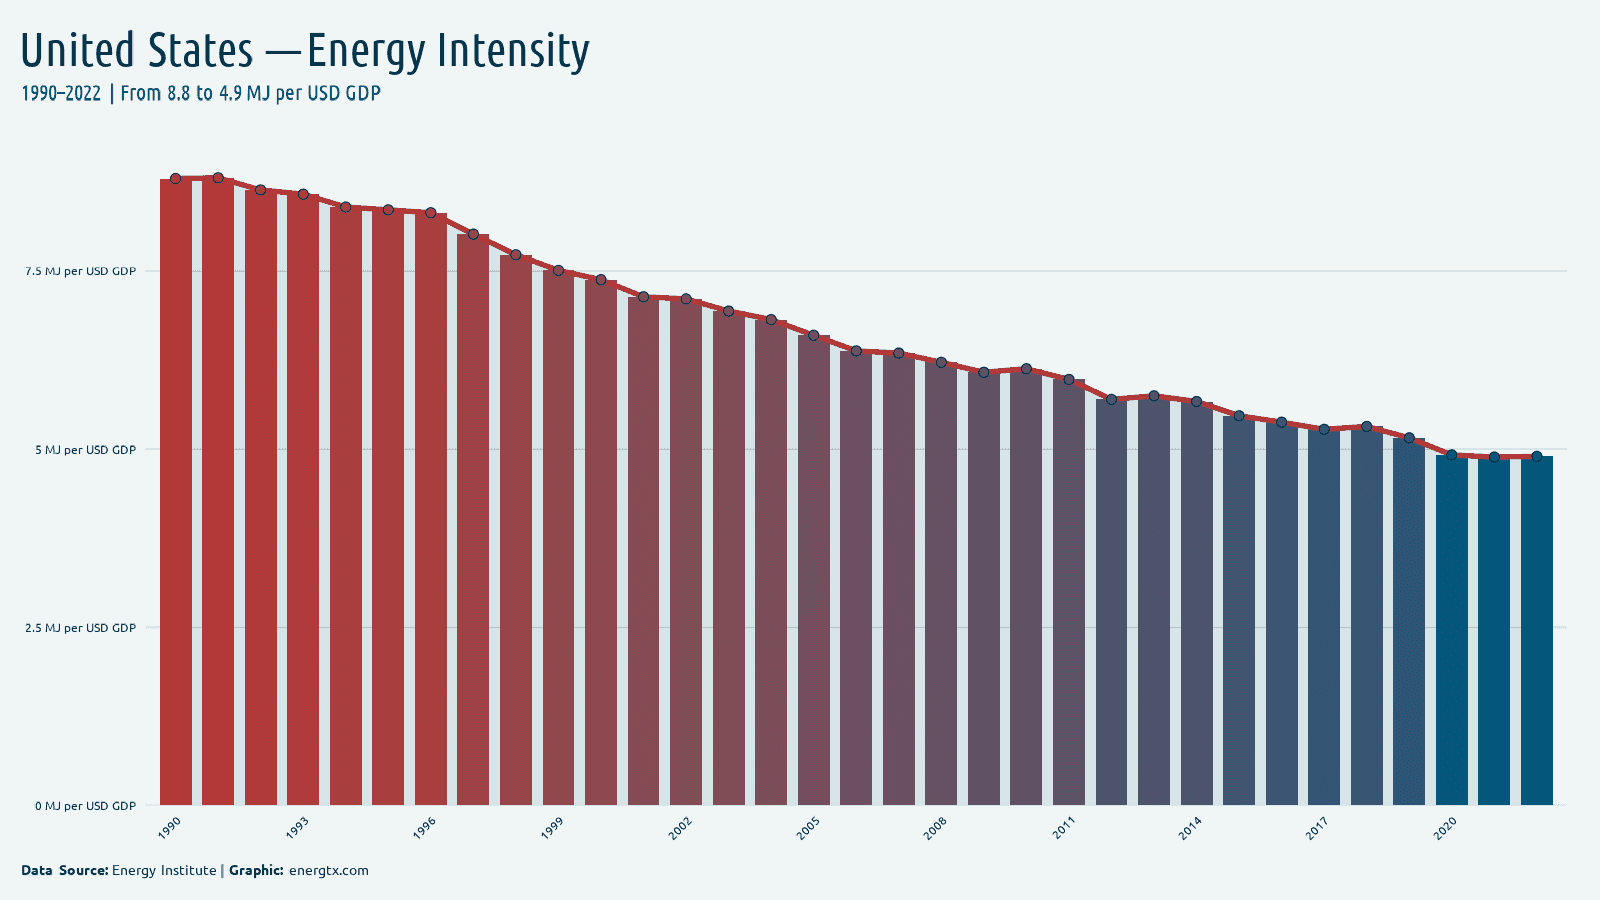
2022
Energy Intensity
4.9
MJ/$ GDP
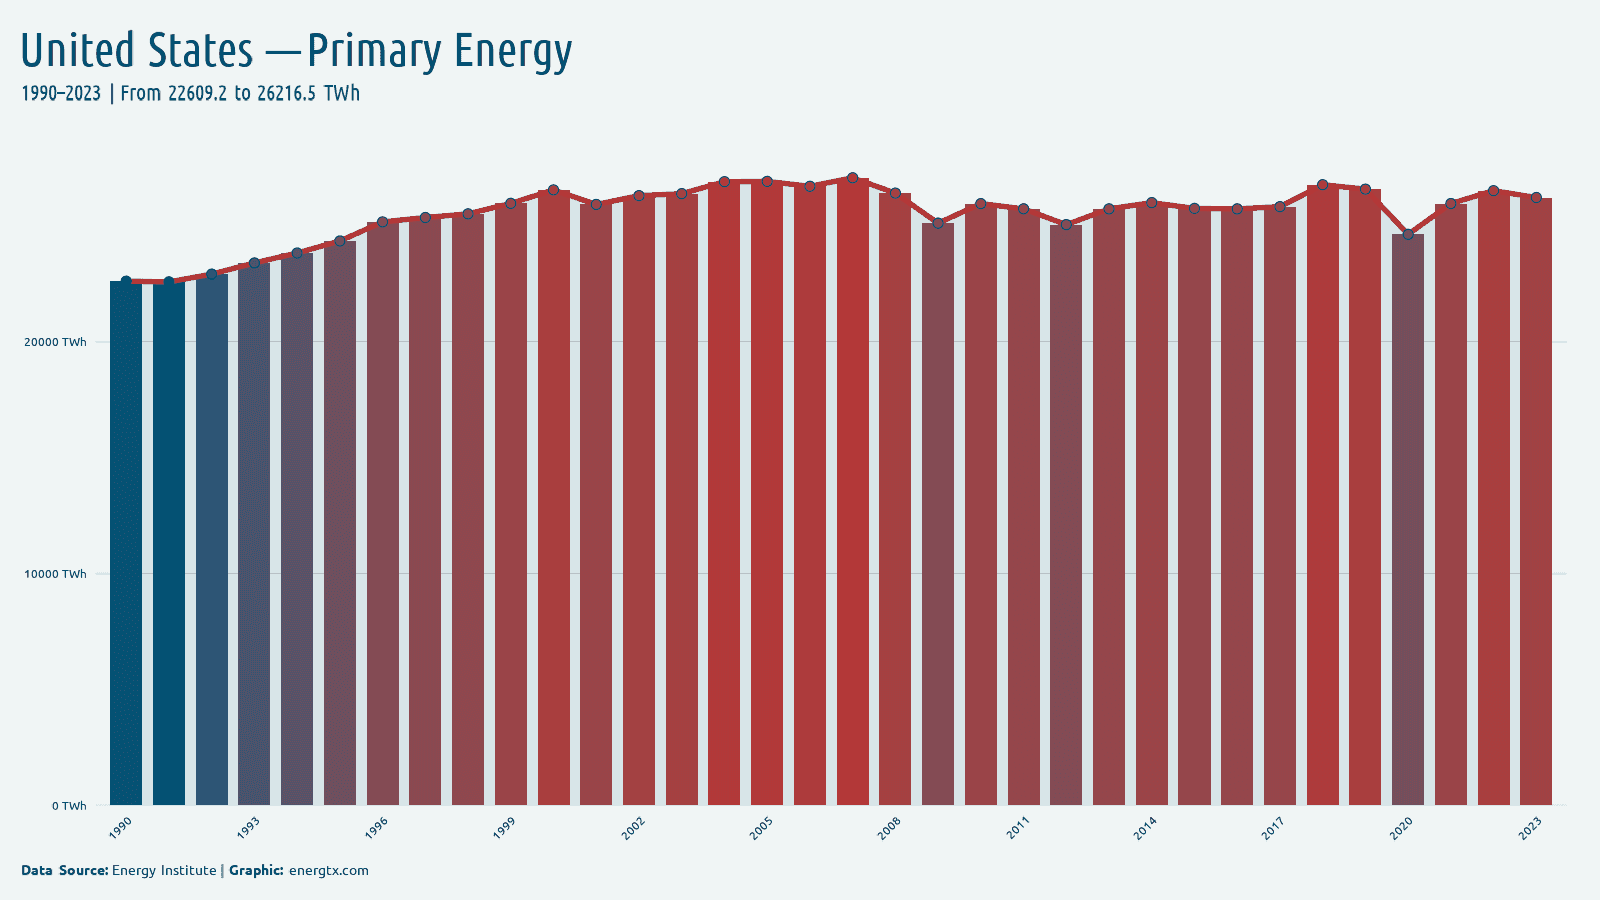
2023
Primary Energy
26.2k
TWh
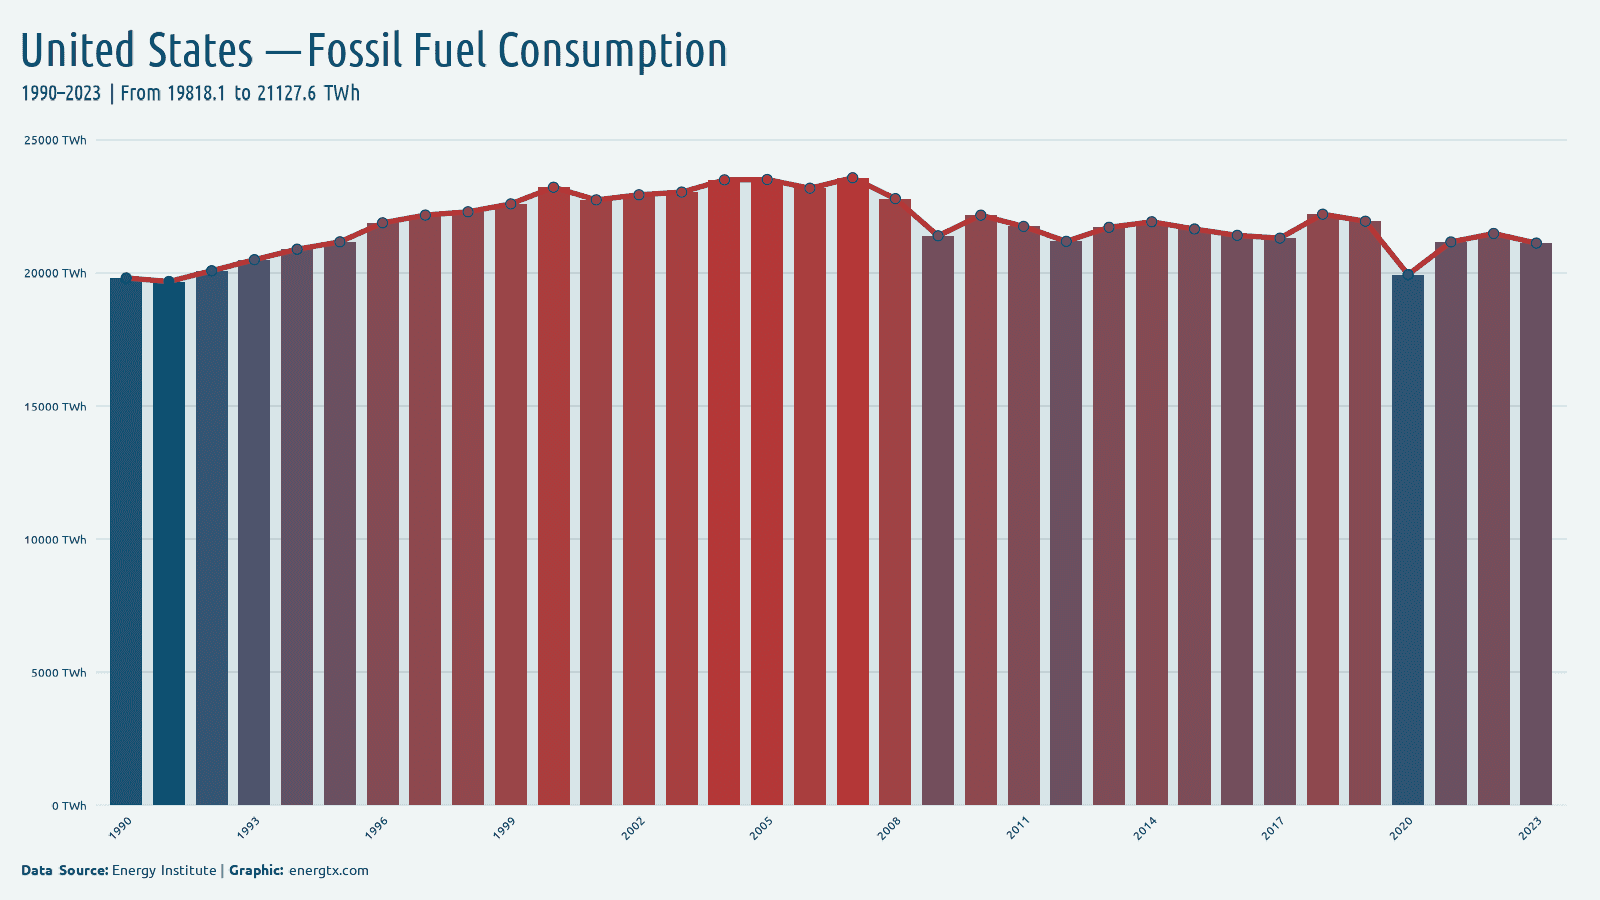
2023
Fossil Fuel Consumption
21.1k
TWh
2023
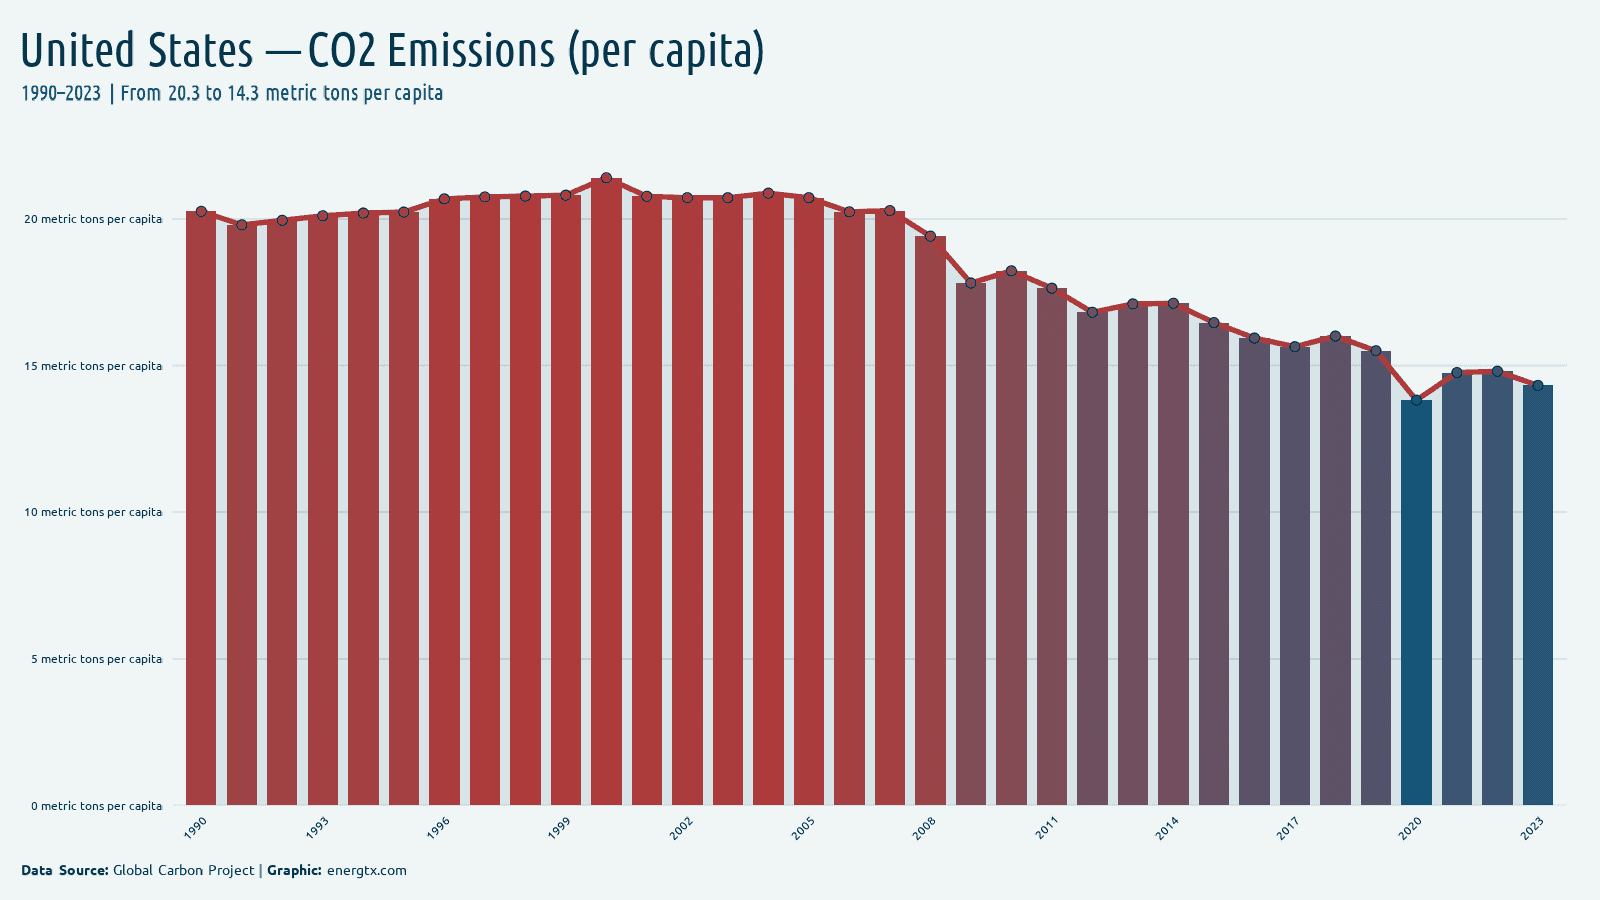
CO2 Emissions (per capita)
14.3
metric tons/capita
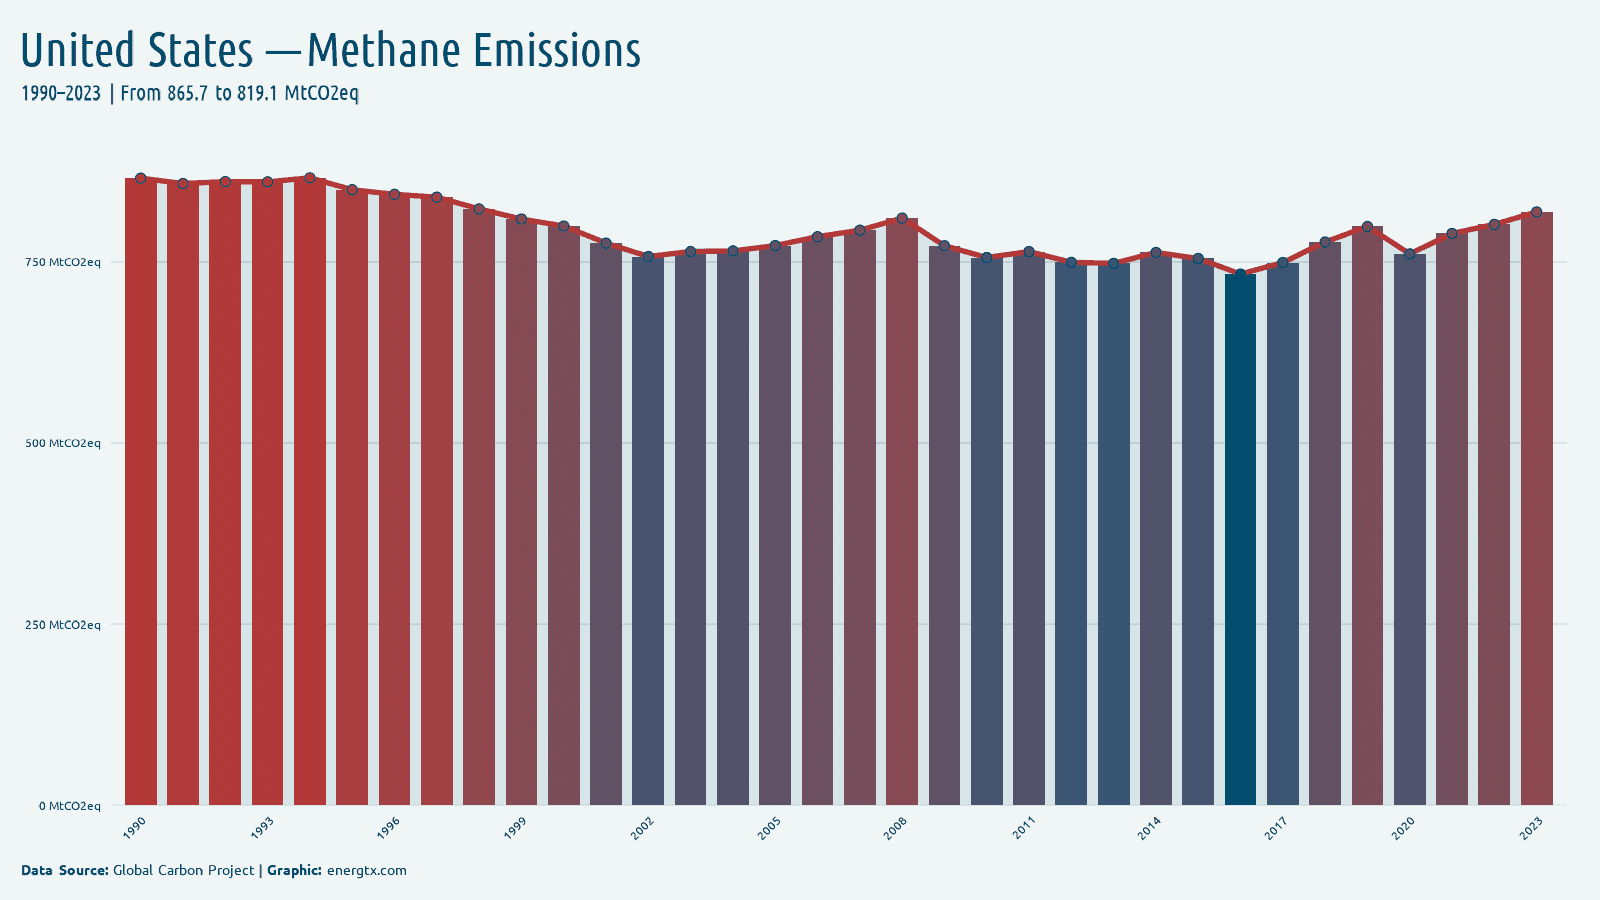
2023
Methane Emissions
819.1
MtCO2eq
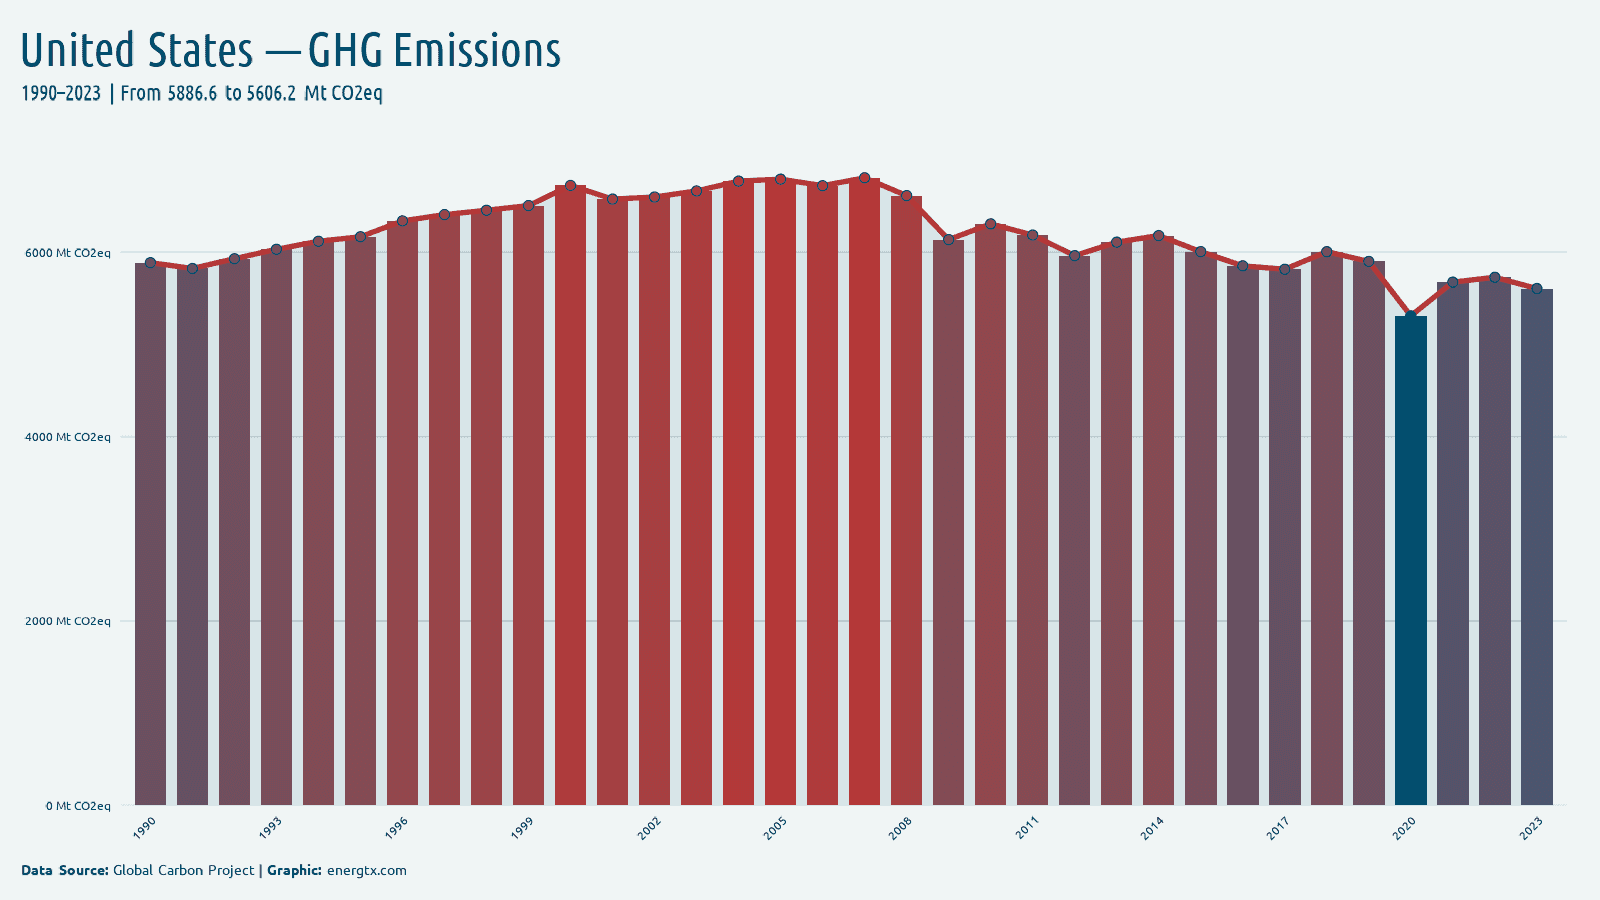
2023
GHG Emissions
5.6k
MtCO2eq
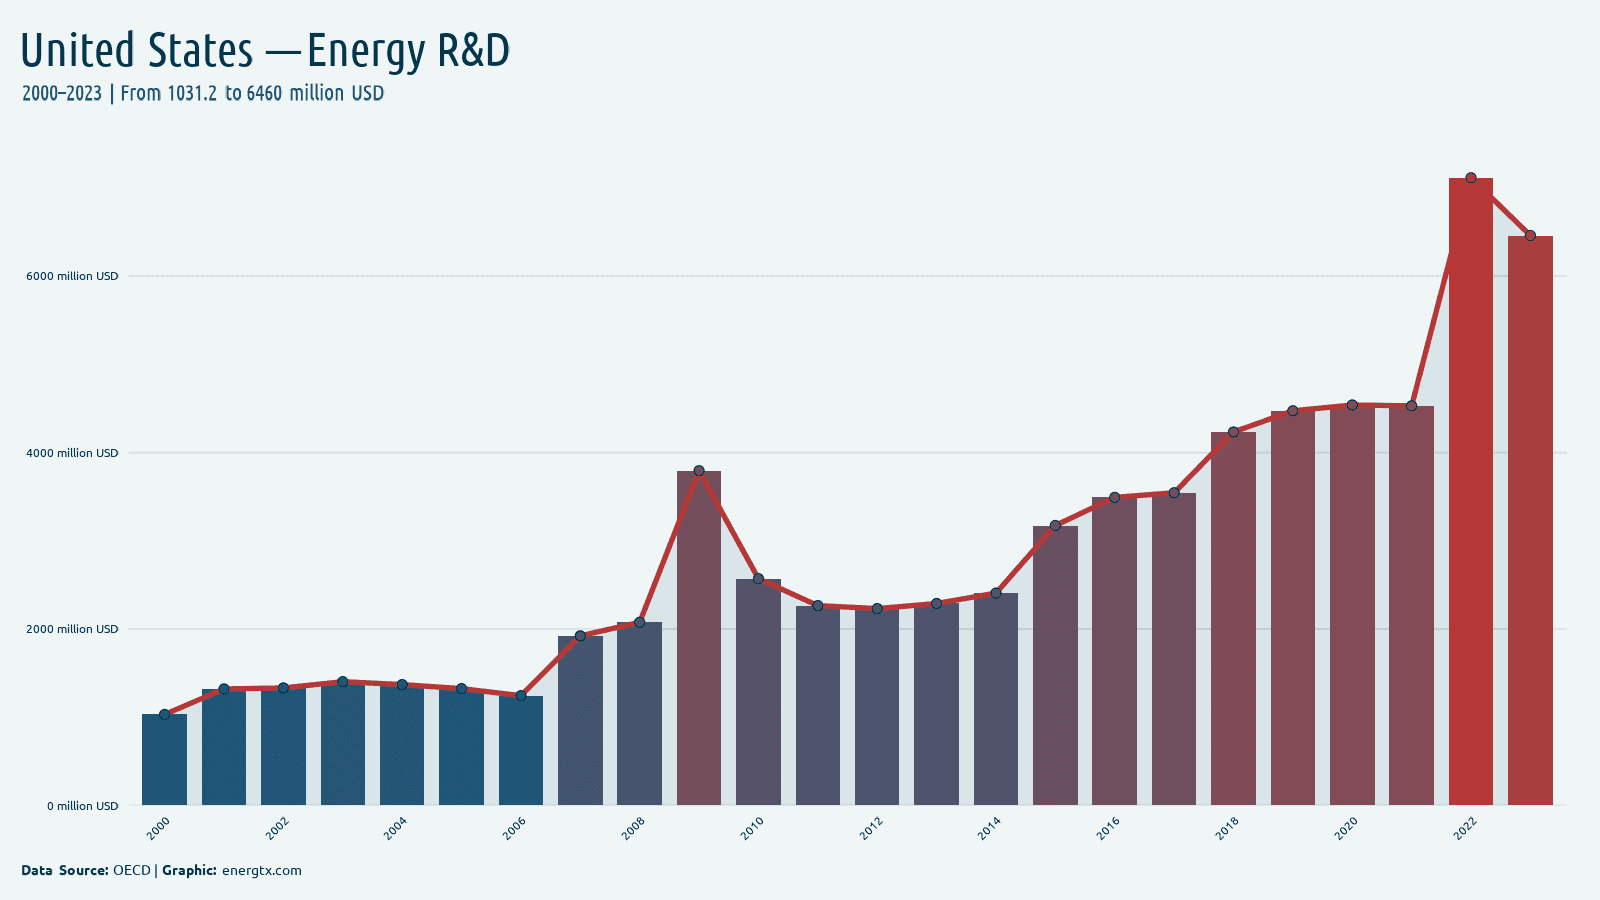
2023
Energy R&D
6.5k
million $
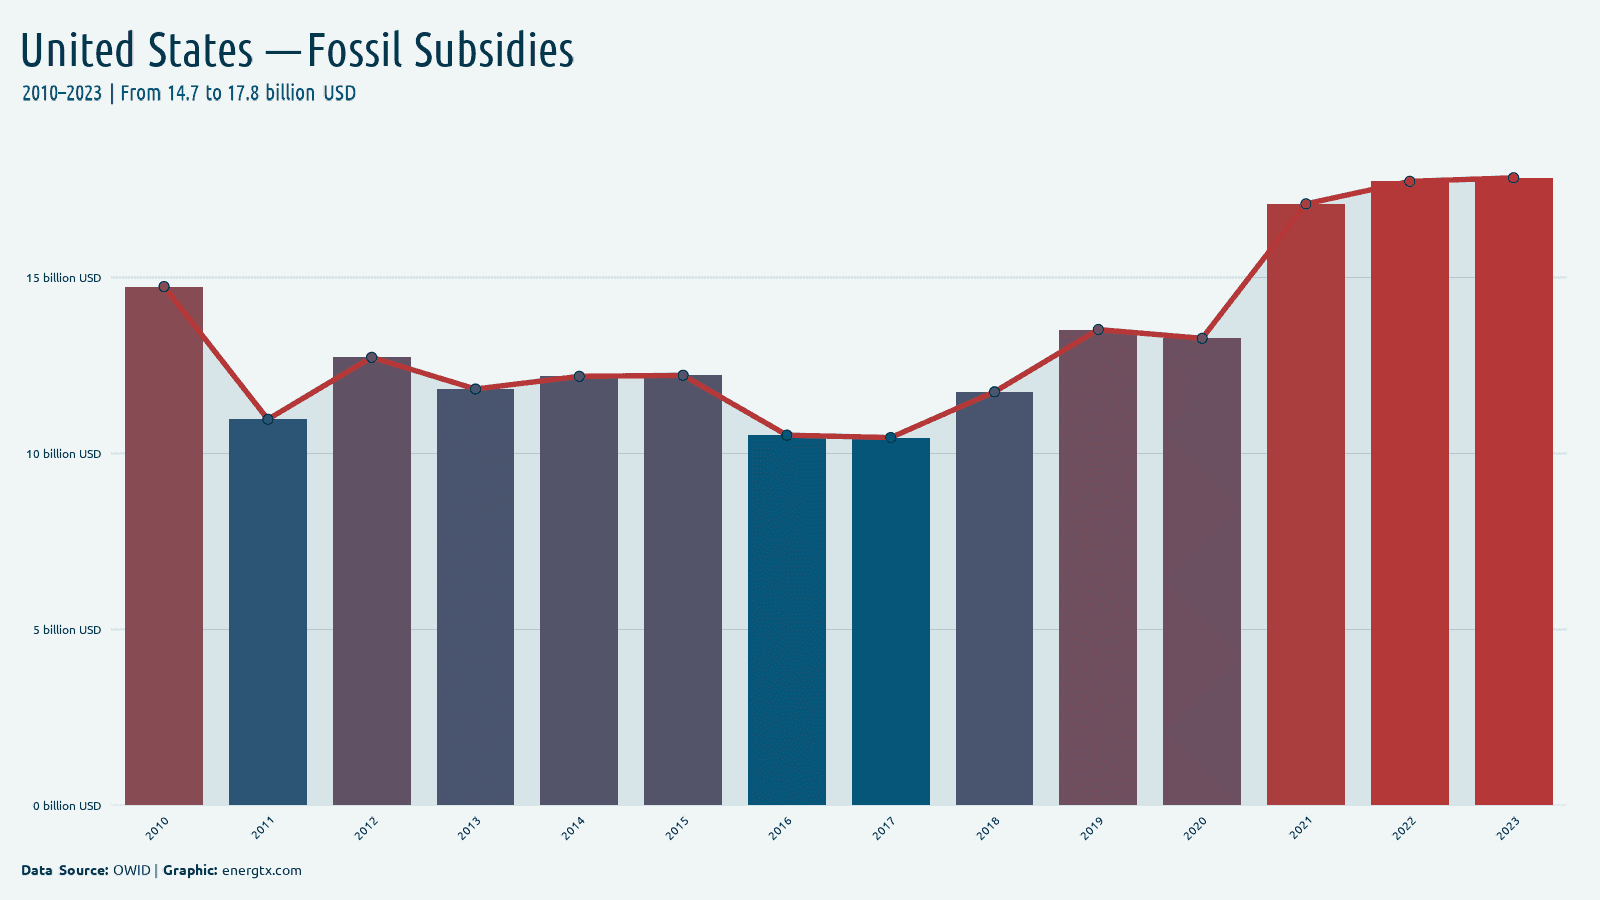
2023
Fossil Subsidies
17.8
billion $
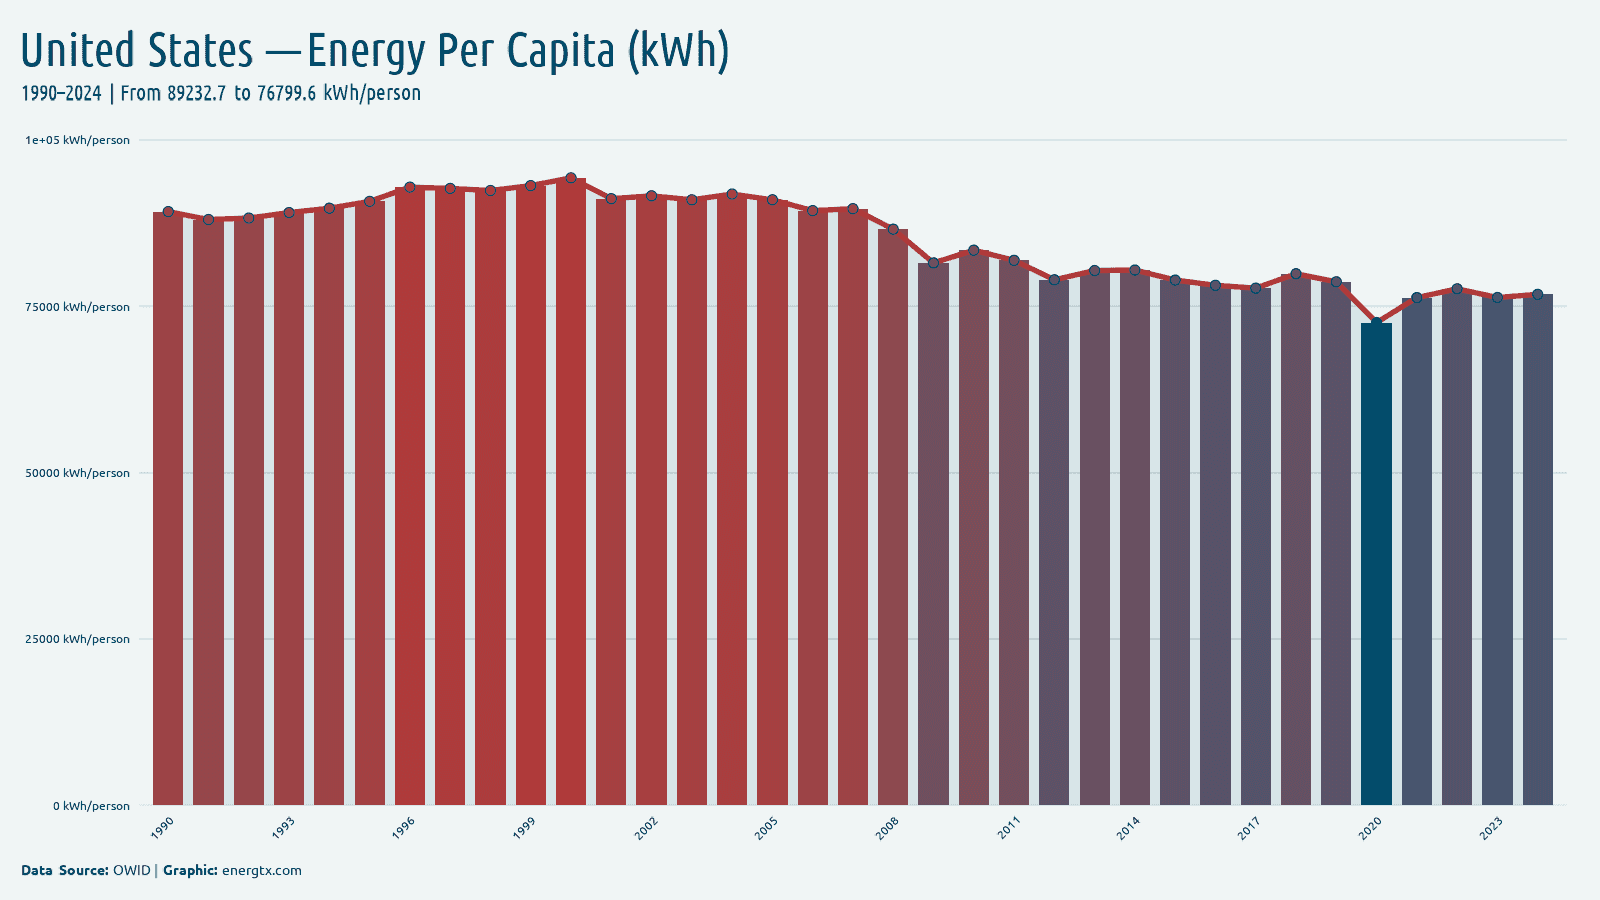
2024
Energy Use Per Capita (kWh)
76.8k
kWh/capita
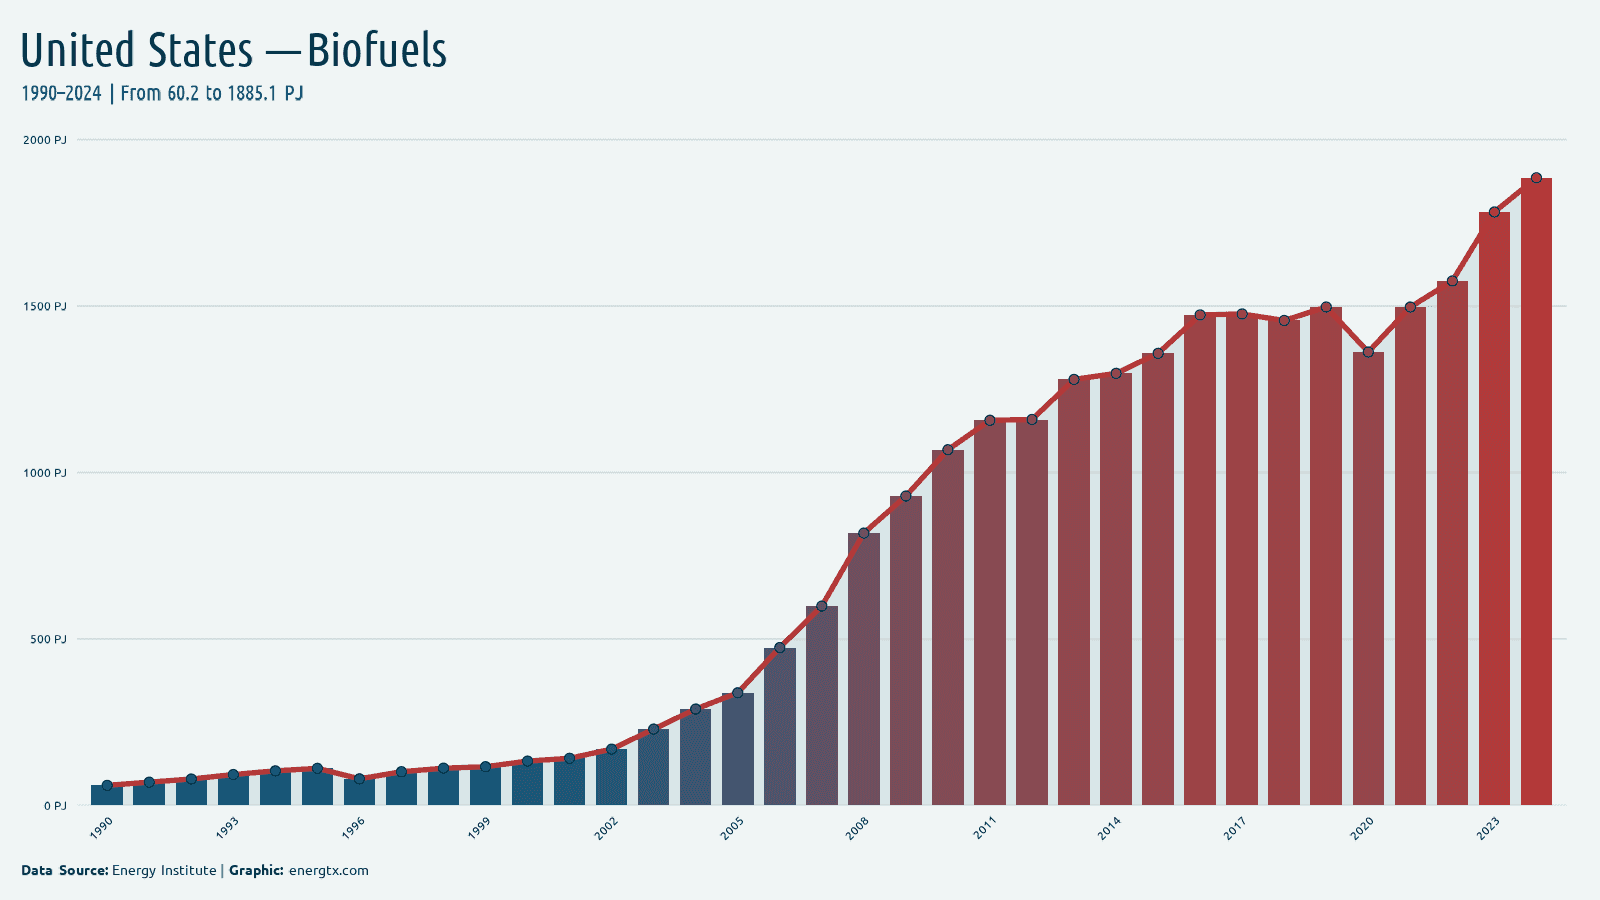
2024
Biofuels Consumption
1.9k
PJ
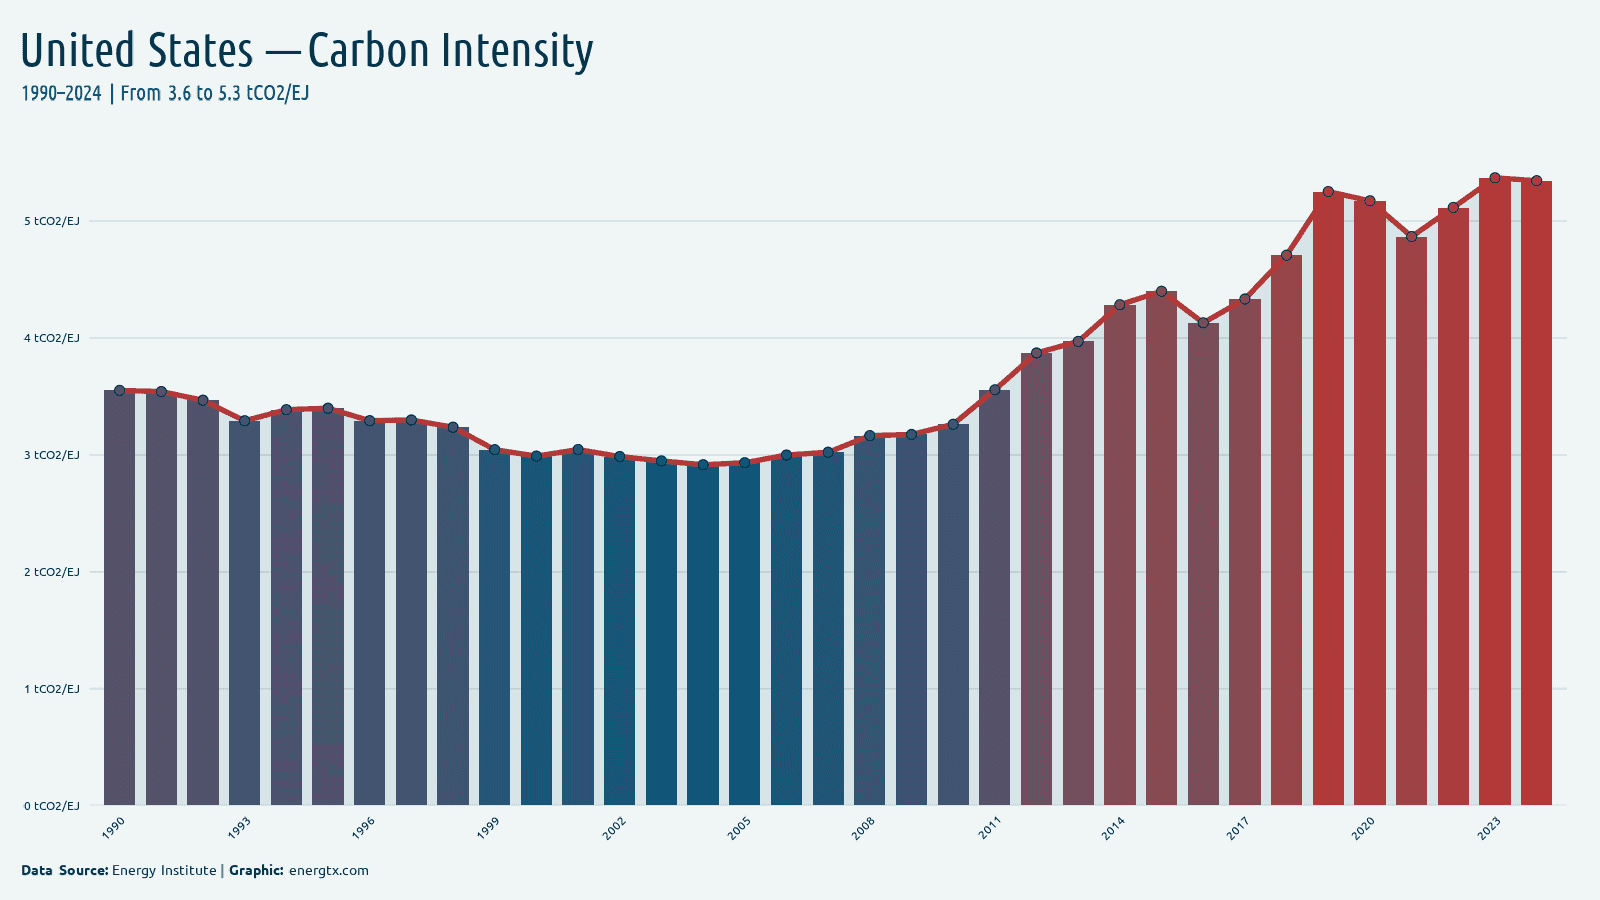
2024
Carbon Intensity
5.3
tCO2/EJ
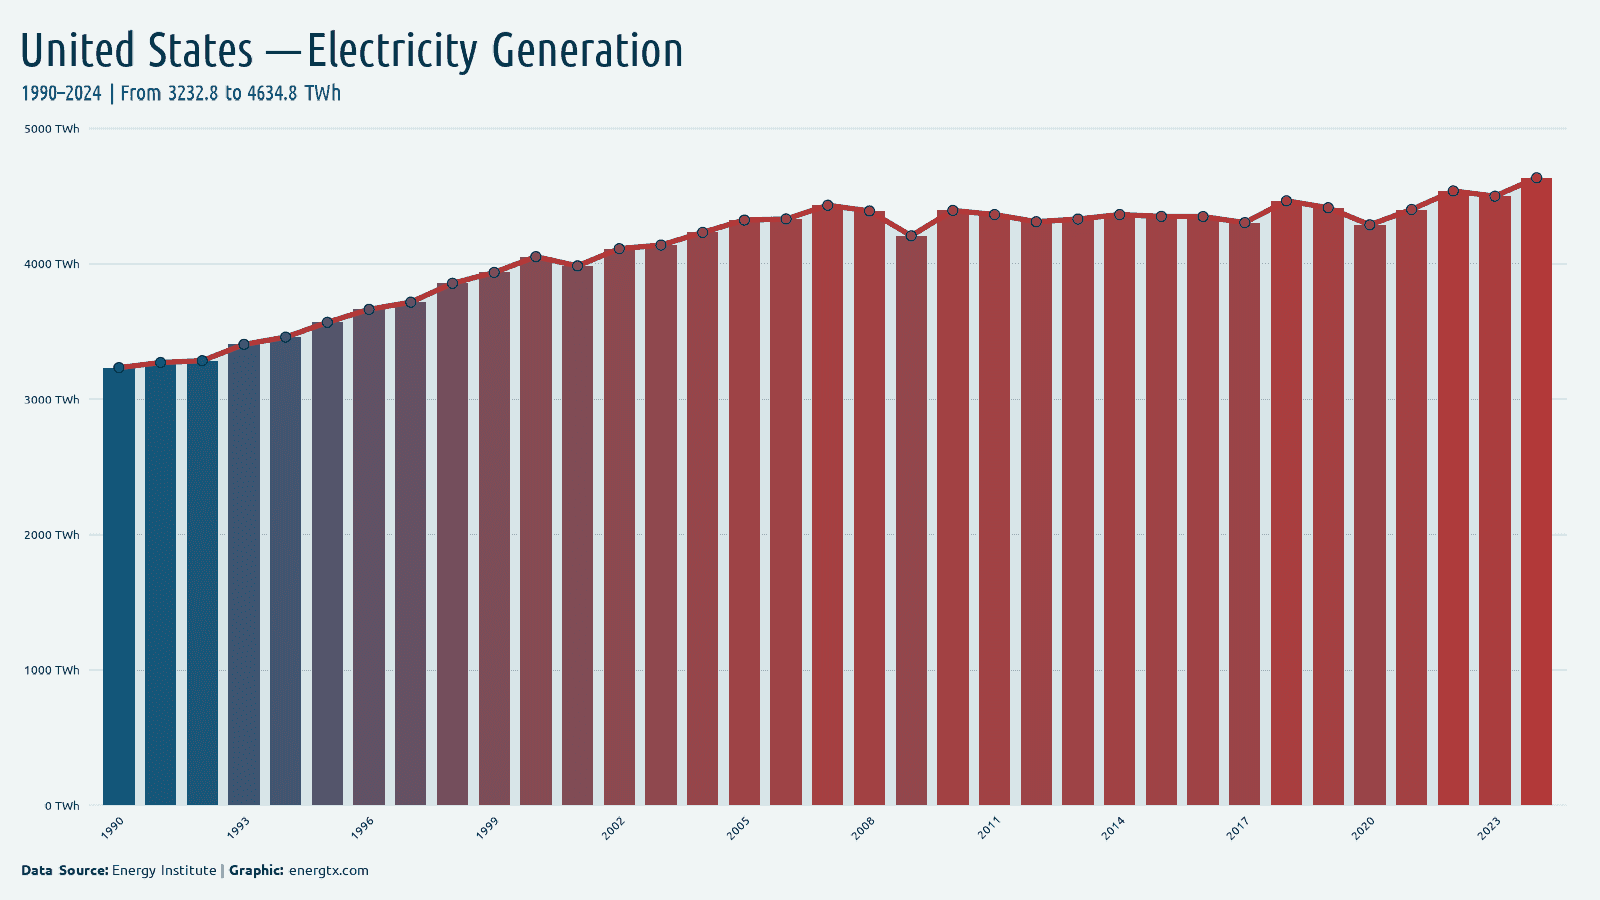
2024
Electricity Generation
4.6k
TWh
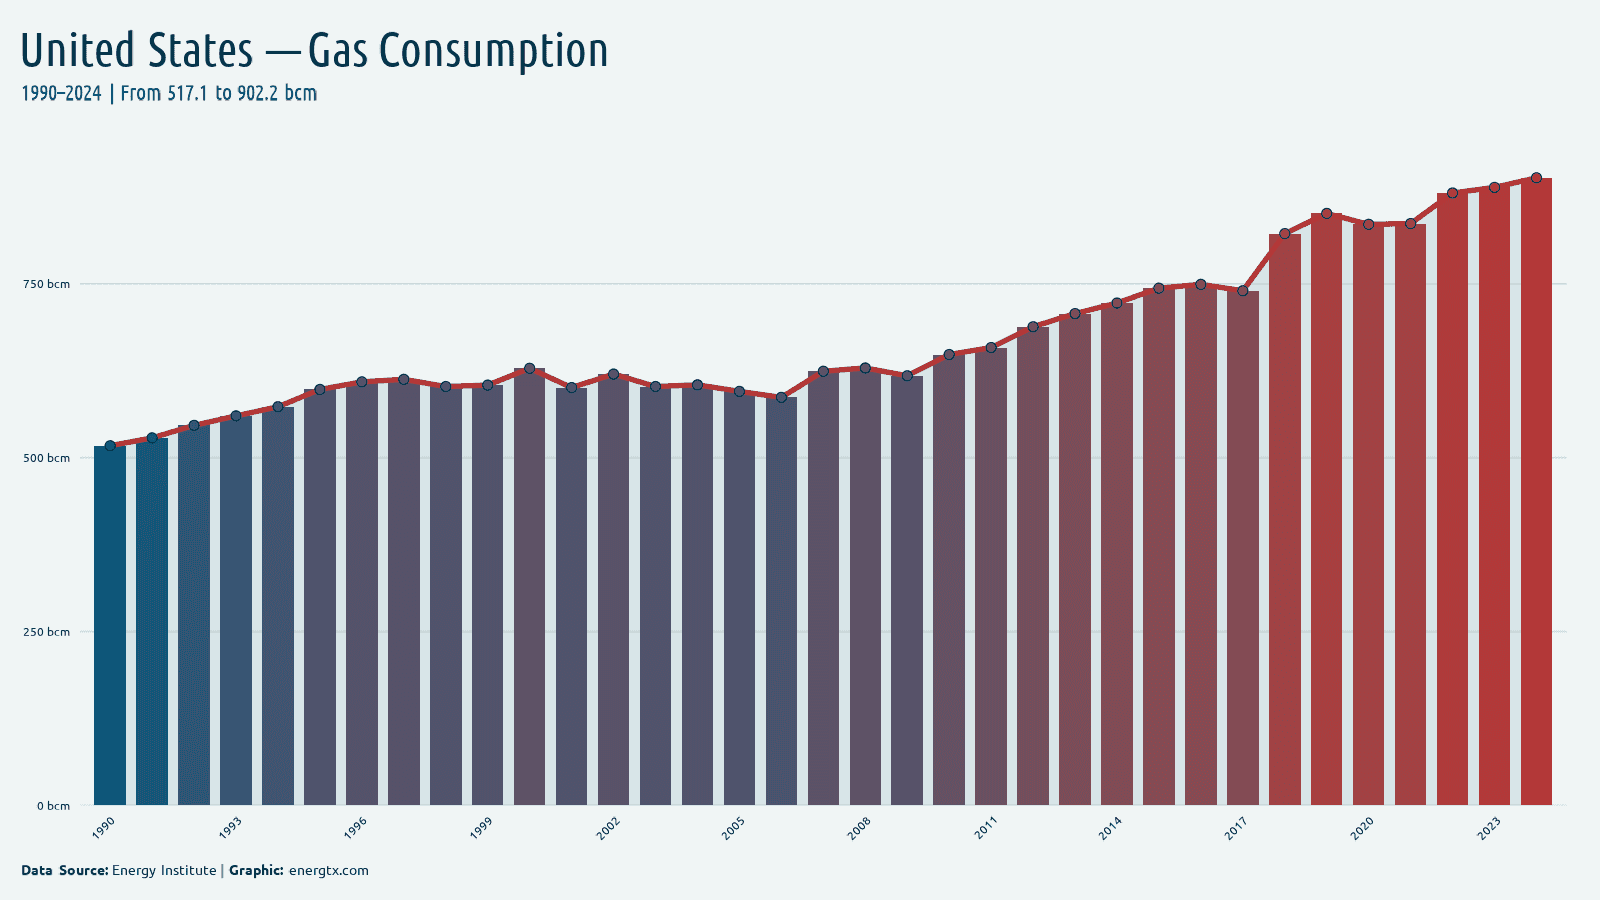
2024
Gas Consumption
902.2
bcm
2024
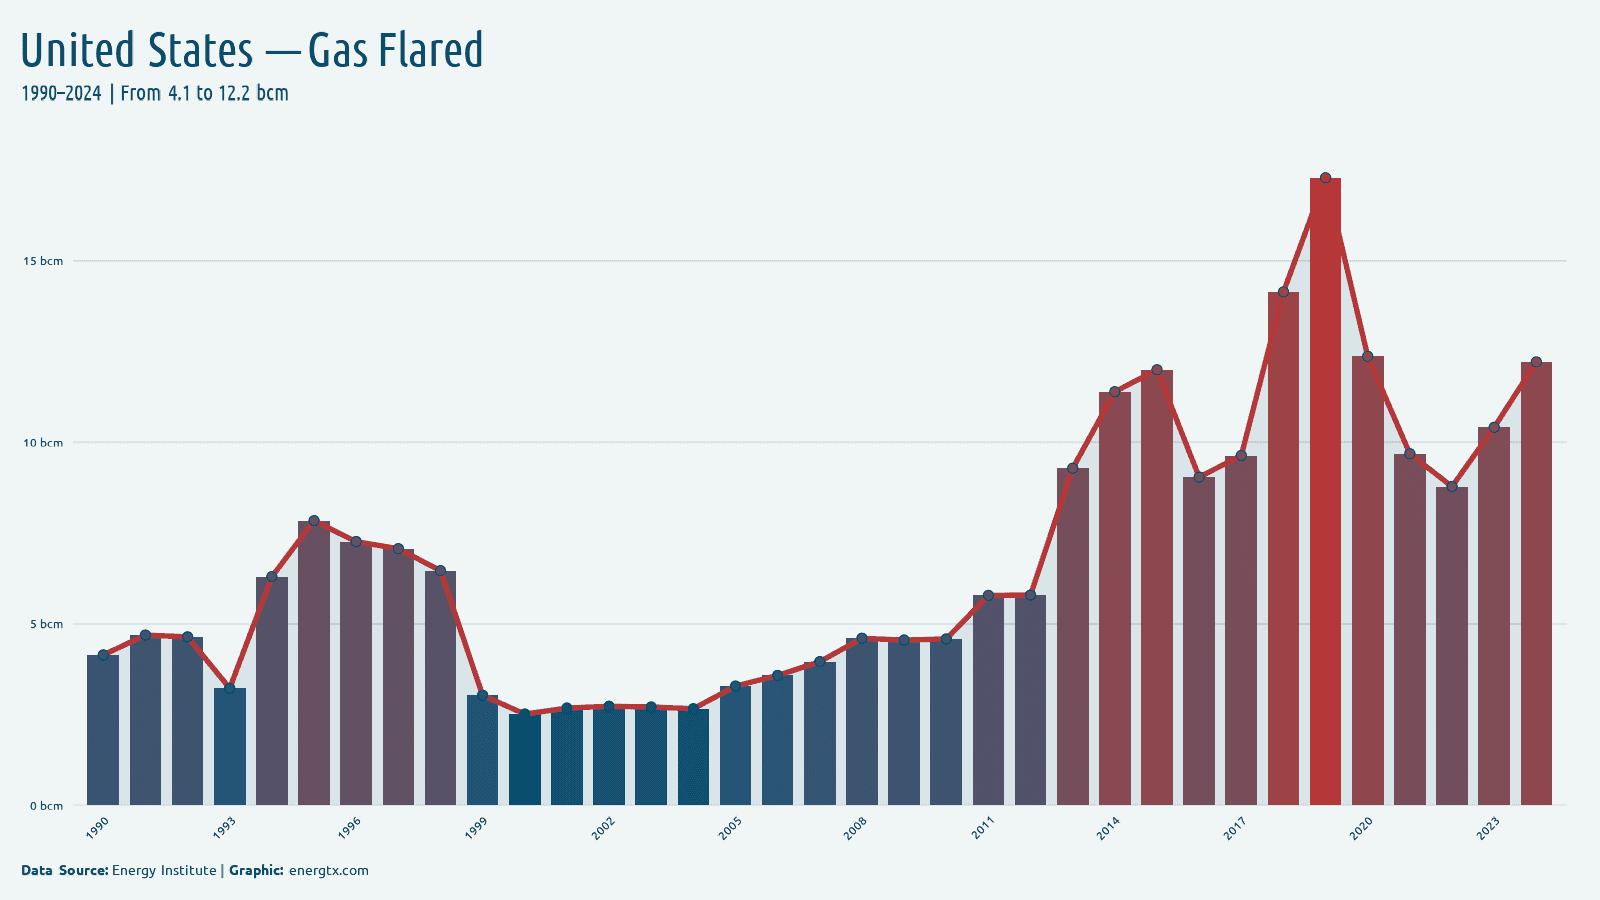
Gas Flared
12.2
bcm
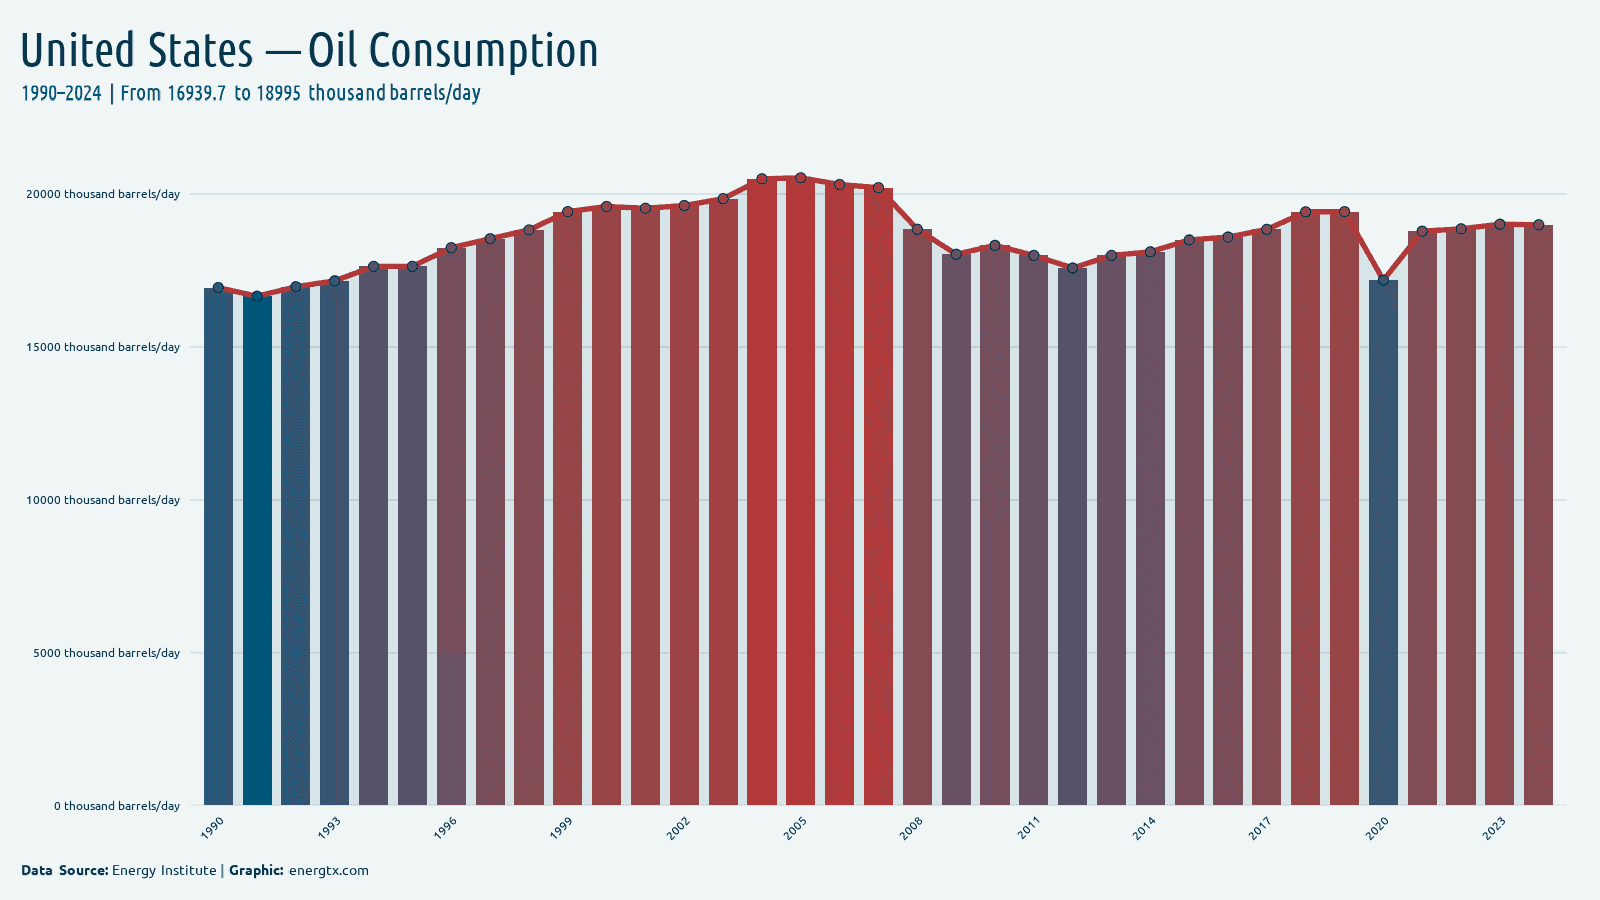
2024
Oil Consumption
19.0k
k barrels/day
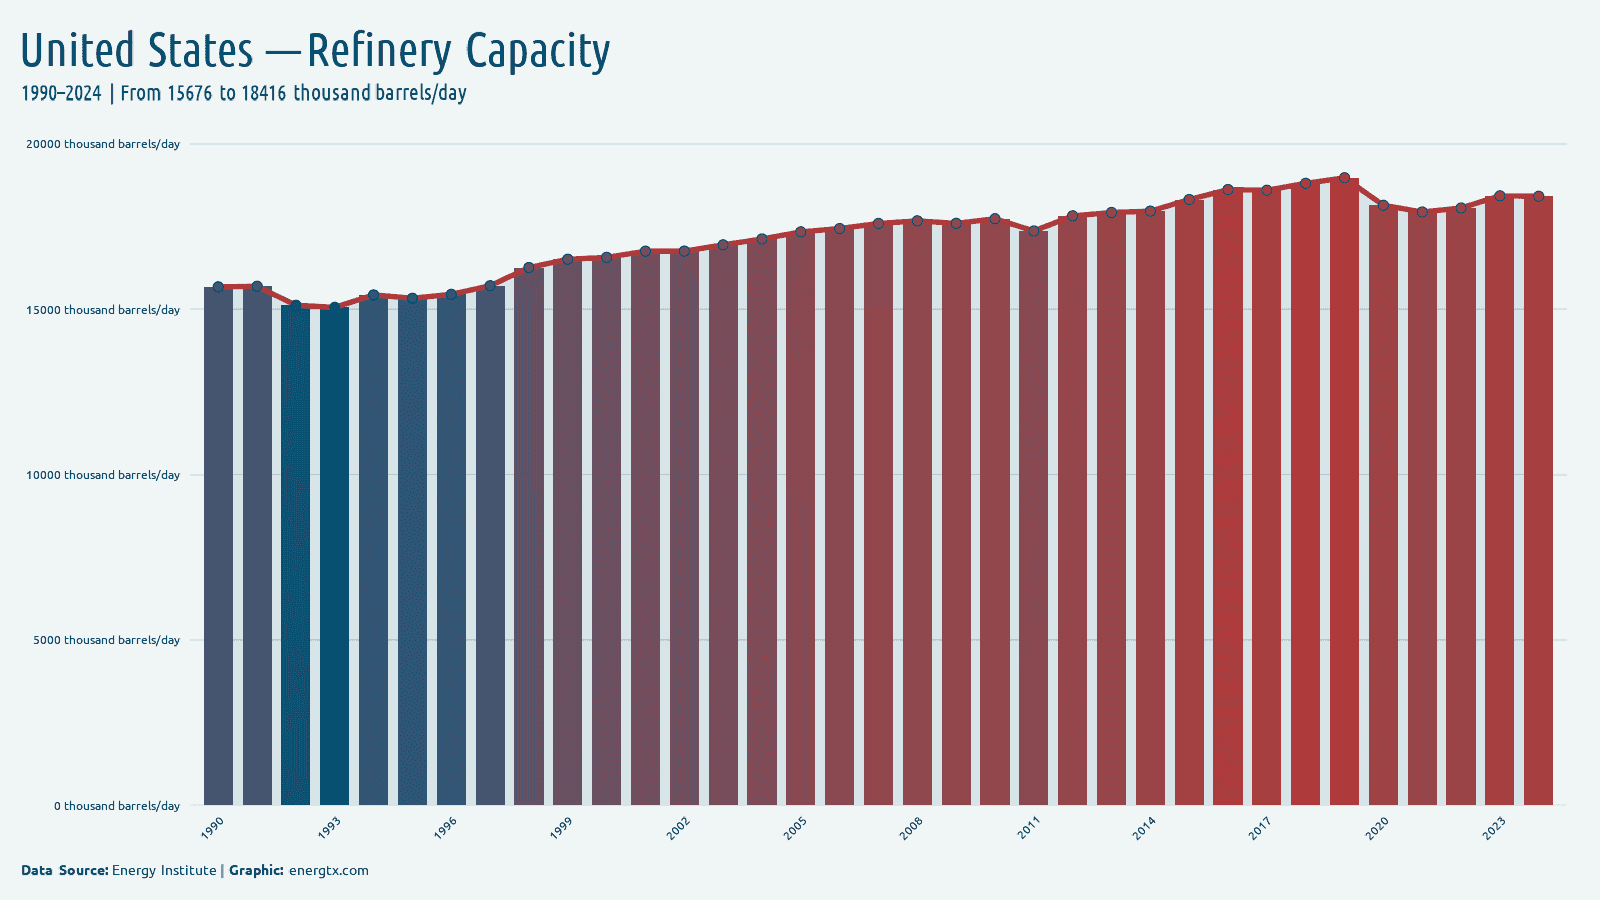
2024
Refinery Capacity
18.4k
k barrels/day
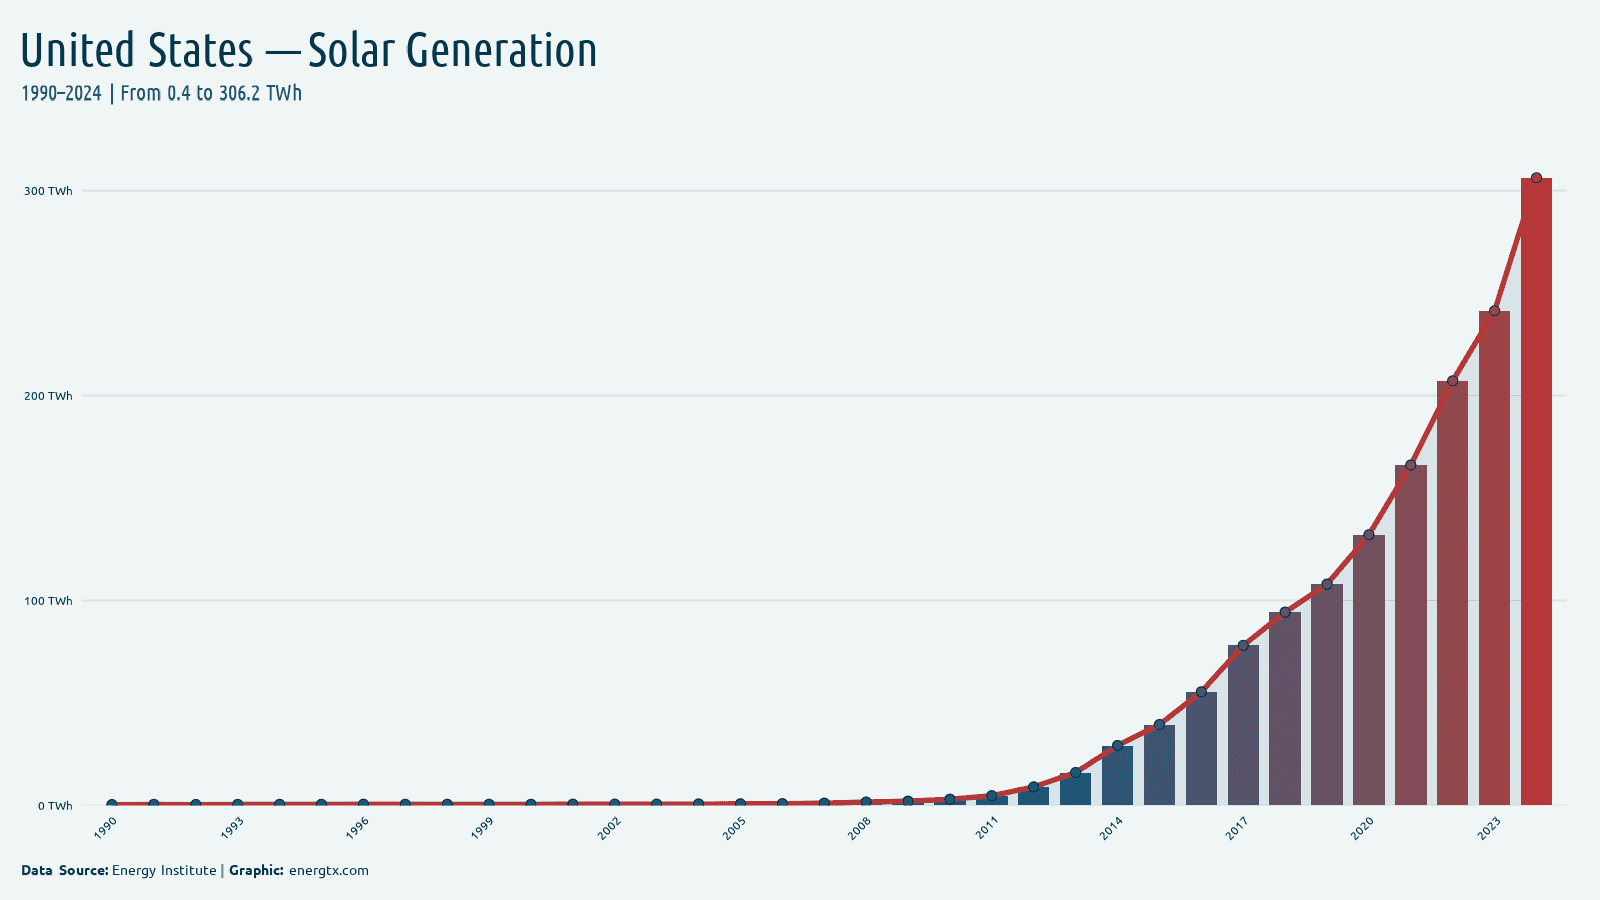
2024
Solar Generation
306.2
TWh
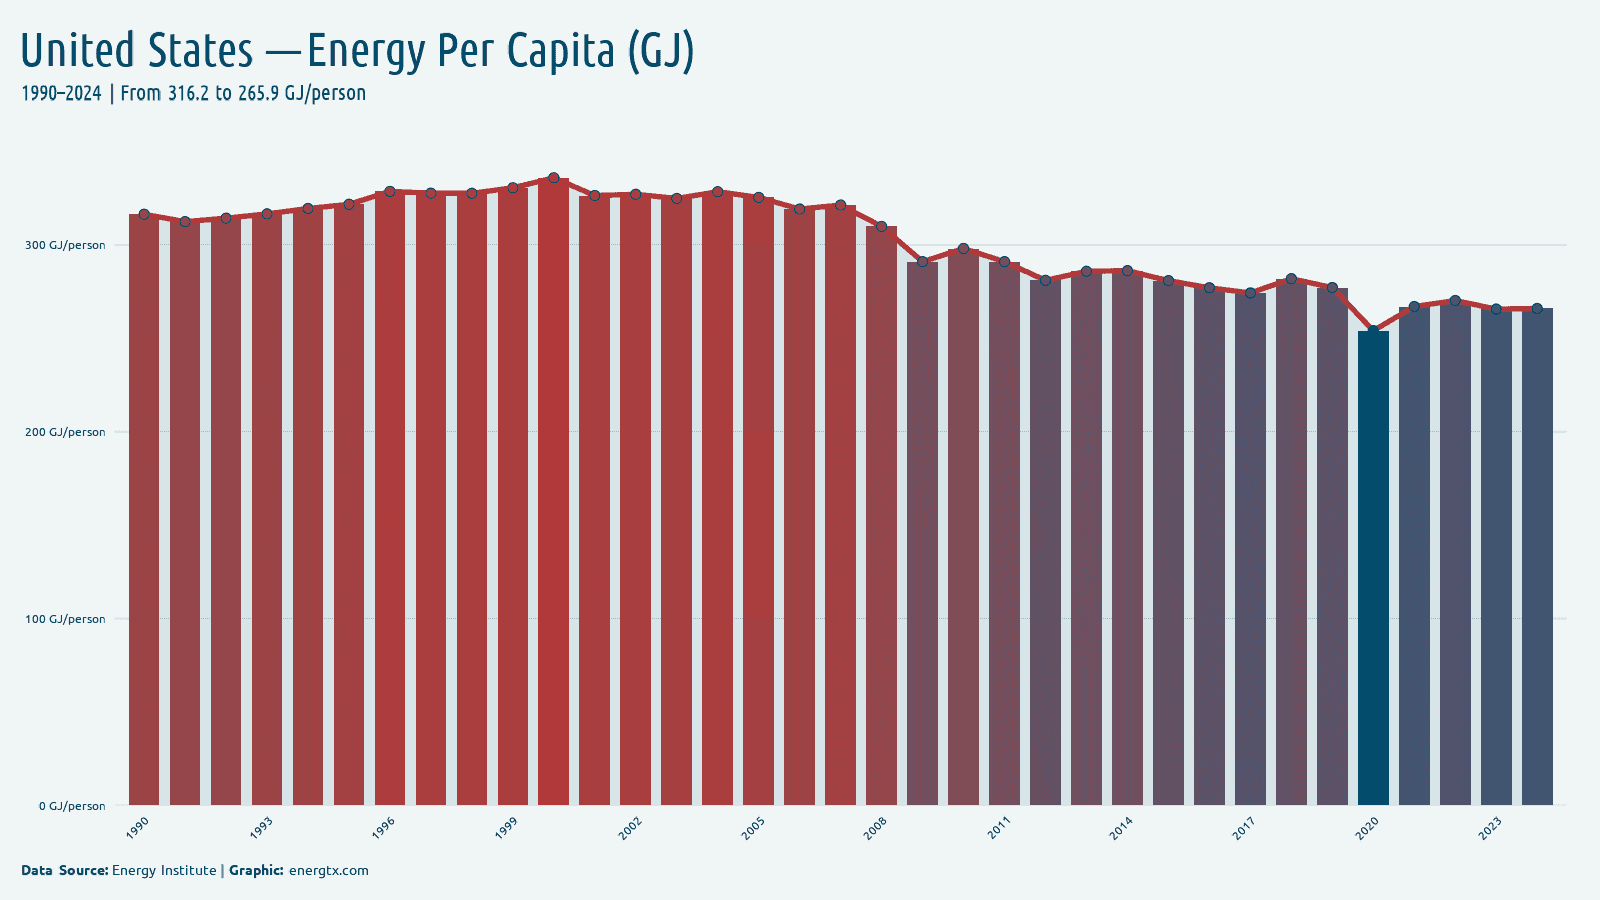
2024
Energy Per Capita (GJ)
265.9
GJ/person
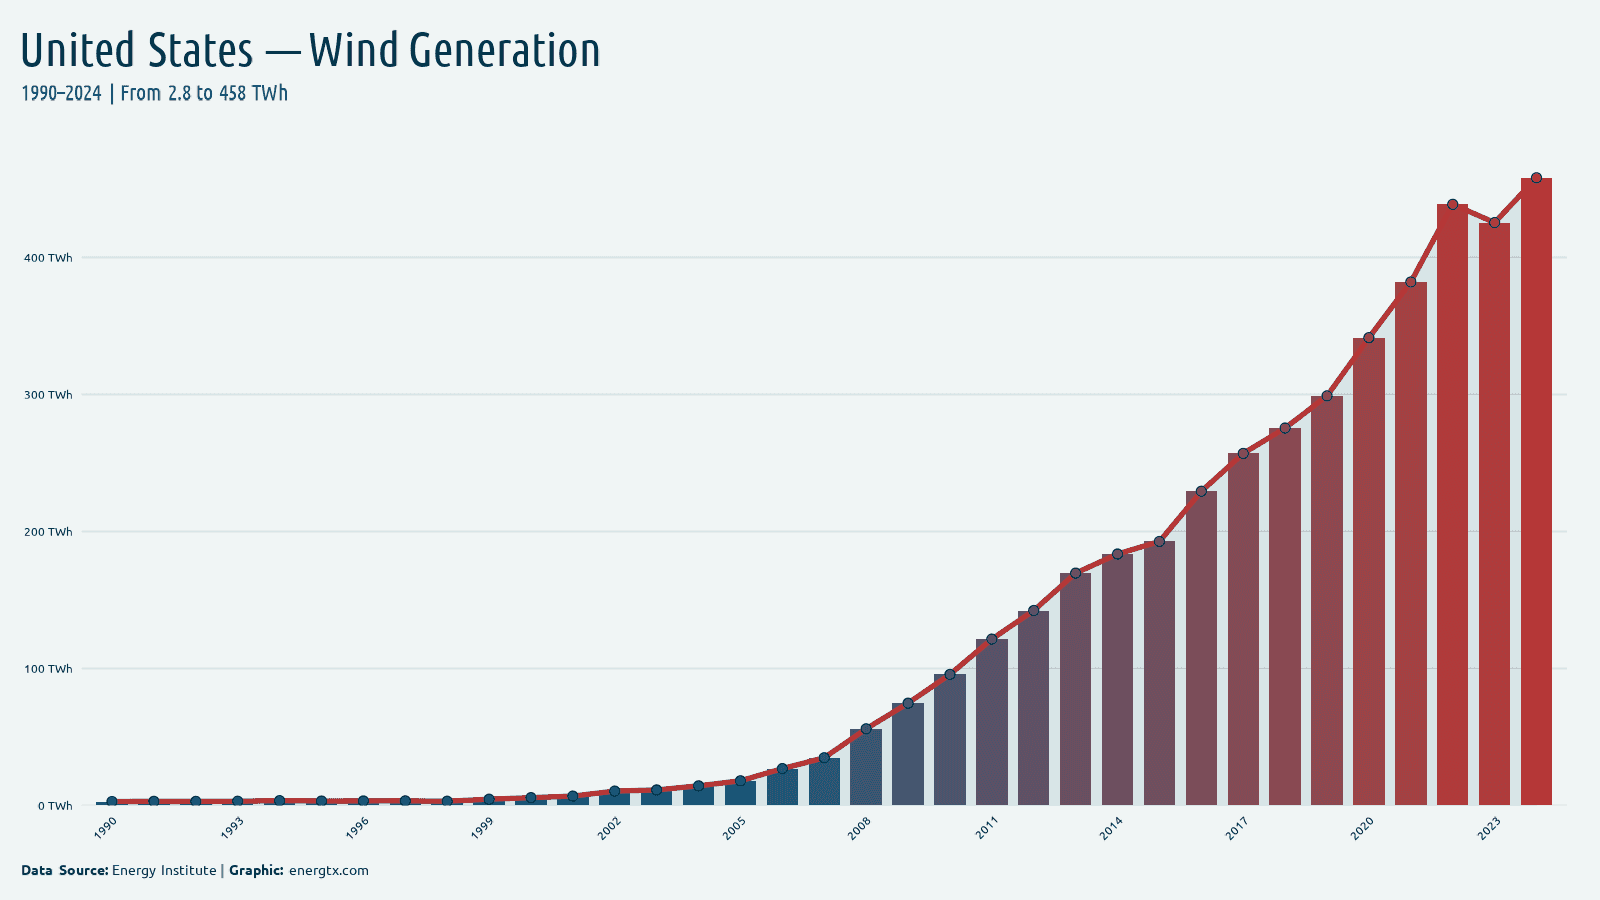
2024
Wind Generation
458.0
TWh
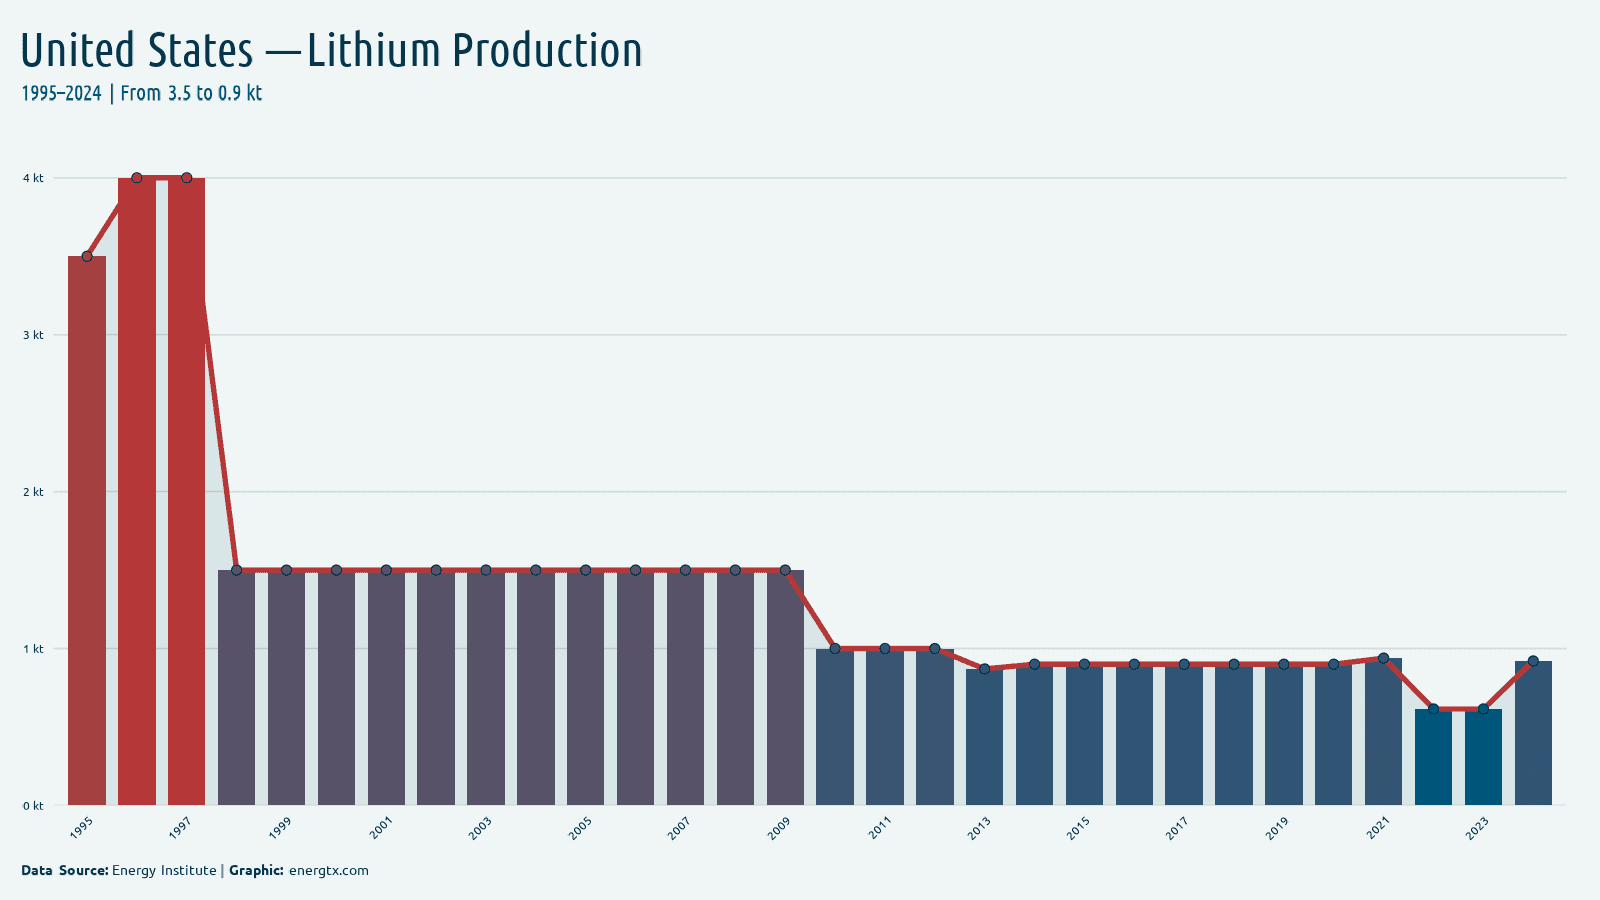
2024
Lithium Production
0.9
kt
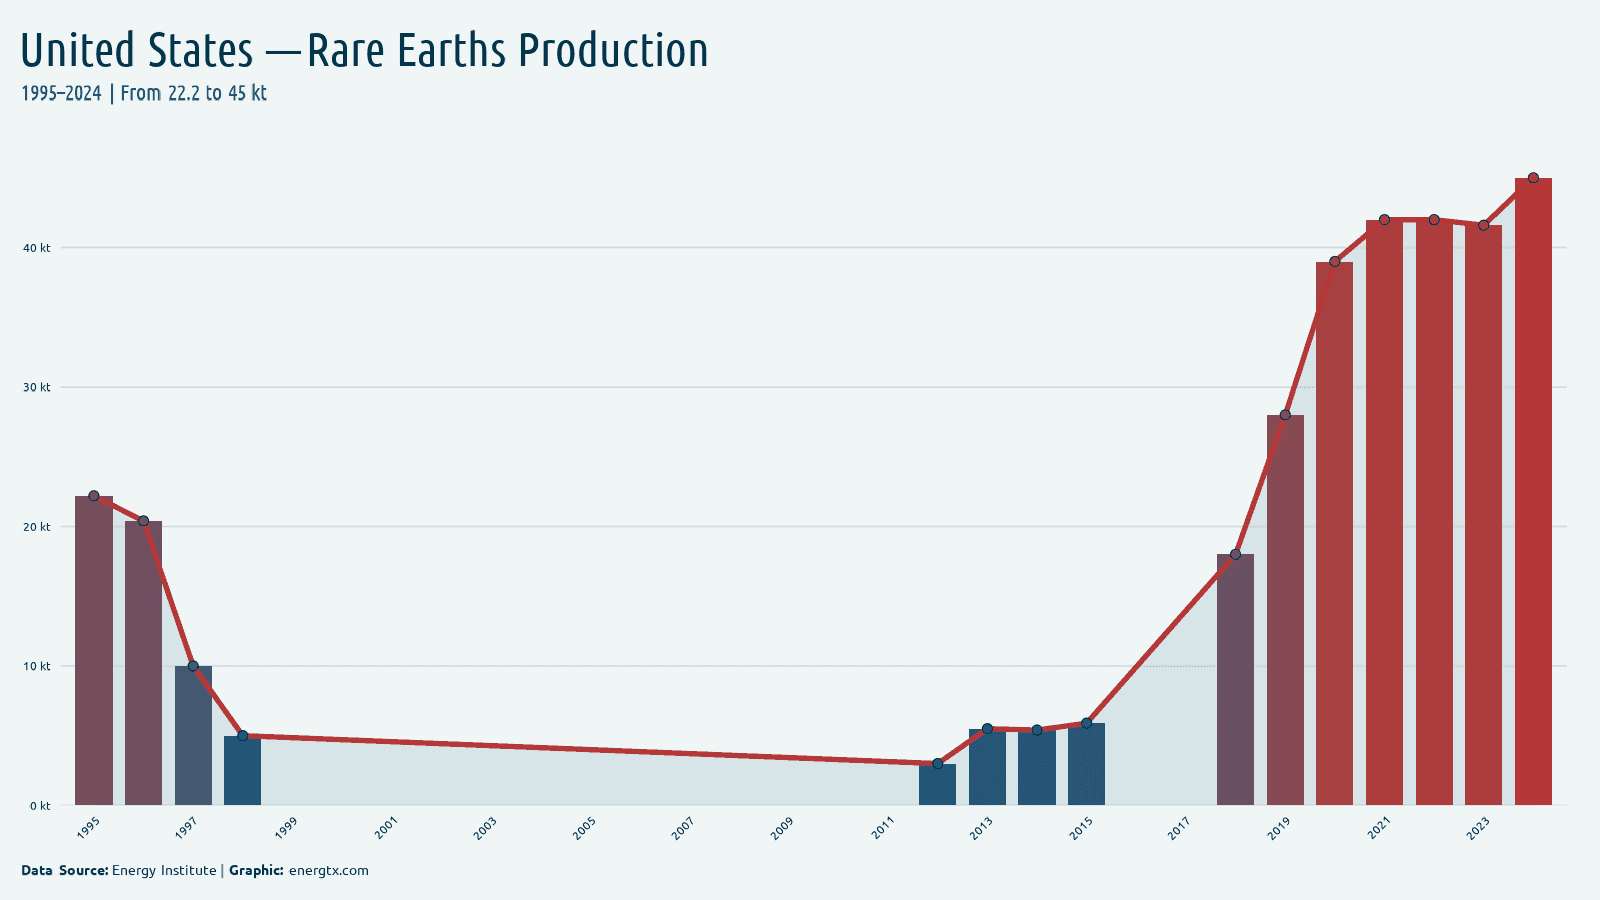
2024
Rare Earths Production
45.0
kt
2024
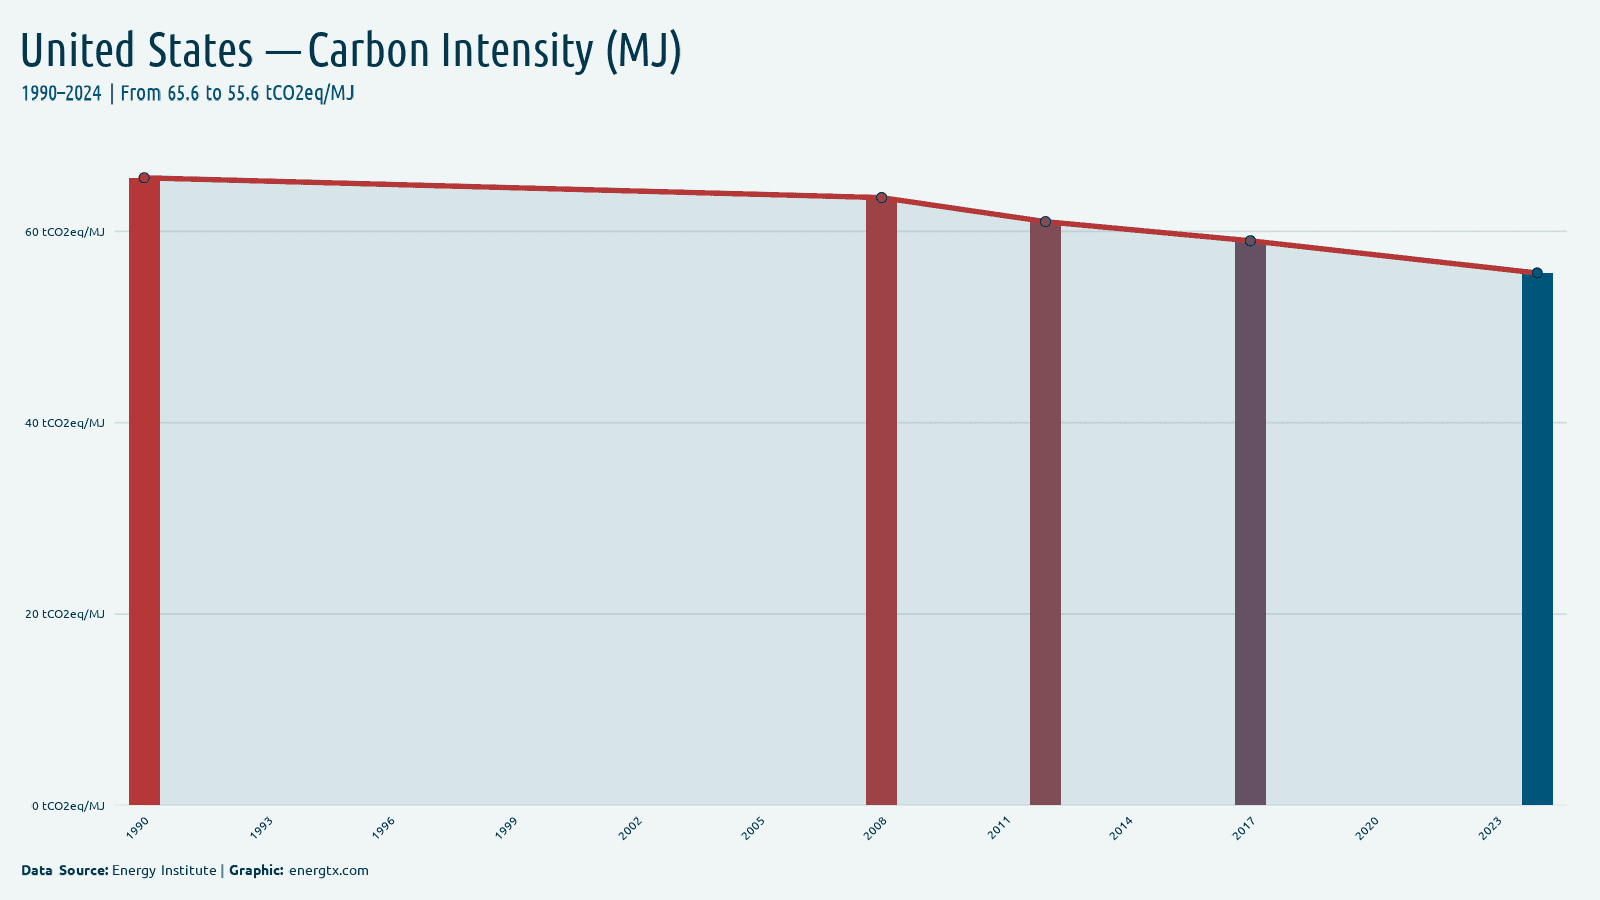
Carbon Intensity (MJ)
55.6
tCO2eq/MJ
2024
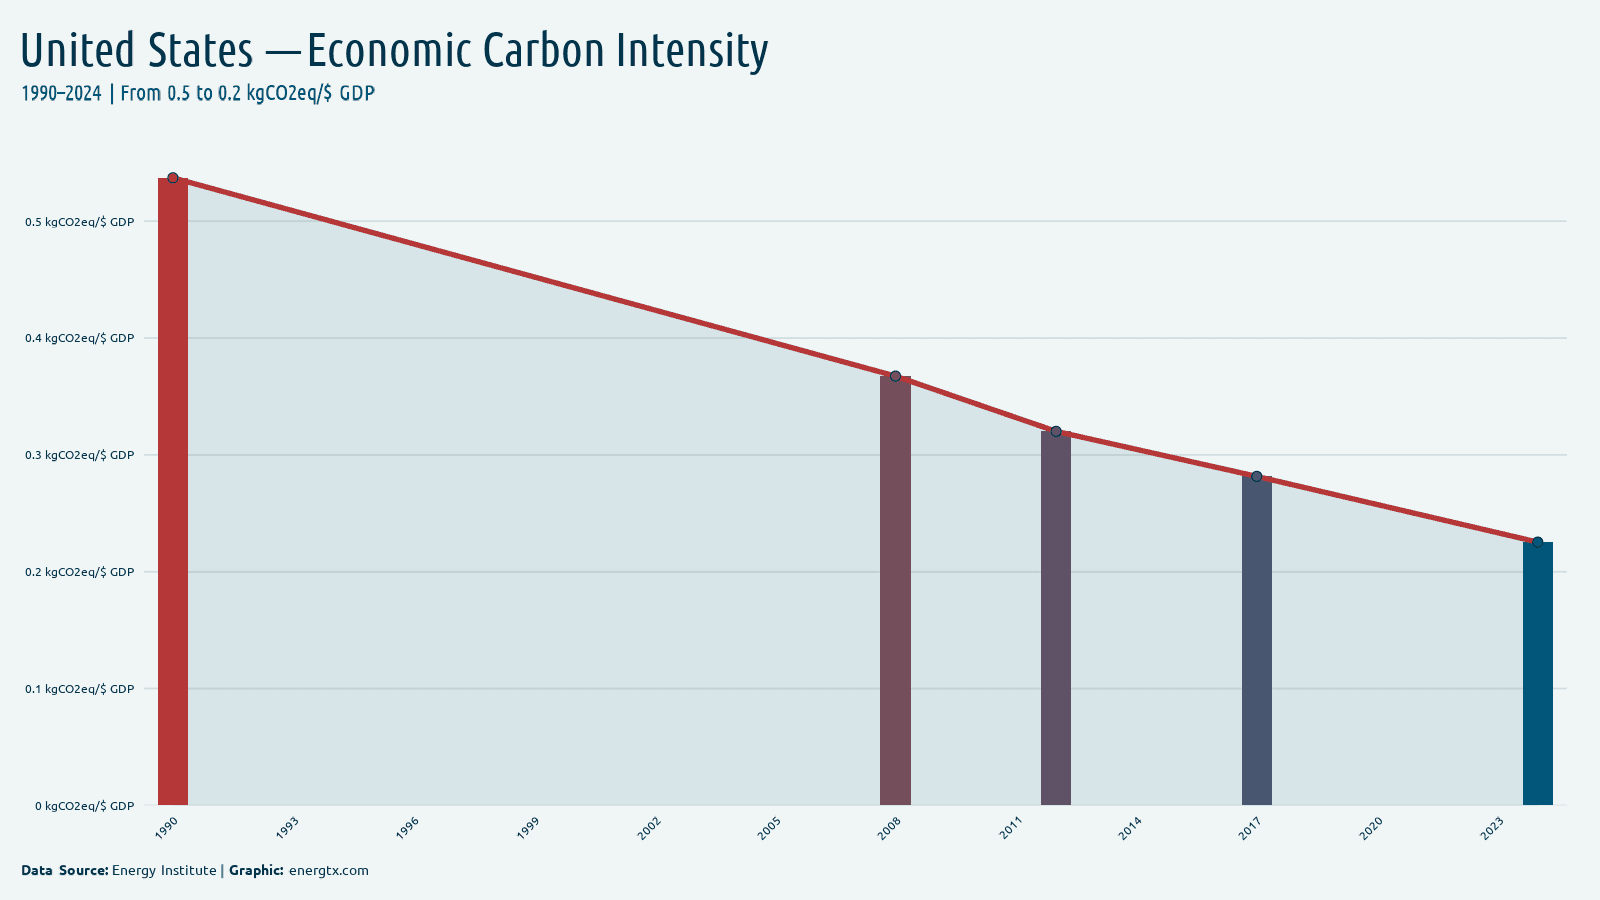
Economic Carbon Intensity
0.2
kgCO2eq/$ GDP
2024
Petroleum Consumption
20.5k
k barrels/day
2024
Petroleum Production
22.8k
k barrels/day
2024
Crude Oil Production
13.2k
k barrels/day
2024
Motor Gasoline
9.0k
k barrels/day
2024
Jet Fuel
1.7k
k barrels/day
2024
Distillate Fuel
3.8k
k barrels/day
2024
LPG
1.4k
k barrels/day
2024
Gas Production (BCF)
37.8k
billion cubic feet
2024
Gas Consumption (BCF)
33.1k
billion cubic feet
2024
Gas Imports
3.1k
billion cubic feet
2024
Gas Exports
7.7k
billion cubic feet
2024
Coal Production (TST)
512.5k
thousand short tons
2024
Coal Consumption (TST)
410.9k
thousand short tons
2024
Coal Imports
2.0k
thousand short tons
2024
Coal Exports
108.3k
thousand short tons
2023
Coal Reserves
273.2k
million short tons
2024
Elec. Generation (EIA)
4.4k
billion kWh
2024
Elec. Consumption (EIA)
4.2k
billion kWh
2024
Elec. Capacity
1.2k
GW
2024
Elec. Imports
33.3
billion kWh
2024
Elec. Exports
19.4
billion kWh
2024
Elec. Losses
212.0
billion kWh
2024
Nuclear Capacity
98.4
GW
2024
Nuclear Generation (EIA)
781.9
billion kWh
2024
Fossil Capacity
710.9
GW
2024
Fossil Generation
2.5k
billion kWh
2024
Renewable Capacity
411.4
GW
2024
Renewable Generation (EIA)
1.1k
billion kWh
2024
Hydro Capacity
79.9
GW
2024
Hydro Generation
242.9
billion kWh
2024
Solar Capacity (EIA)
176.7
GW
2024
Solar Generation (EIA)
303.8
billion kWh
2024
Wind Capacity (EIA)
152.1
GW
2024
Wind Generation (EIA)
451.9
billion kWh
2024
Geothermal Capacity
2.7
GW
2024
Geothermal Generation
15.4
billion kWh
2023
Biomass Capacity
29.3
GW
2024
Biomass Generation
54.6
billion kWh
2023
Primary Energy Production
2.6k
Mtoe
2023
Primary Energy Consumption (EIA)
2.4k
Mtoe
2023
CO2 from Coal
777.3
million metric tonnes CO2
2023
CO2 from Petroleum
2.3k
million metric tonnes CO2
2023
Energy Per Capita (Btu)
278.3
million Btu/person
2023
Energy Intensity (Btu/USD)
4.2
thousand Btu/USD PPP
2025
US Elec. Price (Avg)
13.6
cents/kWh
2025
US Elec. Sales
4058.0k
million kWh
2025
US Elec. Revenue
553.3k
million $
2025
US Elec. Customers
166210.6k
count
2025
US Elec. Price (Res)
17.3
cents/kWh
2025
US Elec. Price (Com)
13.4
cents/kWh
2025
US Elec. Price (Ind)
8.6
cents/kWh
2024
US Energy Production
94.6k
quadrillion Btu
2024
US Energy Consumption
16.5k
quadrillion Btu
2024
US Renewable Production
8.9k
quadrillion Btu
2024
US Renewable Consumption
8.7k
quadrillion Btu
2024
US Nuclear Power
781.9k
quadrillion Btu
2025
US Petroleum Consumption
20.5k
quadrillion Btu
2024
US Gas Consumption (Btu)
33.1k
quadrillion Btu
2024
US Coal Consumption (Btu)
410.9k
quadrillion Btu
2024
US Crude Production
13.2k
thousand barrels
2025
US Gas Price (Ind)
6.7
$/thousand cubic feet
2025
US Gas Price (Res)
13.8
$/thousand cubic feet
2025
US Gas Price (Com)
8.2
$/thousand cubic feet
2025
US Gas Consumption (BCF)
33515.5k
billion cubic feet
2023
Elec. from Oil
0.7%
%
2023
Elec. from Fossil
59.3%
%
2021
Elec. Renew. (excl. Hydro)
14.0%
%
2021
Renew. excl. Hydro (kWh)
612795580.0k
kWh/capita
2023
T&D Losses
5.5%
%
2023
Net Energy Imports
-9.0%
%
2023
Fossil Fuel Share
0.0%
%
2023
Renewables & Waste
5.2%
%
2023
Alt. & Nuclear Energy
14.0%
%
2022
Energy Intensity (MJ/GDP)
4.2
MJ/$ GDP
2023
Elec. from Nuclear
18.1%
%
2021
Final Energy (PJ)
58.0k
PJ
2022
Renew. Capacity/Capita
1.0k
watts/capita
2025
Crude oil closing stocks — JODI (thousand barrels)
680.0k
KBBL
2025
Crude oil production — JODI (thousand barrels/day)
13.6k
k barrels/day
2025
Refinery crude intake — JODI (thousand barrels/day)
16.4k
k barrels/day
2025
Crude oil exports — JODI (thousand barrels/day)
3.9k
k barrels/day
2025
Crude oil imports — JODI (thousand barrels/day)
6.2k
k barrels/day
2025
Diesel demand — JODI (thousand barrels/day)
4.1k
k barrels/day
2025
Gasoline demand — JODI (thousand barrels/day)
8.9k
k barrels/day
2025
Kerosene demand — JODI (thousand barrels/day)
1.7k
k barrels/day
2025
LPG demand — JODI (thousand barrels/day)
1.1k
k barrels/day
2025
Fuel oil demand — JODI (thousand barrels/day)
346.4
k barrels/day
2025
Oil products closing stocks — JODI (thousand barrels)
578.2k
KBBL
2025
Refinery output — JODI (thousand barrels/day)
18.0k
k barrels/day
2025
Total oil products demand — JODI (thousand barrels/day)
20.7k
k barrels/day
2025
Oil products exports — JODI (thousand barrels/day)
6.1k
k barrels/day
2025
Oil products imports — JODI (thousand barrels/day)
1.5k
k barrels/day
2025
Bioenergy Share
1.0%
%
2025
Coal Share
16.3%
%
2025
Gas Share
40.0%
%
2025
Hydro Share
5.3%
%
2025
Nuclear Share
17.4%
%
2025
Other Fossil Share
0.7%
%
2025
Other Renewables Share
0.4%
%
2025
Solar Share
8.6%
%
2025
Wind Share
10.3%
%
2025
GHG Emissions (Total)
7.7k
Mt CO2e
2025
GHG Per Capita
23.2
t CO2e/person
2025
Global GHG Share
10.7%
%
2025
GHG from Power
1.5k
Mt CO2e
2025
GHG from Transport
1.9k
Mt CO2e
2025
GHG from Manufacturing
690.5
Mt CO2e
2025
GHG from Buildings
616.4
Mt CO2e
2025
GHG from Agriculture
471.8
Mt CO2e
2025
GHG from Fossil Ops
1.3k
Mt CO2e
2025
GHG from Waste
159.6
Mt CO2e
2025
GHG from Land Use
738.3
Mt CO2e
2023
Effective carbon rate (€/tCO2)
18.3
€/tCO2
2023
Net effective carbon rate (€/tCO2)
18.0
€/tCO2
Charts


Trends Over Time
Electricity Consumption (per capita)kWh/capita
Dataset
| Indicator | Year | Value | Unit | Source |
|---|---|---|---|---|
| Electricity Access | 2023 | 100.0% | % | World Bank |
| Electricity Access | 2022 | 100.0% | % | World Bank |
| Electricity Access | 2021 | 100.0% | % | World Bank |
| Electricity Access | 2020 | 100.0% | % | World Bank |
| Electricity Access | 2019 | 100.0% | % | World Bank |
| Electricity Access | 2018 | 100.0% | % | World Bank |
| Electricity Access | 2017 | 100.0% | % | World Bank |
| Electricity Access | 2016 | 100.0% | % | World Bank |
| Electricity Access | 2015 | 100.0% | % | World Bank |
| Electricity Access | 2014 | 100.0% | % | World Bank |
| Electricity Access | 2013 | 100.0% | % | World Bank |
| Electricity Access | 2012 | 100.0% | % | World Bank |
| Electricity Access | 2011 | 100.0% | % | World Bank |
| Electricity Access | 2010 | 100.0% | % | World Bank |
| Electricity Access | 2009 | 100.0% | % | World Bank |
| Electricity Access | 2008 | 100.0% | % | World Bank |
| Electricity Access | 2007 | 100.0% | % | World Bank |
| Electricity Access | 2006 | 100.0% | % | World Bank |
| Electricity Access | 2005 | 100.0% | % | World Bank |
| Electricity Access | 2004 | 100.0% | % | World Bank |
| Electricity Access | 2003 | 100.0% | % | World Bank |
| Electricity Access | 2002 | 100.0% | % | World Bank |
| Electricity Access | 2001 | 100.0% | % | World Bank |
| Electricity Access | 2000 | 100.0% | % | World Bank |
| Electricity Access | 1999 | 100.0% | % | World Bank |
| Electricity Access | 1998 | 100.0% | % | World Bank |
| Electricity Access | 1997 | 100.0% | % | World Bank |
| Electricity Access | 1996 | 100.0% | % | World Bank |
| Electricity Access | 1995 | 100.0% | % | World Bank |
| Electricity Access | 1994 | 100.0% | % | World Bank |
| Electricity Access | 1993 | 100.0% | % | World Bank |
| Electricity Access | 1992 | 100.0% | % | World Bank |
| Electricity Access | 1991 | 100.0% | % | World Bank |
| Electricity Access | 1990 | 100.0% | % | World Bank |
| Alt. & Nuclear Energy | 2023 | 14.0% | % | World Bank |
| Alt. & Nuclear Energy | 2022 | 13.7% | % | World Bank |
| Alt. & Nuclear Energy | 2021 | 13.6% | % | World Bank |
| Alt. & Nuclear Energy | 2020 | 14.3% | % | World Bank |
| Alt. & Nuclear Energy | 2019 | 13.1% | % | World Bank |
| Alt. & Nuclear Energy | 2018 | 13.0% | % | World Bank |
| Alt. & Nuclear Energy | 2017 | 13.2% | % | World Bank |
| Alt. & Nuclear Energy | 2016 | 12.8% | % | World Bank |
| Alt. & Nuclear Energy | 2015 | 12.3% | % | World Bank |
| Alt. & Nuclear Energy | 2014 | 12.2% | % | World Bank |
| Alt. & Nuclear Energy | 2013 | 12.1% | % | World Bank |
| Alt. & Nuclear Energy | 2012 | 12.0% | % | World Bank |
| Alt. & Nuclear Energy | 2011 | 12.0% | % | World Bank |
| Alt. & Nuclear Energy | 2010 | 11.7% | % | World Bank |
| Alt. & Nuclear Energy | 2009 | 11.8% | % | World Bank |
| Alt. & Nuclear Energy | 2008 | 11.2% | % | World Bank |
| Alt. & Nuclear Energy | 2007 | 10.8% | % | World Bank |
| Alt. & Nuclear Energy | 2006 | 10.9% | % | World Bank |
| Alt. & Nuclear Energy | 2005 | 10.6% | % | World Bank |
| Alt. & Nuclear Energy | 2004 | 10.7% | % | World Bank |
| Alt. & Nuclear Energy | 2003 | 10.6% | % | World Bank |
| Alt. & Nuclear Energy | 2002 | 10.8% | % | World Bank |
| Alt. & Nuclear Energy | 2001 | 10.7% | % | World Bank |
| Alt. & Nuclear Energy | 2000 | 10.8% | % | World Bank |
| Alt. & Nuclear Energy | 1999 | 10.9% | % | World Bank |
| Alt. & Nuclear Energy | 1998 | 10.5% | % | World Bank |
| Alt. & Nuclear Energy | 1997 | 10.1% | % | World Bank |
| Alt. & Nuclear Energy | 1996 | 10.9% | % | World Bank |
| Alt. & Nuclear Energy | 1995 | 11.0% | % | World Bank |
| Alt. & Nuclear Energy | 1994 | 10.6% | % | World Bank |
| Alt. & Nuclear Energy | 1993 | 10.4% | % | World Bank |
| Alt. & Nuclear Energy | 1992 | 10.6% | % | World Bank |
| Alt. & Nuclear Energy | 1991 | 10.8% | % | World Bank |
| Alt. & Nuclear Energy | 1990 | 10.3% | % | World Bank |
| Biofuels Consumption | 2024 | 1.9k | PJ | Energy Institute |
| Biofuels Consumption | 2023 | 1.8k | PJ | Energy Institute |
| Biofuels Consumption | 2022 | 1.6k | PJ | Energy Institute |
| Biofuels Consumption | 2021 | 1.5k | PJ | Energy Institute |
| Biofuels Consumption | 2020 | 1.4k | PJ | Energy Institute |
| Biofuels Consumption | 2019 | 1.5k | PJ | Energy Institute |
| Biofuels Consumption | 2018 | 1.5k | PJ | Energy Institute |
| Biofuels Consumption | 2017 | 1.5k | PJ | Energy Institute |
| Biofuels Consumption | 2016 | 1.5k | PJ | Energy Institute |
| Biofuels Consumption | 2015 | 1.4k | PJ | Energy Institute |
| Biofuels Consumption | 2014 | 1.3k | PJ | Energy Institute |
| Biofuels Consumption | 2013 | 1.3k | PJ | Energy Institute |
| Biofuels Consumption | 2012 | 1.2k | PJ | Energy Institute |
| Biofuels Consumption | 2011 | 1.2k | PJ | Energy Institute |
| Biofuels Consumption | 2010 | 1.1k | PJ | Energy Institute |
| Biofuels Consumption | 2009 | 929.3 | PJ | Energy Institute |
| Biofuels Consumption | 2008 | 818.0 | PJ | Energy Institute |
| Biofuels Consumption | 2007 | 598.8 | PJ | Energy Institute |
| Biofuels Consumption | 2006 | 474.1 | PJ | Energy Institute |
| Biofuels Consumption | 2005 | 338.3 | PJ | Energy Institute |
| Biofuels Consumption | 2004 | 289.5 | PJ | Energy Institute |
| Biofuels Consumption | 2003 | 229.4 | PJ | Energy Institute |
| Biofuels Consumption | 2002 | 169.1 | PJ | Energy Institute |
| Biofuels Consumption | 2001 | 141.5 | PJ | Energy Institute |
| Biofuels Consumption | 2000 | 133.2 | PJ | Energy Institute |
| Biofuels Consumption | 1999 | 116.2 | PJ | Energy Institute |
| Biofuels Consumption | 1998 | 111.8 | PJ | Energy Institute |
| Biofuels Consumption | 1997 | 101.2 | PJ | Energy Institute |
| Biofuels Consumption | 1996 | 79.9 | PJ | Energy Institute |
| Biofuels Consumption | 1995 | 111.4 | PJ | Energy Institute |
| Biofuels Consumption | 1994 | 103.8 | PJ | Energy Institute |
| Biofuels Consumption | 1993 | 92.7 | PJ | Energy Institute |
| Biofuels Consumption | 1992 | 79.4 | PJ | Energy Institute |
| Biofuels Consumption | 1991 | 69.8 | PJ | Energy Institute |
| Biofuels Consumption | 1990 | 60.2 | PJ | Energy Institute |
| Biomass Capacity | 2023 | 29.3 | GW | EIA |
| Biomass Capacity | 2022 | 22.5 | GW | EIA |
| Biomass Capacity | 2021 | 18.7 | GW | EIA |
| Biomass Capacity | 2020 | 16.0 | GW | EIA |
| Biomass Capacity | 2019 | 15.7 | GW | EIA |
| Biomass Capacity | 2018 | 16.1 | GW | EIA |
| Biomass Capacity | 2017 | 16.9 | GW | EIA |
| Biomass Capacity | 2016 | 16.0 | GW | EIA |
| Biomass Capacity | 2015 | 15.9 | GW | EIA |
| Biomass Capacity | 2014 | 16.3 | GW | EIA |
| Biomass Capacity | 2013 | 15.7 | GW | EIA |
| Biomass Capacity | 2012 | 14.1 | GW | EIA |
| Biomass Capacity | 2011 | 13.0 | GW | EIA |
| Biomass Capacity | 2010 | 12.3 | GW | EIA |
| Biomass Capacity | 2009 | 12.1 | GW | EIA |
| Biomass Capacity | 2008 | 12.0 | GW | EIA |
| Biomass Capacity | 2007 | 11.6 | GW | EIA |
| Biomass Capacity | 2006 | 11.0 | GW | EIA |
| Biomass Capacity | 2005 | 10.7 | GW | EIA |
| Biomass Capacity | 2004 | 10.5 | GW | EIA |
| Biomass Capacity | 2003 | 10.3 | GW | EIA |
| Biomass Capacity | 2002 | 10.3 | GW | EIA |
| Biomass Capacity | 2001 | 10.2 | GW | EIA |
| Biomass Capacity | 2000 | 10.5 | GW | EIA |
| Biomass Generation | 2024 | 54.6 | billion kWh | EIA |
| Biomass Generation | 2023 | 57.2 | billion kWh | EIA |
| Biomass Generation | 2022 | 63.0 | billion kWh | EIA |
| Biomass Generation | 2021 | 66.4 | billion kWh | EIA |
| Biomass Generation | 2020 | 67.6 | billion kWh | EIA |
| Biomass Generation | 2019 | 70.8 | billion kWh | EIA |
| Biomass Generation | 2018 | 74.8 | billion kWh | EIA |
| Biomass Generation | 2017 | 75.7 | billion kWh | EIA |
| Biomass Generation | 2016 | 76.5 | billion kWh | EIA |
| Biomass Generation | 2015 | 77.6 | billion kWh | EIA |
| Biomass Generation | 2014 | 77.4 | billion kWh | EIA |
| Biomass Generation | 2013 | 74.5 | billion kWh | EIA |
| Biomass Generation | 2012 | 71.4 | billion kWh | EIA |
| Biomass Generation | 2011 | 70.8 | billion kWh | EIA |
| Biomass Generation | 2010 | 68.9 | billion kWh | EIA |
| Biomass Generation | 2009 | 66.4 | billion kWh | EIA |
| Biomass Generation | 2008 | 66.8 | billion kWh | EIA |
| Biomass Generation | 2007 | 67.8 | billion kWh | EIA |
| Biomass Generation | 2006 | 67.8 | billion kWh | EIA |
| Biomass Generation | 2005 | 67.1 | billion kWh | EIA |
| Biomass Generation | 2004 | 67.8 | billion kWh | EIA |
| Biomass Generation | 2003 | 67.4 | billion kWh | EIA |
| Biomass Generation | 2002 | 67.2 | billion kWh | EIA |
| Biomass Generation | 2001 | 61.6 | billion kWh | EIA |
| Biomass Generation | 2000 | 65.5 | billion kWh | EIA |
| Biomass Generation | 1999 | 63.6 | billion kWh | EIA |
| Biomass Generation | 1998 | 62.4 | billion kWh | EIA |
| Biomass Generation | 1997 | 62.3 | billion kWh | EIA |
| Biomass Generation | 1996 | 61.3 | billion kWh | EIA |
| Biomass Generation | 1995 | 61.0 | billion kWh | EIA |
| Biomass Generation | 1994 | 60.7 | billion kWh | EIA |
| Biomass Generation | 1993 | 59.4 | billion kWh | EIA |
| Biomass Generation | 1992 | 58.1 | billion kWh | EIA |
| Biomass Generation | 1991 | 54.1 | billion kWh | EIA |
| Biomass Generation | 1990 | 49.4 | billion kWh | EIA |
| Carbon Intensity (MJ) | 2024 | 55.6 | tCO2eq/MJ | Energy Institute |
| Carbon Intensity (MJ) | 2017 | 59.0 | tCO2eq/MJ | Energy Institute |
| Carbon Intensity (MJ) | 2012 | 61.0 | tCO2eq/MJ | Energy Institute |
| Carbon Intensity (MJ) | 2008 | 63.5 | tCO2eq/MJ | Energy Institute |
| Carbon Intensity (MJ) | 1990 | 65.6 | tCO2eq/MJ | Energy Institute |
| Carbon Intensity | 2024 | 5.3 | tCO2/EJ | Energy Institute |
| Carbon Intensity | 2023 | 5.4 | tCO2/EJ | Energy Institute |
| Carbon Intensity | 2022 | 5.1 | tCO2/EJ | Energy Institute |
| Carbon Intensity | 2021 | 4.9 | tCO2/EJ | Energy Institute |
| Carbon Intensity | 2020 | 5.2 | tCO2/EJ | Energy Institute |
| Carbon Intensity | 2019 | 5.3 | tCO2/EJ | Energy Institute |
| Carbon Intensity | 2018 | 4.7 | tCO2/EJ | Energy Institute |
| Carbon Intensity | 2017 | 4.3 | tCO2/EJ | Energy Institute |
| Carbon Intensity | 2016 | 4.1 | tCO2/EJ | Energy Institute |
| Carbon Intensity | 2015 | 4.4 | tCO2/EJ | Energy Institute |
| Carbon Intensity | 2014 | 4.3 | tCO2/EJ | Energy Institute |
| Carbon Intensity | 2013 | 4.0 | tCO2/EJ | Energy Institute |
| Carbon Intensity | 2012 | 3.9 | tCO2/EJ | Energy Institute |
| Carbon Intensity | 2011 | 3.6 | tCO2/EJ | Energy Institute |
| Carbon Intensity | 2010 | 3.3 | tCO2/EJ | Energy Institute |
| Carbon Intensity | 2009 | 3.2 | tCO2/EJ | Energy Institute |
| Carbon Intensity | 2008 | 3.2 | tCO2/EJ | Energy Institute |
| Carbon Intensity | 2007 | 3.0 | tCO2/EJ | Energy Institute |
| Carbon Intensity | 2006 | 3.0 | tCO2/EJ | Energy Institute |
| Carbon Intensity | 2005 | 2.9 | tCO2/EJ | Energy Institute |
| Carbon Intensity | 2004 | 2.9 | tCO2/EJ | Energy Institute |
| Carbon Intensity | 2003 | 2.9 | tCO2/EJ | Energy Institute |
| Carbon Intensity | 2002 | 3.0 | tCO2/EJ | Energy Institute |
| Carbon Intensity | 2001 | 3.0 | tCO2/EJ | Energy Institute |
| Carbon Intensity | 2000 | 3.0 | tCO2/EJ | Energy Institute |
| Carbon Intensity | 1999 | 3.0 | tCO2/EJ | Energy Institute |
| Carbon Intensity | 1998 | 3.2 | tCO2/EJ | Energy Institute |
| Carbon Intensity | 1997 | 3.3 | tCO2/EJ | Energy Institute |
| Carbon Intensity | 1996 | 3.3 | tCO2/EJ | Energy Institute |
| Carbon Intensity | 1995 | 3.4 | tCO2/EJ | Energy Institute |
| Carbon Intensity | 1994 | 3.4 | tCO2/EJ | Energy Institute |
| Carbon Intensity | 1993 | 3.3 | tCO2/EJ | Energy Institute |
| Carbon Intensity | 1992 | 3.5 | tCO2/EJ | Energy Institute |
Showing 200 of 11736 records. Download for the full dataset.
Download United States Data
Found a data error?
Our data is sourced from World Bank, Energy Institute, OWID, OECD, IAEA, GCP, and Eurostat. If you notice an incorrect value, missing data, or any discrepancy for United States, please let us know so we can investigate and correct it. Include the indicator name, year, and a brief description of the issue.
Report a data error